Financial Analysis and Planning Ratio Analysis – CA Inter FM Question Bank is designed strictly as per the latest syllabus and exam pattern.
Financial Analysis and Planning Ratio Analysis – CA Inter FM Question Bank
Question 1.
Answer the following:
What is quick ratio? What does it signify? (Nov 2008, 2 marks)
Answer:
Quick ratio also termed as “acid test ratio” is one of the best measures of liquidity.
It is worked out as follows:
Quick Ratio = \(\frac{\text { Quick Assets }}{\text { Quick liabilities }}\)
In the above formula:
Quick Assets = Current Assets – Inventories
Quick liabilities = Current liabilities – Bank Overdraft – Cash credit
Quick ratio of 1:1 is an ideal ratio significance:
It indicates whether the firm is in a position to pay its current liabilities within a month or immediately.
Question 2.
Assuming the current ratio of a Company is 2, STATE in each of the following cases whether the ratio will improve or decline or will have no change:
(i) Payment of current liability
(ii) Purchase of Property Plant and Equipment by cash
(iii) Cash collected from Customers
(iv) Bills receivable dishonored
(v) Issue of new shares
Answer:
Current Ratio = \(\frac{\text { Current Assets }(\mathrm{CA})}{\text { Current Liabilities }(\mathrm{CL})} \) =2 i.e. 2: 1
| Situation | Improve/Decline/No Change | Reason |
| (i) Payment of Current liability | Current Ratio will improve | Let us assume CA is ₹ 2 lakhs and current CL ₹ 1 lakh. It payment of Current Liability = ₹ 10,000 then, CA = ₹ 1, 90,000 CL = 90,000. Current Ratio = \(\frac{1,90,000}{90,000} \) =2.11 :1. When Current Ratio is 2:1 Payment of Current liability will reduce the same amount in the numerator and denominator. Hence, the ratio will improve. |
| (ii) Purchase of PPE by cash | Current Ratio will decline | Since the cash being a current asset converted into Property Plant and Equipment, current assets reduced, thus, current ratio will fall. |
| (iii) Cash collected from Customers | Current Ratio will not change | Cash will increase and Debtors will reduce. Hence, change in Current Asset. |
| (iv) Bills Receivable dishonored | Current Ratio will not change | Bills Receivable will come down and debtors will increase. Hence, no change in Current Assets. |
| (v) Issue of New Shares | Current Ratio will improve | As cash will increase, Current Assets will increase and current ratio will increase. |
Question 3.
Answer the following:
Explain the need of debt-service coverage ratio. (May 2007, 2 marks)
OR
Answer the following:
How is Debt service coverage ratio calculated? What is its significance? (May 2009, 2 marks)
Answer:
Debt-Service Coverage Ratio:
- This ratio is the vital indicator to the lender to assess the extent of ability of the borrower to service the loan in regard to timely payment of interest and repayment of principal amount.
- It shows whether the business is earning sufficient profits to pay not only the interest charges, but also the instalment due of the principal amount.
- Debt service coverage ratio of 1: 2 is considered ideal by the financial institutions.
This ratio will enable the lender to take correct view of the borrower’s repayment capacity. - The ratio is calculated as follows:
= \(\frac{\text { Earning available for debt service }}{\text { Interest on loan + Instalment of the principal amount }}\) - Where earning available for debt service = Profit after tax + Depreciation + Interest on Loan.
Question 4.
Answer the following:
Comment on the Debt Service Coverage Ratio. (May 2014, 4 marks)
Answer:
Debt Service Coverage Ratio (DSCR): This ratio indicates the liability of the company to repay the interest and the fixed installments on accounts of the debt fund which is there in the capital structure out of the cash profit earned during the current year.
The higher the ratio the better it is. A ratio of less than one may be taken as a sign of long-term solvency problem as it indicates that the firm does not generate cash internally to repay the debt. High credit rating firms target DSCR to be greater than 2 in its entire loan life. High DSCR facilitates the firm to borrow at the most competitive rates. Lenders are interested in this ratio to judge the firm’s ability to pay off current interest and installments. Debt Service Coverage Ratio = \(\frac{\text { Earning available for Debt Service }}{\text { Interest }+ \text { Installment }}\)
Question 5.
Answer the following:
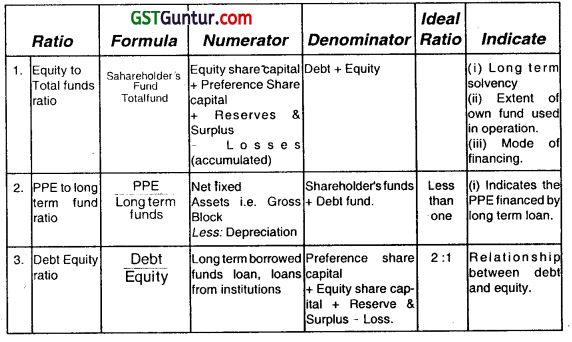
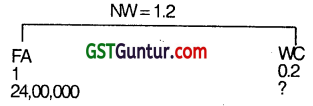
From the information given below calculate the amount of Property Plant and Equipment and Proprietor’s fund.
Ratio of Property Plant and Equipment to proprietors fund = 0.75
Net working capital = ₹ 6,00,000 (Nov 2009, 2 marks)
Answer:
Calculation of PPE and Proprietors Fund = 0.75
Since Ratio of PPE to Proprietor1s Fund = 0.75 proprietor’s Fund
Therefore, Property Plant and Equipment = 0.25 proprietor’s Fund
Net Working capital 6,00,000 = 0.25 Proprietor’s fund
Therefore, Proprietors fund = \(\frac{₹ 6,00,000}{0.25}\) = ₹ 24,00,000
Proprietor’s Fund = ₹ 24,00,000
Since, PPE = 0.75 Proprietor’s Fund
therefore, PPE = 0.75 × 24,00,000 = ₹ 18,00,000
Property Plant and Equipment = ₹ 18,00,000
Question 6.
Answer the following:
What do you mean by Stock Turnover ratio and Gearing ratio? (Nov 2008, 3 marks)
Answer:
Inventory/Stock turn over ratio
It establishes the relationship between the cost of goods sold during the year and average inventory held during the year.
It is calculated as follows:
Inventory/Stock turnover Ratio = \(\frac{\text { Sales/Turnover }}{\text { Average/inventory }}\)
In above formula:
Average inventory = \(\frac{\text { Opening Stock }+ \text { Closing Stock }}{2} \)
This ratio indicates that how fast inventory is sold.
A high ratio is good from the viewpoint of liquidity and a low ratio would indicate that inventory is not sold and remains in godown for a long time.
Note : Turnover is generally taken as cost of goods sold.
Gearing Ratio:
It is also called as “Capital Gearing Ratio”. It shows the proportion of fixed interest (dividend) bearing capital to funds belonging to equity shareholders funds. This ratio indicate how much of the business is funded by borrowing.
It is calculated as follows:
\(\text { Preference Capital }+\frac{\text { Debentures }+ \text { Longtermloans }}{\text { Equity share capital + Reserves and Surplus – Iosses }} \)
This ratio helps to judge the long-term solvency position of a firm.
Question 7.
Discuss any three ratios computed for investment analysis. (Nov 2004, 3 marks)
Answer:
Question 8.
Discuss the Financial ratios for evaluating company performance on operating efficiency and liquidity position aspects. (Nov 2006, 4 marks)
Answer:
Financial ratios for evaluating company performance on operating efficiency and liquidity position aspects:
1. Operating efficiency: Financial Ratio Analysis helps to determine degree of efficiency and effective utilisation of assets. We measure operational efficiency of an enterprise with the help of activity ratio. It helps to determine solvency position of an enterprise. Following are examples of activity ratio:
- Capital turn over ratio = \(\frac{\text { Net Sales }}{\text { Capital employed }} \)
- Total asset turn over ratio = \(\frac{\text { Net Sales }}{\text { Total Assets }} \)
- Property Plant and Equipment turnover ratio = \(\frac{\text { Net Sales }}{\text { PPE }} \)
2. Liquidity positions :
Ratio analysis also helps to determine liquidity positions. A firm should be able to meet all its short-turn obligations. It is current asset that yields funds in short period. Current assets should not only yield sufficient funds to meet current liabilities as they fall due but also enable the firm to carry on its day-to-day activity. If above qualities are present in an enterprise are then firm can be said to have good liquidity position. Current ratio, liquid ratio, Debt equity ratios mainly used to judge liquidity position. These ratios are particularly useful in credit analysis by banks and other suppliers of short term loans.
Following are the Liquidity Ratios:
Current Ratio = \(\frac{\text { Current Assets }}{\text { Current Liabilities }} \)
Quick Ratio = \(\frac{\text { Quick Assets }}{\text { Current Liabilities }} \)
Cash Ratio = \(\frac{\text { Cast and Bank Balance }+ \text { Marketable Securities }}{\text { Current Liabilities }}\)
Question 9.
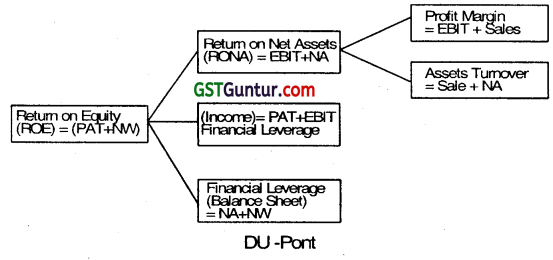
Diagrammatically present the DU PONT CHART to calculate return on equity. (May 2007, 3 marks)
Answer:
Du-Pont Chart was developed by the USA-based company Du-Point. This chart is a chart of financial ratios, which analyses the Net Profit Margin in terms of asset turnout. This chart shows that the ROI is ascertained as a product of Net profit margin ratio and investment turnover ratio. There are three components in the calculation of return on equity using the traditional Du Pont model- the net profit margin, asset turnover, and the equity multiplier. By examining each input individually, the sources of a company’s return on equity can be discovered and compared to its competitors.
Return of Equity = (Net Profit Margin) (Asset Turnover) (Equity Multiplier)
Question 10.
How is return on capital employed calculated? What is its significance? (Nov 2008, 2 marks)
Answer:
Return
Return on capital employed = \(\frac{\text { Return }}{\text { Capital employed }} \times 100 \)
Return = Profit after tax
+Tax
+ Interest
+ Nontrading Expenses
– Non-operating incomes
Capital employed = Equity share capital
+ Preference share capital
+ Reserves & surplus + P & L (Cr. Bal.) + Long term loans
+ Debentures
– Non-trading investment – Fictitious Assets
– P & L (Dr. Bal)
Significance of Return on Capital employed:
- Overall profitability of the business is highlighted
- Comparison of Return on capital employed with rate of interest debt leads to financial leverage.
Question 11.
Discuss the composition of Return on Equity (ROE) using the DuPont model. (May 2009, 3 marks)
Answer:
Composition of Return on Equity using the DuPont Model:
There are three components in the computation of return on equity using the traditional DuPont model – the net profit margin, asset turnover, and the equity multiplier. By examining each input individually, the sources of a company’s return on equity can be discovered and compared to its competitors.
| 1. Net Profit Margin | The net profit margin is simply the after-tax profit a company generates for each rupee of revenue. Net profit margin = Net Income ÷ Revenue Net profit margin is a safety cushion; the lower the margin, lesser the room for error. |
| 2. Asset Turnover | The asset turnover ratio is a measures of how effectively a company converts s assets into sales. It is calculated as follows: Asset Turnover = Revenue ÷ Assets The asset turnover ratio tends to be inversely related to the net profit margin; i.e., the higher the net profit margin, the lower the asset turnover. |
| 3. Equity Multiplier | It is possible for a company with terrible sales and margins to take on excessive debt and artificially increase its return on equity. The equity multiplier, a measure of financial leverage, allows the investor to see what portion of the return on equity is the result of debt. The equity multiplier is calculated as follows: Equity Multiplier = Assets ÷ Shareholders’ EquityComputation of Return of Equity To calculate the return on equity using the DuPont model, simply multiply the three components (net profit margin, asset turnover, and equity multiplier.) Return on Equity = Net profit margin × Asset turnover × Equity multiplier |
Question 12.
Explain the following ratios:
(i) Operating ratio
(ii) Price earning ratio (May 2011, 4 marks)
Answer:
(i) Operating Ratio: A ratio that shows the efficiency of a company’s management by comparing operating expense to net sales is classified as an Operating Ratio.
It Is calculated as follows: \(\frac{\text { Operating expenses }}{\text { Net Sales }} \)
The smaller the ratio, the greater the organization’s ability to generate profit if revenues decrease. when using this ratio, however, investors should be aware that it doesn’t take debt repayment or expansion into account.
(ii) Price Earning Ratio: The price earning ratio indicates the expectation of equity investors about earnings of the firm. It relates earnings to market price and is generally taken as a summary measure of growth potential of an investment, risk characteristics, shareholders’ orientation, corporate image, and degree of liquidity.
It is calculated as:
P.E Ratio = \(\frac{\text { Market price per share }}{\text { Earnings per share }} \)
Question 13.
Answer the following:
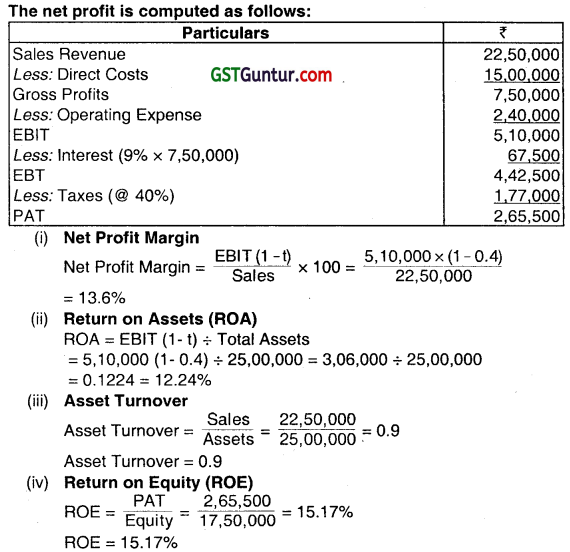
MNP Limited has made plans for the next year 2010-11. It is estimated that the company wifl employ total assets of ₹ 25,00,000; 30% of assets being financed by debt at an interest cost of 9% p.a. The direct costs for the year are estimated at ₹ 15,00,000 and all other operating expenses are estimated at ₹ 2,40,000. The sales revenue are estimated at ₹ 22,50,000.
Tax rate is assumed to be 40%.
Required to calculate:
(i) Net profit margin
(ii) Return on Assets
(iii) Asset turnover
(iv) Return on equity (Nov 2010, 5 marks)
Answer:
Question 14.
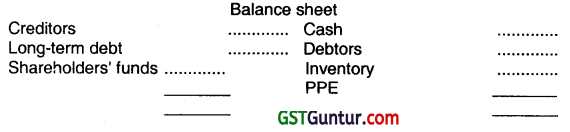
From the following information, prepare a summarised Balance Sheet as at 31st March 2002:
Working Capital ₹ 2,40,000
Bank overdraft ₹ 40,000
PPE to Proprietary ratio 0.75
Reserves and Surplus ₹ 1.60,000
Current ratio 2.5
Liquid ratio 1.5
(Nov 2002, 6 Marks)
Answer:
Working Notes:
1. Current assets and Current liabilities computation:
=\( \frac{\text {Current assets }}{\text {Current liabilities}} \)= \(\frac{2.5}{1}\)
or, Current assets = 2.5 Current liabilities.
or, Working capital = Current assets – Current liabilities
or, ₹ 2,40,000 = 2.5 C.L. – I. C. L.
or, 1.5 C. L. = ₹ 2,40,000
∴ Current liability – ₹ 1,60,000
& Current assets = 2.5 x 1,60,000 = ₹ 4,00,000
2. Computation of stock:
Liquid Ratio = \(\frac{\text { Liquid Assets }}{\text { Current Liabilities }} \)
Or 1.5 = \(=\frac{\text { Current assets – stock }}{₹ 1,60,000}\)
1.5 x 1,60,000 = 4,00,000 – Stock
2,40,000 = 4,00,000 – Stock
∴ Stock = 4,00,000 – 2,40,000 = 1,60,000
3. Computation of Proprietary Fund PPE, creditors & capital:
Proprietary fund = \(\frac{\text { PPE }}{\text { Proprietary Fund }}\) = 0.75
PPE = 0.75 Proprietary fund
& Net working capital = 0.25 Proprietary fund
or, 2,40,000/0.25 = Proprietary fund
Proprietary fund = ₹ 9,60,000
PPE = 0.75 Proprietary fund
= 0.75 × 9,60,000
=₹ 7,20,000
Capital = Proprietary fund – Reserve & surplus
= 9,60,000 – 1,60,000
= ₹ 8,00,000
Sundry Creditors = Current Liabilities – Bank overdraft = 1,60,000 – 40,000 = ₹ 1,20,000
Construction of Balance sheet:
(ReferW.N. 1.3)

Question 15.
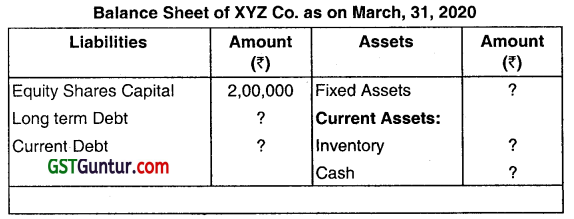
With the help of the following information complete the Balance Sheet of MNOP Ltd.
Equity share capital ₹ 1,00,000
The relevant ratios of the company are as follows:
Current debt to total debt 40
Total debt to owner’s equity 60
Property Plant and Equipment to owner’s equity 60
Total assets turnover 2 Times
Inventory turnover 8 Times
(May 2005, 7 marks)
Answer:
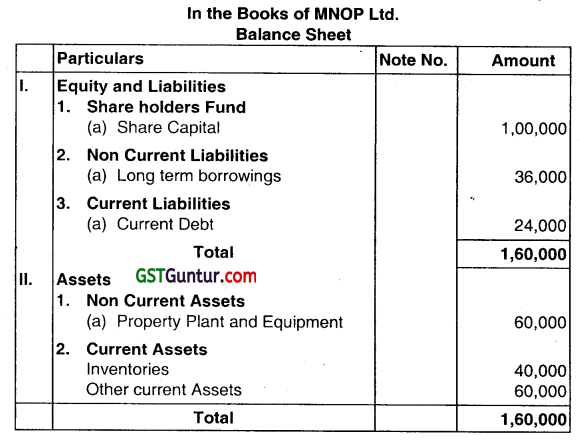
Working Notes:
1. Property Plant and Equipment = 0.60 × Owners equity = 0.60 × ₹ 1,00,000 = ₹ 60,000
2. Total equity = Total debt + Owners equity = ₹ 60,000 + ₹ 1,00,000 = ₹ 1,60,000
3. Total assets consisting of PPE and current assets must be equal to ₹ 1,60,000 (Assets = Liabilities + Owners equity). Since PPE are ₹ 60,000 hence, current assets should be ₹ 1,00,000.
4. Total debt = 0.60 × Owners equity = 0.60 × ₹ 1,00,000 = ₹ 60,000
5. Total assets tumover= 2 Times: Inventory turnover = 8 Times Therefore,
Inventory! Total assets = 2/8 = 1/4, Total assets = 1,60,000
Therefore, Inventory = 1,60,000/4 = 40,000 Cash = 1,00,000 – 40,000 = 60,000
Question 16.
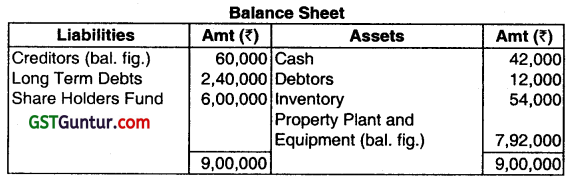
Using the following data, complete the Balance Sheet given below:
Gross Profits ₹ 54,000
Shareholders Funds ₹ 6,00,000
Gross Profit Margin 20%
Credit sales to Total sales 80%
Total Assets turnover 0.3 times
Inventory turnover 4 times
Average collection period (a 360 days year) 20 days
Current ratio 1.8
Long-term Debt of Equity 40%
(Nov 2005, 12 marks)
Answer:
Working Notes:
1. Gross Profit:
GP margin = 20%
GP = ₹ 54,000
∴ Sales = ₹ 2,70,000
2. Credit Sales:
Cr. Sales = 80% of Total Sales
= 2,70,000 × 80%
= ₹ 2,16,000
3. Total Assets:
Total Assets Turnover = \(\frac{\text { Sales }}{\text { Total Assets }}\) = 0.3 times
∴ Total Assets = \(\frac{2,70,000}{0.3}\)
= ₹ 9,00,000
4. Inventory Turnover:
Inventory Turnover = \(\frac{\text { Cash }}{\text { Inventory }} \times 100\)
∴ 4 = \(\frac{2,70,000-54,000}{\text { Inventory }} \)
∴ Inventory = ₹ 54,000
5. Debtors:
Debtors = \(\frac{\text { Credit Sales } \times 20 \text { days }}{360 \text { days }} \)
= \(2,16,000 \times \frac{20}{360} \text { days }\)
= ₹ 12,000
6. Creditors:
Total Assets = 9,00,000
∴ Total of Balance Sheet = 9,00,000
Now, Long Term Debt
∴ \(\frac{\text { Long Term Debt }}{\text { Equity }}\) = 40%
Long term Debt = 40% of equity
= 6,00,000 x 40%
= ₹ 2,40,000
Now Balancing figure of the Liability Side is creditors:
= 9,00,000 – 6,00,000 (Equity) – 2,40,000 (Long Term Debt)
= 60,000
∴ Creditors = ₹ 60,000
7. Current Ratio-Cash:
Current ratio = \(\frac{\text { Current Assets }}{\text { Current Liabilities }} \)
∴ 1.8 = \(\frac{\text { Debtors }+ \text { Inventory }+ \text { Cash }}{\text { Creditors }} \)
∴ 1.8 = \(\frac{12,000+54,000+\text { Cash }}{60,000} \)
∴ 1,08,000 = 66,000+Cash
∴ Cash = 42,000
8. Property Plant and Equipment:
The balancing figure on the Assets Side is Property Plant and Equipment.
9. Sales:
G.P. = COGS
∴ COGS = ₹ 2,70,000 – 54,000 = ₹ 2,16,000
Question 17.
JKL Limited has the following Balance Sheets as on March 31, 2006, and March 31, 2005:
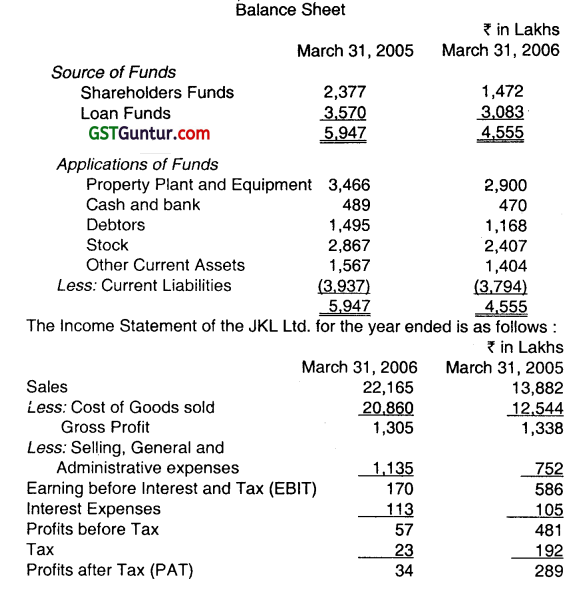
Required:
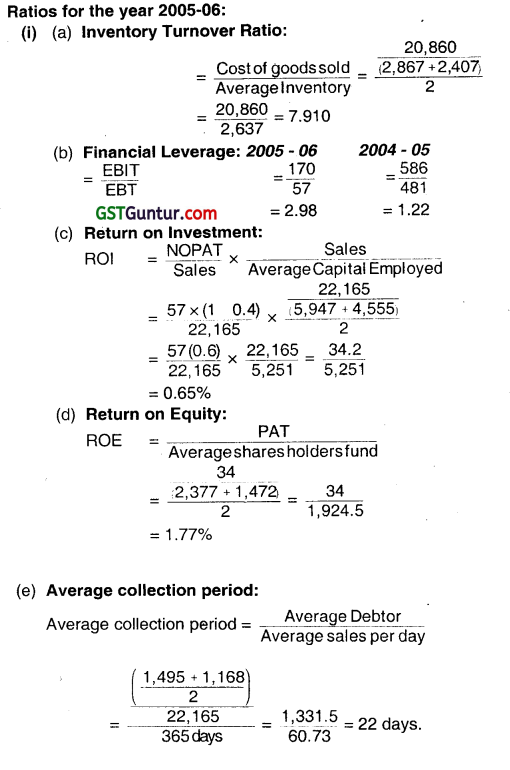
(i) Calculate for the year 2005-06:
(a) inventory turnover ratio
(b) Financial Leverage
(c) Return on Investment (ROI)
(d) Return on Equity (ROE)
(e) Average Collection period. (May 2006, 10 marks)
(ii) Give a brief comment on the Financial Position of JKL Limited. (May 2006,2 marks)
Answer:
(ii) Financial position of JKL Limited:
A careful analysis of above balance sheet shows that current ratio of company ¡s 1.5 which ¡s less than current ratio (i.e. 2) and short-term solvency ratio is therefore not satisfactory. At the same time lot of capital is blocked in inventory as compared to previous year. This affects liquidity of the firm, As regards utilisation of Debt Capital, the percentage of debts to total assets is not high, but as compared to equity, debt content is more in capital structure. Company is said to be leveraged with higher proportion of debt in its capital structure. This situation involves considerable risk to shareholders. In capital structuring, the company should ensure that cost of debt remains lower than return on investment.
Question 18.
The Balance Sheet of X Ltd. as on 31st March 2007 is as follows:
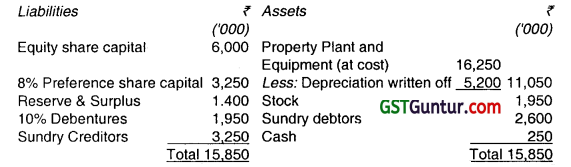
The following additional information is available:
(i) The stock turnover ratio based on cost of goods sold would be 6 times.
(ii) The cost of PPE to sales ratio would be 1.4.
(iii) PPE costing ₹ 30,00,000 to be installed on 1st April, 2007, payment would be made on March 31, 2008.
(iv) In March 2008, a dividend of 7 percent on equity capital would be paid.
(v) ₹ 5,50,000, 11% Debentures would be issued on 1st April, 2007.
(vi) ₹ 30,00,000, Equity shares would be issued on 31st March, 2008.
(vii) Creditors would be 25% of materials consumed.
(viii) Debtors would be 10% of sales.
(ix) The cost of goods soId would be 90 percent of sales include material 40 percent and depreciation 5 percent of sales.
(x) The profit is subject to debenture interest and taxation @ 30 percent.
Required:
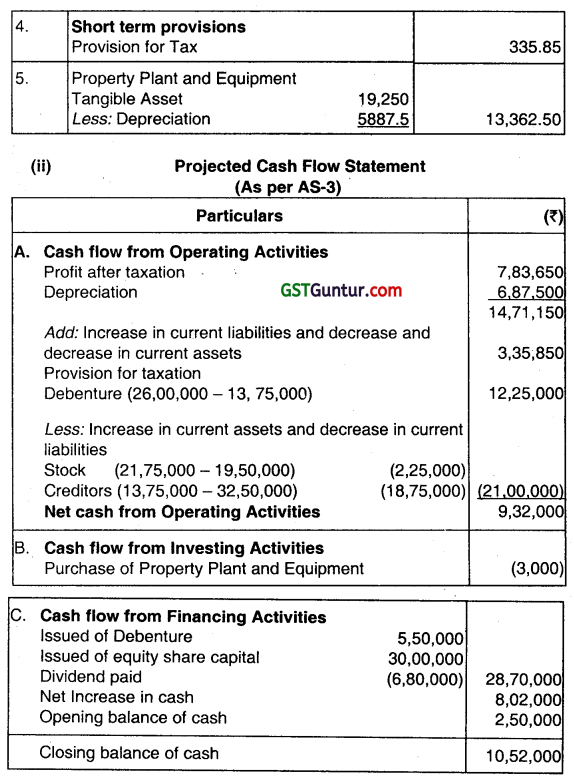
(i) Prepare the projected Balance Sheet as on 31st March, 2008.
(ii) Prepare projected Cash Flow Statement in accordance with AS -3. (Nov 2007, 10 + 5 = 15 marks)
Answer:

Question 19.
The following figures and ratios are related to a company:
(i) Sales for the year (all credit) ₹ 30,00,000
(ii) Gross Profit ratio 25 percent
(iii) PPE turnover (basis on cost of goods sold) 1.5
(iv) Stock turnover (basis on cost of goods sold) 6
(v) Liquid ratio 1: 1
(vi) Current ratio 1.5: 1
(vii) Debtors collection period 2 months
(viii) Reserve and surplus to Share capital 0.6: 1
(ix) Capital gearing ratio 0.5
(X) PPE to net worth 1.20:1
You are required to prepare:
(a) Balance Sheet of the company on the basis of above details. (May 2010, 11 marks)
(b) The statement showing Working capital requirement, if the company wants to make a provision for contingencies @ 10 percent of net working capital including such provision. (May 2010, 4 marks)
Answer:
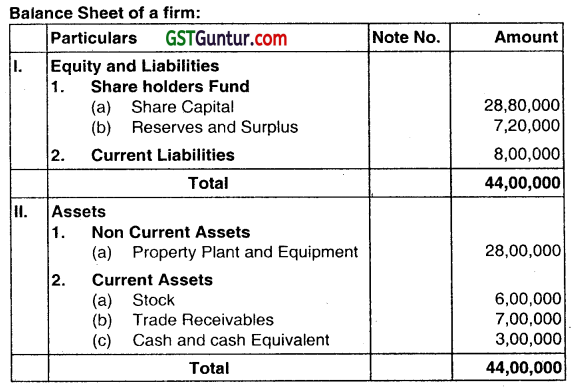
(a) Preparation of Balance Sheet of a Company
Working Notes:
(i) Cost of Goods Sold = Sales – Gross Profit (= 25% of Sales)
= ₹ 30,00,000 – ₹ 7,50,000
= ₹ 22,50,000
(ii) Closing Stock = Cost of Goods Sold/Stock Turnover
= ₹ 22,50,000/6
= ₹ 3,75,000
(iii) Property Plant and Equipment = Cost of Goods Sold/PPE Turnover
= ₹ 22,50,000/1.5
= ₹ 15,00,000
(iv) Current Assets:
Current Ratio = 1.5 and Liquid Ratio = 1
Stock = 15-1=0.5
Current Assets = Amount of Stock × 1.5/0.5
= 3,75,000 × 1.5/0.5= ₹ 11,25,000
(v) Liquid Assets (Debtors and Cash)
= Current Assets – Stock
= ₹ 11,25,000 – ₹ 3,75,000
= ₹ 7,50,000
(vi) Debtors = Sales x Debtors Collection period/12
= ₹ 30,00,000 × 2/12
= ₹ 5,00,000
(vii) Cash = Liquid Assets – Debtors
= ₹ 7,50,000 – ₹ 5,00,000
= ₹ 2,50,000
(viii) Net worth = PPE/1 .2
= ₹ 15,00,000/1.2 = ₹ 12,50,000
(ix) Reserves and Surplus
Reserves and
Share Capital = 0.6 + 1 = 1.6
Reserves and Surplus = ₹ 12,50,000 × 0.6/1.6
= ₹ 4,68,750
(x) Share Capital = Net worth – Reserves and Surplus
= ₹ 12,50,000 – ₹ 4,68,750
= ₹ 7,81,250
(xi) Current Liabilities = Current Assets/Current Ratio
= ₹ 11,25,000/1.5 = ₹ 7,50,000
(xii) Long-term Debts
Capital Gearing Ratio = Long-term Debts /Equity Shareholders’ Fund
Long-term Debts = ₹ 12,50,000 × 0.5
= ₹ 6,25,000

Question 20.
The financial statements of a company contain the following information for the year ending 31st March 2011 :

You are required to calculate:
(i) Quick Ratio
(ii) Debt-equity Ratio
(iii) Return on Capital Employed, and
(iv) Average collection period (Assuming 360 days in a year). (Nov 2011, 8 marks)
Answer:
Quick Assets
(i) Quick ratio = \(\frac{\text { Quick Assets }}{\text { Current Liabilities }} \)
Quick Assets = Current Assets – Stock- Prepaid Expenses
= 30,50,000 – 21,60,000 – 10,000
Quick Assets = 8,80,000
Quick Ratio = 8,80.000/10,00,000 = 0.88:1
(ii) Debt-Equity Ratio = \(\frac{\text { Longtermdebt }}{\text { ShareholdersFunds }} \)
= \(\frac{16,00,000}{(20,00,000+8,00,000)}\)
= 0.57:1
(iii) Return on Capital Employed (ROCE)
ROCE = \(\frac{\text { PBIT }}{\text { CapitalEmployed }} \times 100 \)
Capital Employed loo
= \(=\frac{12,00,000}{44,00,000} \times 100 \) = 27.27%
(iv) Average Collection Period
= \(\frac{\text { Sundry Debtors }}{\text { Credit Sales }} \times 360 \)
= \(\frac{4,00,000}{32,00,000} \times 360\)
= 45 Days
Question 21.
The following accounting information and financial ratios of M Limited relate to the year ended 31st March. 2012:
Inventory Turnover Ratio 6 Times
Creditors Turnover Ratio 10 Times
Debtors Turnover Ratio 8 Times
Current Ratio 2.4
Gross Profit Ratio 25%
Total sales ₹ 30,00,000: cash sales 25% of credit sales; cash purchases ₹ 2,30,000; working capital ₹ 2,80,000; closing inventory is ₹ 80,000 more than opening inventory.
You are required to calculate:
(i) Average Inventory
(ii) Purchases
(iii) Average Debtors
(iv) Average Creditors
(v) Average Payment Period
(vi) Average Collection Period
(vii) Current Assets
(viii) Current Liabilities (Nov 2012, 8 marks)
Answer:
(i) Computation of Average Inventory
Gross Profit = 25% of 30,00,000
Gross Profit 7,50,000
Cost of goods sold (COGS) = 30,00,000 – 7,50,000
COGS = 22,50,000
Inventory Turnover Ratio = \(\frac{\text { COGS }}{\text { Average Inventory }} \)
6 = \(\frac{22,50,000}{\text { Average Inventory }}\)
Average inventory = 3,75,000
(ii) Computation of Purchases
Purchases = COGS + increase in Stock
= 22,50,000 + 80,000
Purchases = 23,30,000
(iii) Computation of Average Debtors
Let Credit Sales be 100
∴ Cash sales = \(\frac{25}{100} \times 100 \)
∴ Total Sales = 100 + 25 = 125
If Then Total Sales = Credit Sales
125 = 100
30,00,000 = \frac{30,00,000}{125} \times 100 = 24,00,000
Credit Sales = 24,00,000
Cash Sales = 6,00,000
Now Debtors Turnover Ratio = \(\frac{\text { Net Credit Sales }}{\text { Average debtors }}\) = 8
or Debtor Turnover Ratio = \(\frac{24,00,000}{\text { Average debtors }}\) = 8
or Average Debtors = \(\frac{24,00,000}{8}\)
∴ Average Debtors = 3,00,000
(iv) Computation of Average Creditors
Credit Purchases = Purchases – Cash Purchases
= 23,3000 – 2,30000
= 21,00,000
Now Creditors Turnover Ratio = \(\frac{\text { Credit Purchases }}{\text { Average Creditors }} \)
∴ 10 = \(\frac{21,00,000}{\text { Average Creditors }} \)
or Average Creditor = 2,10,000
(v) Computation of Average Payment Period
Average Payment Period = 365/Creditors Turnover Ratio
= \(\frac{365}{10}\)
= 36.5 days
Average payment period = 365 days
(vi) Computation of Average Collection Period
Average collection period = 365/ Debtors Turnover Ratio
= \(\frac{365}{8} \) = 45.625 days
Average collections period = 45.625 days
(vii) Computation of Current Assets
Current Ratio = \(\frac{\text { Current Assets }(C A)}{\text { Current Liabilities }(C L)}\)
or 2.4 = \(\frac{\mathrm{CA}}{\mathrm{CL}} \)
or CL = \(\frac{\mathrm{CA}}{2.4} \)
Working capital = Current Assets – Current liabilities
2,80,000 = \(\quad(\mathrm{CA})-\left(\frac{\mathrm{CA}}{2.4}\right) \)
2,80,000 = \(\frac{1.4 \mathrm{CA}}{2.4}\)
or CA = 4,80,000
(viii) Computation of Current Liabilities
Current liabilities = \(\frac{4,80,000}{2.4}\) = 2,00,000
Question 22.
Answer the following:
The following information relates to Beta Ltd. for the year ended 31st March 2013:
Net Working Capital ₹ 12,00,000
PPE to Proprietor’s Fund Ratio 0.75
Working Capital Turnover Ratio 5 Times
Return on Equity (ROE) 15%
There is no debt capital.
You are required to calculate:
(i) Proprietor’s Fund
(ii) Property Plant and Equipment
(iii) Net Profit Ratio. (May 2013, 5 marks)
Answer:
(i) Calculation of Proprietor’s Fund
Since Ratio of PPE to Proprietor’s Fund = 0.75
Therefore, PPE = 0.75 Proprietor’s Fund
Net Working Capital = 0.25 Proprietor’s Fund
12,00,000 = 0.25 Proprietor’s Fund
Therefore, Proprietors Fund = \(\frac{12,00,000}{0.25} \) = 48,00,000
(ii) Calculation of Property Plant and Equipment
PPE = 0.75 Proprietor’s Fund
= 0.75 × 48,00.000
= 36,00,000
(iii) Calculation of Net Profit Ratio
Net Working Capital = 0.25 × 48,00,000
= 12,00,000
Work no Capital’ Turnover Ratio = \(\frac{\text { Sales }}{\text { WorkingCapital }} \)
Sale = 60,00,000
ROE = \(\frac{\text { PAT }}{\text { Equity }}\)
015 = \(\frac{\text { PAT }}{48,00,000} \)
PAT = 7,20,000
Net Profit Ratio = \(\frac{\text { NetProfit }}{\text { Sales }} \times 100 \)
= \(\frac{7,20,000}{60,00,000} \times 100\)
Net Profit Ratio = 12%
Alternative Treatment:
PPE may be computed alternatively by (Proprietor’s fund × PPE to Proprietor’s Fund Ratio) and Proprietor’s Fund by (PPE + Net Working Capital.)
Question 23.
The assets of SONA Ltd. consist of Property Plant and Equipment and current assets, while its current liabilities comprise bank credit in the ratio of 2:1. You are required to prepare the Balance Sheet of the company as on 31st March 2013 with the help of following information:
Share Capital – ₹ 5,75,000
Working capital (CA-CL) – ₹ 1,50,000
Gross Margin – 25%
Inventory Turnover – 5 times
Average Collection Period – 1.5 months
Current Ratio – 1.5:1
Quick Ratio – 0.8:1
Reserves & Surplus to Bank & Cash – 4 times (Nov 2013, 8 Marks)
Answer:

Working Note:
1. Current ratio =\(\frac{\text { CurrentAssets }}{\text { CurrentLiabilities }} \) = 1.5 times.
Current Liabilities
Therefore, Current Asset = 1.5 × Current Liabilities
2. Net working capital = Current Assets – Current Liabilities
= 1.5 × CL – CL = 1,50,000
= 0.5 CL = 1,50,000
CL = \(\frac{1,50,000}{0.5}\) = 300000 .
Bank Credit and creditors divided in 2: 1 ratio, 2,00,000 & 1,00,000.
3. Current Assets = 1.5 × Current Liabilities = 1.5 × 3,00,000 = 4,50,000.
4. Quick ratio = \(\frac{\text { QuickAssets }}{\text { CurrentLiabilities }} \) = 0.8 times
∴ \(\frac{\text { Current Assets-Stock }}{\text { CurrentLiabilities }}=0.8\)
So, \(\frac{4,50,000-\text { Stock }}{3,00,000}=0.8 \)
Stock = 2,10,000
5. Inventory Turnover = \(\frac{\text { COGS }}{\text { Stock }}=\frac{\text { COGS }}{2,10,000}\) = 5 times.
So, COGS = 2,10,000 × 5 = 10,50,000
6. Since the Gross Margin is 25%, COGS constitutes 75% of sales.
So, Sales = \(\frac{10,50,000}{75 \%}\) = 14,00,000.
7. Debtors Sales × \(\frac{1.5}{12}\) = 1,75,000.
8. Cash & 3ank = Total current assets – stock – debtors
= 4,50,000 – 2,10,000 – 1,75,000 = 65,000.
9. \(\frac{\text { Reserves& Surplus }}{\text { Cash&Bank }} \) = 4 times
So, R & S = 65,000 × 4 = 2,60,000.
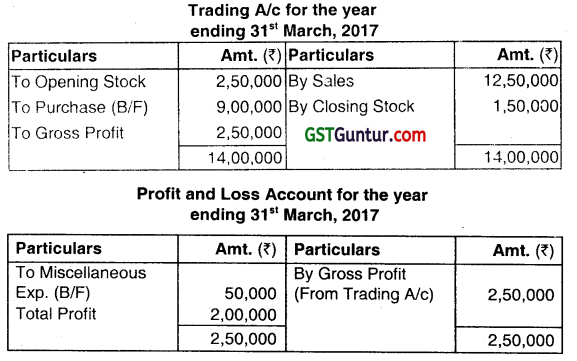
Question 24.
NOOR Limited provides the following information for the year ending 31st March 2014:
Equity Share Capital ₹ 25,00,000
Closing Stock ₹ 6,00,000
Stock Turnover Ratio 5 times
Gross Profit Ratio 25%
Net Profit / Sale 20%
Net Profit / Capital \(\frac{1}{4}\)
You are required to prepare:
Trading and Profit & Loss Account for the year ending 31st March 2014. (May 2014, 5 marks)
Answer:
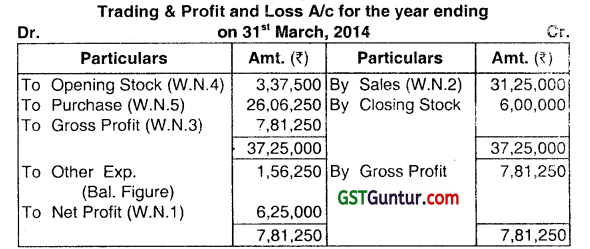
Working Note:
1. Calculation of Net Profit:
Net profit/capital = 1/4
∴ \(\frac{N P}{25,00,000}=\frac{1}{4}\)
∴ 4 NP = 25,00,000
∴ NP = 6,25,000
2. Calculation of Sales:
Net profit/sales = 20%
∴ Sales =\(\frac{NP}{20 \%}=\frac{6,25,000}{20 \%} \) = ₹ 31,25,000
3. Calculation of GP:
GP Sales x 25% = 31,25,000 x 25% = ₹ 7,81,250
4. Calculation of Opening Stock:
Stock Turnover Ratio = \(\frac{\text { COGS }}{\text { Avg.Stock }} \)
∴ Avg. Stock = \(\frac{23,43,750}{5}\)
∴ Avg. Stock = 4,68,750
∴ \(\frac{\text { Op. Stock }+\mathrm{Cl} \text {. Stock }}{2}\) = 4,68,750
∴ \(\frac{\text { Op. Stock }+6,00,000}{2}\) = 4,68,750
∴ Op. Stock = 9,37,500 – 6,00,000
∴ Op. Stock = 3,37,500
5. Calculation of Purchase:
Purchase = COGS + Closing Stock – Opening Stock
= 23,43,750 + 6,00,000 – 3,37,500
= ₹ 26,06,250
Question 25.
From the following information, prepare Balance Sheet of a firm:
Stock Turnover Ratio (based on cost of goods sold) – 7 times
Rate of Gross Profit to Sales – 25%
Sales to Property Plant and Equipment – 2 times
Average debt collection period – 1.5 months
Current Ratio – 2
Liquidity Ratio – 1.25
Net Working Capital – ₹ 8,00,000
Net Worth to Property Plant and Equipment – 0.9 times
Reserve and Surplus to Capital – 0.25 times
Long Term Debts – Nil
All Sales are on credit basis (Nov 2014, 8 marks)
Answer:
Note: 1 Net Working Capital
₹ 8,00,000 = Current assets – Current liabilities
₹ 8,00,000 = 2CL – CL
CL = 8,00,000
CA =2CL
= 2 (8,00,000)
CA =16,00,000
Note: 2 Liquid Ratio
125 = \(\frac{\mathrm{CA}-\text { Stock }}{\mathrm{CL}} \)
125 = \(\frac{16,00,000-\text { Stock }}{8,00,000} \)
∴ Stock = 16,00,000 – 10,00,000
∴ Stock=₹ 6,00,000
Note: 3 Stock Turnover ratio
7 times = \(\frac{\text { COGS }}{\text { Avg.Stock }}\)
Absence of information about opening Stock considering closing stock as Avg.
7 = \frac{\text { COGS }}{6,00,000}
COGS = 42,00,000
GP = COGS × 33.33%
= 42,00,000 × 33.3%
GP =14,00,000
Sales COGS + GP
= 42,00,000 + 14,00,000
Sales = ₹ 56,00,000
Note: 4 Sales to Property Plant and Equipment
2 = \(\frac{\text { Sales }}{F A} \)
∴ FA = \(\frac{56,00,000}{2} \)
∴ F.A. = 28,00,000
Note: 5 Net worth
Networth Total Assets – CL
= 28,00,000 + 16,00,000 – 8,00,000
= ₹ 36,00,000
Capital = \(\frac{36,00,000}{1.25} \) = ₹ 28,80,000
R&S = 28,80,000 × 0.25 = ₹ 7,20,000.
Question 26.
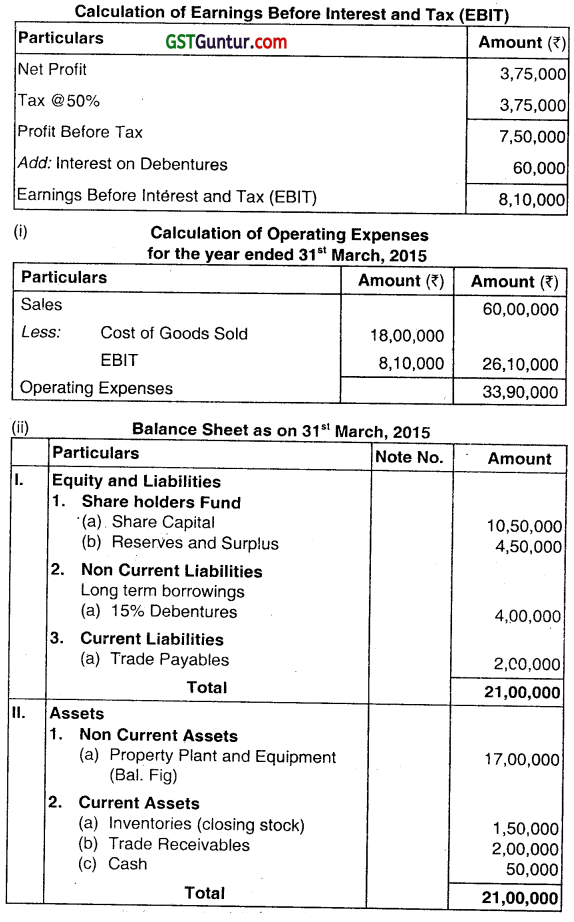
SSR Ltd. has furnished the following ratios and information relating to the year ended 31st March, 2015.
Sales ₹60 Lacs
Return on Net worth 25%
Rate of Income tax 50%
Share Capital to Reserves 7: 3
Current Ratio 2
Net-Profit to Sales (after tax) 6.25%
Inventory Turnover 12
(Based on cost of goods sold and closing stock)
Cost of goods sold ₹ 18 Lacs
interest on Debentures (@ 15%) ₹ 60,000
Sundry Debtors ₹ 2 Lacs
Sundry Creditors ₹ 2 Lacs
You are required to:
(i) Calculate the operating expenses for the year ended 31st March, 2015.
(ii) Prepare a Bance Sheet as on 31 March. 2015. (May 2015, 8 marks)
Answer:
Workings:
1. Net Profit = 6.25% of 60,00,000 = ₹ 3,75,000
2. Net worth = ₹ 3,75,000 × \(\frac{100}{25}\) = ₹ 15,00,000
Share Capital = ₹ 15,00,000 × \(\frac{7}{10}\) = ₹ 10,50,000
Reserve = ₹ 15,00,000 × \(\frac{3}{10}\) = ₹ 4,50,000
Debentures = ₹ 60,000 × \(\frac{100}{15}\) = ₹ 4,00,000
3. Sundry Creditors = ₹ 2,00,000
Current Ratio = \(=\frac{\text { Current Assets }}{\text { Current Liabilities }} \) = 2
Current Assets = 2 Current Liabilities
2 × ₹ 2,00,000 (assumed creditors is the only current liabilities) = ₹ 4,00,000
4. Inventory Turnover =\(\frac{\text { Cost of Goods Sold }}{\text { ClosingStock }} \) = 12
Hence, Closing Stock = \(\frac{₹ 18,00,000}{12} \) = 1,50,000
Question 27.
VRA Limited has provided the following information for the year ending 31st March 2015.
Debt Equity Ratio 2: 1
14% long-term debt ₹ 50,00,000
Gross Profit Ratio 30%
Return on equity 50%
Income Tax Rate 35%
Capital Turnover Ratio 1.2 times
Opening Stock ₹ 4,50,000
Closing Stock 8% of sales
You are required to prepare Trading and Profit and Loss Account for the year ending 31st March, 2015. (Nov 2015, 8 marks)
Answer:
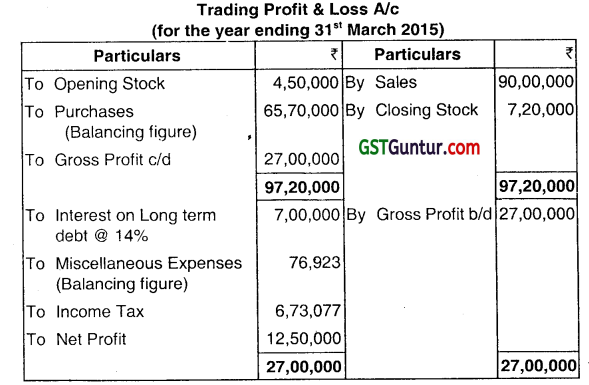
Working Note:
Debt Equity Ratio = 2:1, \(\frac{\text { Debt }}{\text { Equity }}=\frac{2}{1} \)
Equity = \(\frac{₹ 50,00,000}{2} \) = ₹ 25,00,000
Return on Equity = \(\frac{\text { Net Profit after tax (PAT) }}{\text { Equity }} \) = 50%
25,00,000 × 50% = 12,50,000
Net Profit before tax = ₹ 12,50,000 × \(\frac{100}{65} \) = ₹ 19,23,077
Tax = ₹ 19.23,077 – 12,50,000 = ₹ 6,73,077
Capital Turnover Ratio = \(\frac{\text { Sales }}{\text { Capital }} \) = 1.2
Or, \(\frac{\text { Sales }}{(₹ 25,00,000+₹ 50,00,000)}\) = 1.2
So, Sales = ₹ 75,00,000 x 1.2 = ₹ 90,00,000
Closing Stock = ₹ 90,00,000 x 8% = ₹ 7,20,000
Gross Profit = ₹ 90,00,000 x 30% = ₹ 27,00,000
Question 28.
With the following ratios and further information given below prepare a Trading Account, Profit and Loss Account and Balance Sheet of ABC Company.
Property Plant and Equipment ₹ 40,00,000
Closing stock ₹ 4,00,000
Stock turnover ratio 10
Gross profit ratio 25 percent
Net profit ratio 20 percent
Net profit to capital 1/5
Capital to total liabilities 1/2
Property Plant and Equipment to capital 5/4
PPE/Total current assets 5/7 (May 2016, 8 marks)
Answer:
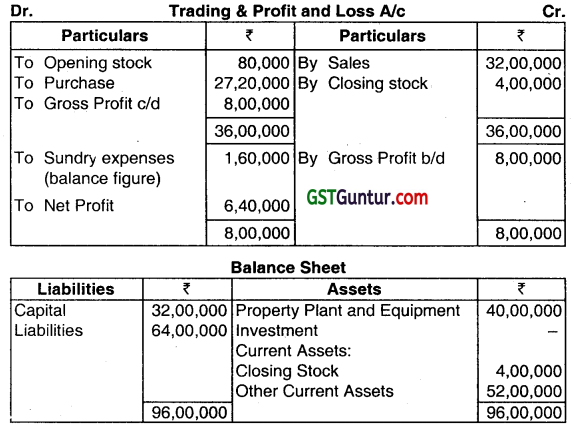
Working Notes:
(i) \(\frac{\text { Property Plant and Equipment }}{\text { Total Current Asset }}=\frac{5}{7}\)
\(\frac{40,00,000}{\text { Total Current Asset }} \quad=\frac{5}{7}\)
∴ Total Current asset = 56,00,000
(ii) \(\frac{\text { Property Plant and Equipment }}{\text { Capital }}=\frac{5}{4}\)
\(\frac{40,00,000}{\text { Capital }}=\frac{5}{4} \)
∴ Capital = 32,00,000
(iii) \(\frac{\text { Capital }}{\text { Total Liabilities }} \quad=\frac{1}{2} \)
\(\frac{32,00,000}{\text { Total Liabilites }}=\frac{1}{2}\)
∴ Total Liabilites = 64,00,000
(iv) \(\frac{\text { NetProfit }}{\text { Capital }} \quad=\frac{1}{5}\)
\(\frac{\text { Net Profit }}{32,00,000} \quad=\frac{1}{5} \)
∴ Net Profit = 6,40,000
(v) Net Profit Ratio = \(\frac{\text { Net Profit }}{\text { Sales }} \times 100 \)
20 = \(\frac{6,40,000}{\text { Sales }} \times 100\)
∴ Sales = 32,00,000
(vi) Gross Profit Ratio = \(\frac{\text { Gross Profit }}{\text { Sales }} \times 100 \)
25 = \(\frac{\text { GrossProfit }}{32,00,000} \times 100 \)
∴ Gross Profit = 8,00,000
(vii) Cost of Goods Sold = Sales – GP
= 32,00,000 – 8,00,000
= 24,00,000
(viii) Stock T/O Ratio = \(\frac{\text { COGS }}{\text { AverageStock }} \)
10 = \(\frac{24,00,000}{\text { Average Stock }} \)
∴ Average Stock = 2,40,000
(ix) Average Stock = \(\frac{\text { Opening Stock }+ \text { Closing Stock }}{2} \)
2,40,000 = \(\frac{\text { Opening Stock }+4,00,000}{2} \)
∴ Opening Stock = 80,000
(x) Cost of Goods Sold = Opening Stock + Purchase – Closing Stock
24,00,000 = 80,000 + purchase – 4,00,000
∴ Purchase = 27,20,000
Question 29.
The following figures and ratios pertain to ABG Company Limited for the year ending 31st March, 2016:
Annual Sales (credit) ₹ 50,00,000
Gross Profit Ratio 28%
PPE turnover ratio (based on cost of goods sold) 1.5
Stock turnover ratio (based on cost of goods sold) 6
Quick ratio 1: 1
Current ratio 1 .5
The debtor’s collection period is 45 days
Reserves and surplus to Share Capital 0.60: 1
Capital gearing ratio 0.5
Property Plant and Equipment to net worth 1.2: 1
You are required to prepare the Balance Sheet as at 31st’ March 2016 based on the above information. Assume 360 days in a year. (Nov 2016, 8 marks)
Answer:
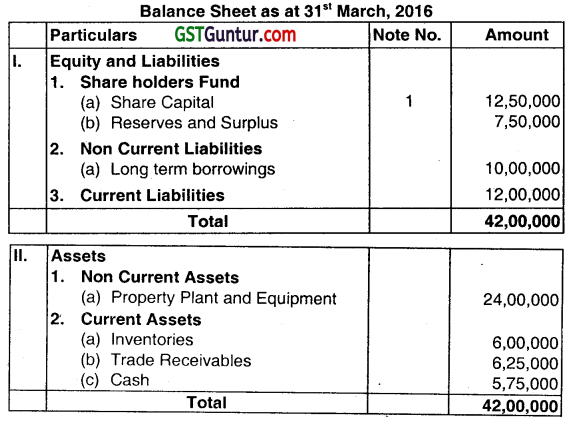
Working Notes:
Calculation of Debtors:
Average collection period = 45 days.
∴ Debtors T/O Ratio =\(\frac{360}{45} \) = 8
∴ Debtors = \(\frac{\text { Credit Sales }}{\text { Debtors } \mathrm{T} / \mathrm{O}} \)
= \(\frac{₹ 50,00,000}{8} \) = ₹ 6,25,000
2. Calculation of Property Plant and Equipment:
PPE = \(\frac{\text { COGS }}{\text { PPE }} \)
∴ 1.5 = \(\frac{36,00,000}{F A} \)
∴ FA = ₹ 24,00,000.
3. Calculation of Working Capital:
PPE to Networth = 1.2
∴ \(\frac{\mathrm{PPE}}{\mathrm{NW}} \quad=\frac{1.2}{1}\)
∴ Working Capital = ₹ 24,00,000 × 0.2
= ₹ 4,80,000.
4. Current Assets: Current Ratio
= 1.5 and Liquid Ratio 1
Stock =1.5-1=0.5
Current Assets = Amount of Stock × 1.5/0.5
= 6,00,000 × 1.5/0.5 = ₹ 18,00,000
5. Current Liabilities
= Current Assets / Current Ratio
= ₹ 18,00,000/1.5 = ₹ 12,00,000
6. Liquid Assets (Debtors and Cash and cash equivalents)
= Current Assets – Stock
= ₹ 18,00,000 – ₹ 6,00,000
= ₹ 12,00,000
7. Reserves and Surplus
Reserves & Surplus and Share Capital = 0.6 + 1 =1.6
Reserves and Surplus = ₹ 20,00,000 × 0.6/1.6 = ₹ 7,50,000
Share Capital = Net worth – Reserves and Surplus
= ₹ 20,00,000 – ₹ 7,50,000
= ₹ 12,50,000
8. Net Worth
= Property Plant and Equipment / 1.2
= ₹ 24,00,000/1.2
= ₹ 20,00,000
9. Cash & Cash equivalents
= Liquid Assets – Debtors
= ₹ 12,00,000- ₹ 6,25,000
= ₹ 5,75,000
10. Long-term Debts
Capital Gearing Ratio = Long-term Debts/ Equity Shareholders’ Fund (New worth)
Or, Long term Debts = ₹ 20,00,000 x 0.5 = ₹ 10,00,000.
Question 30.
Following information relates to a concern:
Debtors Velocity 3 months
Creditors Velocity 2 months
Stock Turnover Ratio 1.5
Gross Profit Ratio 25%
Bills Receivables ₹ 25,000
Bills Payables ₹ 10,000
Gross Profit ₹ 4,00,000
PPE to turnover Ratio 4
Closing stock of the period is ₹ 10,000 above the opening stock.
Find out:
(i) Sales and cost of goods sold
(ii) Sundry Debtors
(iii) Sundry Creditors
(iv) Closing Stock
(v) Property Plant and Equipment (May 2017, 8 marks)
Answer:
1. Sales and COGS:
GP. Ratio = \(\frac{\text { Gross Profit }}{\text { Sales }} \times 100 \)
25 = \(\frac{4,00,000}{\text { Sales }} \times 100 \)
Sales = \(\frac{4,00,000 \times 100}{25}\)
∴ Sales = 16,00,000
COGS = Sales – Gross Profit
= 16,00,000 – 4,00,000
∴ COGS = 12,00,000
2. Sundry Debtors:
Debtors Velocity = \(\frac{\text { Debtors }}{\text { Sales }} \times 100 \)
3 = \(\frac{\text { Debtors }}{16,00,000} \times 12\)
Debtors = \(\frac{16,00,000 \times 3}{12}\)
∴ Debtors = 4,00,000
Now S. Debtors + OR = 4,00,000
∴ S. Debtors 4,00,000 -25,000 = 3,75,000
3. Sundry Creditors COGS = Opening Stock + Purchase – Closing Stock
12,00,000 = 7,95,000 + Purchase – 8,05,000
∴ Purchase = 12,10,000
Creditors Velocity = \(\frac{\text { Creditors }}{\text { Purchase }} \times 12 \)
2 = \(\frac{\text { Creditors }}{12,10,000} \times 12 \)
Creditors = \(\frac{12,10,000 \times 2}{12} \)
∴ Creditors = 2,01,667
Now S. Creditors + BP = 2,01,667
∴ S. Creditors = 2,01,667 – 10,000 = 1,91,667
4. Closing Stock
Stock Turnover Ratio = \(\frac{\text { COGS }}{\text { AverageStock }} \)
1.5 = \(\frac{12,00,000}{\text { Average Stock }}\)
Average Stock = 8,00,000
Average Stock = \(\frac{\text { Opening Stock }+ \text { Closing Stock }}{2} \)
8,00,000 = \(\frac{\text { Opening Stock }+(\text { Opening Stock }+10,000)}{2} \)
16,00,000 = 2 Opening Stock + 10,000
Opening Stock = 7,95,000
Closing Stock Opening Stock + 10,000
= 7,95,000 + 10,000
∴ Closing Stock = 8,05,000
5. Property Plant and Equipment
PPE TR= \(\frac{\text { COGS }}{\text { Property Plant Equipment }} \)
4 = \(\frac{12,00,000}{\text { PropertyPlant and Equipment }} \)
Property Plant and Equipment = 3,00,000
Question 31.
XY Ltd. provides the following information for the year ending 31st March 2017:
Equity Share Capital ₹ 8,00,000
Closing Stock ₹ 1,50,000
Stock Turnover Ratio 5 times
Gross profit ratio 20%
Net profit/Sales 16%
Net profit/Capital 25%
You are required to prepare:
Trading and Profit & Loss Account for the year ending 31st March 2017. (Nov 2017, 8 marks)
Answer:
Working Notes:
(1) \(\frac{\text { Net Profit }}{\text { Capital }}=\frac{25}{100}\)
\(\frac{\text { NetProfit }}{8,00,000}=\frac{1}{4} \)
Net profit = \(\frac{8,00,000}{4} \) = 2,00,000
(2) \(\frac{\text { Net Profit }}{\text { Sales }}=16 \%\)
Sales = \(\frac{2,00,000}{16 \%}\) = 12,50,000
(3) Gross Profìt Rates = \(\frac{\text { G.P. }}{\text { Sales }} \times 100\) = 20%
Gross Profit = 12,50,000 x \(\frac{20}{100} \) = 2,50,000
(4) Stock Turnover = \(\frac{\text { COGS }}{\text { Average stock }} \)
5 = \(\frac{12,50,000-2,50,000}{\text { Averagestock }} \)
Average Stock = \(\frac{10,00,000}{5} \) = 2,00,000
Average Stock = \(\frac{\text { Opening }+ \text { Closing stock }}{2} \)
Opening Stock = 2,00,000 × 2 – 1,50,000 = 2,50,000
Question 32.
The accountant of Moon Ltd. has reported the following data:
Gross Profit ₹ 60,000
Gross Profit Margin 20 per cent
Total Assets Turnover 0.30:1
Net Worth to Total Assets 0.90:1
Current Ratio 1.5:1
Liquid Assets to Current Liability 1:1
Credit Sales to Total Sales 0.80:1
Average Collection Period 60 days
Assume 360 days in a year
You are required to complete the following:
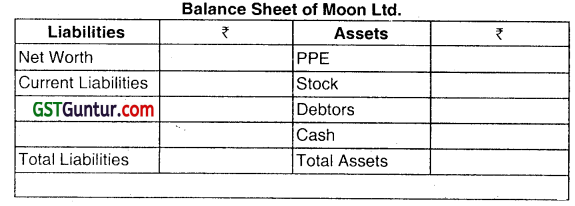
(May 2018, 5 marks)
Answer:
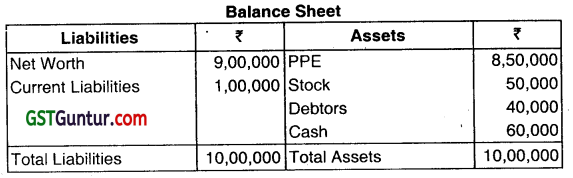
Working Notes:
Sales = Gross Profit/Gross Profit Margin
= 60000/0.2 = ₹ 3,00,000
Total Assets = Sales/Total Asset Turnover
= 3,00,000/0.3 = ₹ 10,00,000
Net Worth = 0.9× Total Assets
0.9 x 10,00,000 = ₹ 9,00,000
Current Liability = Total Assets – Net Worth
= ₹ 10,00,000 – ₹ 9,00,000
= ₹ 1,00,000
Current Assets = 1.5 × Current Liability
= 1.5 × 1,00,000 = ₹ 1,50,000
Stock = Current Assets – Liquid Assets
= Current Assets – (Liquid Assets/Current Liabilities = 1)
= 1,50,000 – (LA/1 ,00,000 = 1) = ₹ 50,000
Debtors = Average Collection Period × Credit Sales/360
= 60 × 0.8 × 3,00,000/360 = ₹ 40,000
Cash = Current Assets – Debtors – Stock
= ₹ 1,50,000 – ₹ 40,000 – ₹ 50,000
= ₹ 60,000
PPE = Total Assets – Current Assets
= ₹ 10,00,000 – ₹ 1,50,000
= 8,50,000
Question 33.
The following is the information of XML Ltd. related to the year ended 31- 03-2018:
Gross Profit 20% of Sales
Net Profit 10% of Sales
Inventory Holding period 3 months
Receivable collection period 3 months
Non-Current Assets to Sales 1: 4
Non-Current Assets to Current Assets 1: 2
Current Ratio 2: 1
Non-Current Liabilities to Current Liabilities 1: 1
Share Capital to Reserve and Surplus 4: 1
Non-current Assets as on 31st March, 2017 ₹ 50,00,000
Assume that:
(i) No change in Non-Current Assets during the year 2017 – 18.
(ii) No depreciation charged on Non-Current Assets during the year 2017-18.
(iii) Ignoring Tax.
You are required to Calculate cost of goods sold, Net profit, Inventory, Receivables, and Cash for the year ended on 31st March, 2018. (Nov 2018, 5 marks)
Answer:
Non Current Assets to Sale = 1 : 4
Non Current Assets = ₹ 50,00,000
Sales = ₹ 50,00,000 × 4
Sales = ₹ 2,00,00,000
Net Profit = 10% of Sales
= 10% of ₹ 2,00,00,000
= ₹ 20,00,000
Cost of goods sold = Sales – GP
= 2.00,00,000 – 20% of 2,00,00,000
= 1,60,00,000
Raw material consumption = 80% of Sales
= 80% of ₹ 2,00,00,000 = ₹ 1,60,00,000
Inventory = ₹ 1,60,00,000 × \(\frac{3}{12}\) = ₹ 40,00,000
Receivables = ₹ 2,00,00,000 × \(\frac{3}{12}\) = ₹ 50,00,000
Cash = Current Asset – Inventory – Receivables
= ₹ 1,00,00,000 – ₹ 40,00,000 – ₹ 50,00,000 = ₹ 10,00,000
Note: It is assumed that all sales are credit sales.
Question 34.
Following figures and ratios are related to a company Q Ltd.:
(I) Sales for the year (all credit) ₹ 30,00,000
(ii) Gross Profit ratio 25 per cent
(iii) PPE turnover (based on cost of goods sold) 1.5
(iv) Stock turnover (based on cost of goods sold) 6
(v) Liquid ratio
(vi) Current ratio 1.5: 1
(vii) Receivables (Debtors) collection period 2 months
(viii) Reserves and surplus to share capital 0.6: 1
(ix) Capital gearing ratio 0.5
(x) PPE to net worth 1.20: 1
You are required to calculate:
Closing Stock, PPE, Current Assets, Debtors, and Net worth. (May 2019, 5 marks)
Answer:
(i) Calculation of Closing Stock:
Sales for the year = ₹ 30,00,000
GP Ratio = 25%
Gross Profit = ₹ 7,50,000
Cost of Goods Sold = S – Gross Profit
= ₹ 30,000 – ₹ 7,50,000
Cost of goods Sold = ₹ 22,50,000
Closing stock = \(\frac{\text { COGS }}{\text { Stock Tumover }}\)
= \(\frac{22,50,000}{6}\)
= ₹ 3,75,000
(ii) Calculation of Fixed Asset:
Fixed Asset Turnover Ratio = \(\frac{\text { Cost of Goods Sold }}{\text { FixedAssets }} \)
∴ 1.5 = \(\frac{₹ 22,50,000}{\text { FixedAssets }}\)
Fixed Assets = \(\frac{₹ 22,50,000}{1.5} \) = ₹ 15,00,000
(iii) Calculation of Current Assets:
Current Ratio = 1.5 and Liquid Ratio = 1
Stock =1.5 – 1=0.5
Current Assets = Amount of Stock × 1.5/0.5
= ₹ 3,75,000 × 1.5/0.5
= ₹ 11,25,000
(iv) Calculation of Debtors:
Debtors = Sales x Debtors Collection period /12
= ₹ 30,00,000 × 2 /12
= ₹ 5,00,000
(v) Calculation of Net Worth:
Net worth = \( \frac{\text { Fixed Assets }}{\text { Net worth }}=\frac{1.20}{1}\)
= \(\frac{₹ 15,00,000}{\text { Net Worth }}=\frac{1.20}{1} \)
Net worth = ₹ 12,50,000
Question 35.
Following information has been gathered from the books of Tram Ltd. the equity share of which is trading in the stock market at ₹ 14.
Particulars Amount (₹)
Equity Share Capital (face value ₹ 10) 10,00,000
10% preference Shares 2,00,000
Reserves 8,00,000
10% Debentures 6,00,000
Profit before Interest and Tax for the year 4,00,000
Interest 60,000
Profit after Tax for the year 2,40,000
Calculate the following:
(i) Return on Capital Employed
(ii) Earnings per share
(iii) PE ratio (Nov 2019, 5 marks)
Answer:
(i) Return on Capital Employed:
ROCE (Pre Tax) = \(\frac{\text { Profits before Interest and Taxes }}{\text { Capital Employed }} \times 100 \)
= \(\frac{₹ 4,00,000}{₹ 10,00,000+₹ 2,00,000+₹ 8,00,000+₹ 6,00,000} \times 100 \)
= \(\frac{₹ 4,00,000}{₹ 26,00,000} \times 100 \)
= 15.38%.
ROCE (POST TAX) = \(\frac{\text { Profit after Tax }}{\text { Capital Employed }} \times 100 \)
= \(\frac{2,40,000}{26,00,000} \times 100\)
= 9.23%
(ii) Earnings per share:
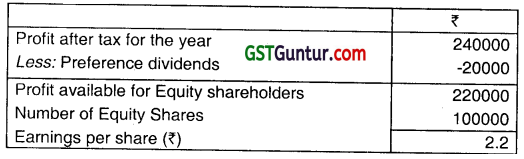
(iii) PE Ratio:
PE Ratio = \(\frac{\text { Market Price }}{\text { Earnings per Share }} \)
= \(\frac{₹ 14}{₹ 2.20}\)
= 6.36 times
Question 36.
The following information relates to RM Co. Ltd.
Total Assets employed ₹ 10,00,000
Direct Cost ₹ 5,50,000
Other Operating Cost ₹ 90,000
Goods are sold to the customers at 150% of direct costs.
50% of the assets being financed by borrowed capital at an interest cost
of 8% per annum.
Tax rate is 30%
You are required to calculate:
(i) Net profit margin
(ii) Return on assets
(iii) Asset turnover
(iv) Return on owners’ equity (Nov 2020, 5 marks)
Question 37.
From the following information, complete the Balance Sheet given below:
(i) Equity Share Capital: ₹ 2,00,000
(ii) Total debt to owner’s equity: 0.75
(iii) Total Assets turnover: 2 times
(iv) Inventory turnover: 8 times
(v) Fixed Assets to owner’s equity: 0.60
(vi) Current debt to total debt: 0.40
(Jan 2021, 5 marks)
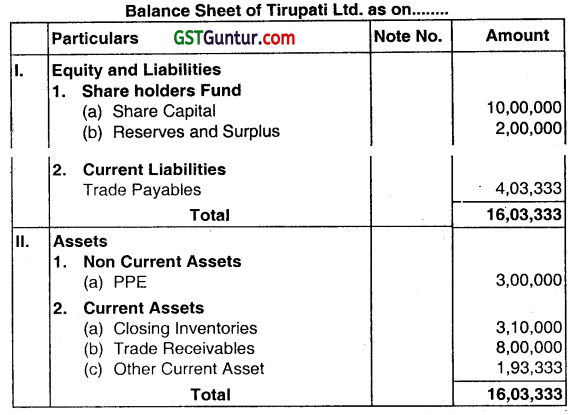
Question 38.
XV Ltd. provides the following information for the year ending 31st March, 2017:
PPE turnover ratio 8 times
Capital turnover ratio 2 times
Inventory Turnover 8 times
Receivable turnover 4 times
Payable turnover 6 times
G P Ratio 25%
Gross profit during the year amounts to ₹ 8,00,000. There is no long-term loan or overdraft Reserve and surplus amount ₹ 2,00,000. Ending inventory of the year is ₹ 20,000 above the beginning inventory.
Required:
CALCULATE various assets and liabilities and PREPARE a Balance sheet of Tirupati Ltd.
Answer:
Gross Profit
(a) G.P. ratio = \(\frac{\text { GrossProfit }}{\text {Sale}}\)
Sales = \(\frac{\text { GrossProfit }}{25} \times 100=\frac{₹ 8,00,000}{25} \times 100\) = ₹ 32,00,000
b) Cost of Sales = Sales – Gross profit
= ₹ 32,00,000 – ₹ 8,00,000
= ₹ 24,00,000
(c) Receivable turnover Sale = \(\frac{\text { Sale }}{\text { Receivables }} \) = 4
= Receivables = \(\frac{\text { Sale }}{4}=\frac{₹ 32,00,000}{4}\) = ₹ 8,00,000
(d) PPE turnover = \(\frac{\text { Cost of Sales }}{\text { Property Plant and Equipment }}\) =8
PPE = \(\frac{\text { Cost of Sales }}{8}=\frac{₹ 24,00,000}{8} \) = ₹ 3,00,000
(e) Inventory turnover = \(\frac{\text { Cost of Sales }}{\text { AverageStock }} \) = 8
Average Stock = \(\frac{\text { Cost of Sales }}{8}=\frac{₹ 24,00,000}{8} \) = ₹ 3,00,000
Average Stock = \(\frac{\text { OpeningStock }+ \text { ClosingStock }}{2} \)
Average Stock = \(\frac{\text { OpeningStock }+ \text { Opning Stock }+20,000}{2} \)
Average Stock = Opening Stock + ₹ 10,000
Opening Stock = Average Stock – ₹ 10,000
=₹ 30,00,000 – ₹ 10,000
=₹ 2,90,000
Closing Stock = Opening Stock + ₹ 20,000
=₹ 2,90,000 + ₹ 20,000
= ₹ 3,10,000
(f) Payable turnover = \(\frac{\text { Purchases }}{\text { Payables }} \) = 6
Purchases = Cost of Sales + Increase in Stock = ₹ 24,00,000 + ₹ 20,000 = ₹ 24,20,000
Purchase = ₹ 24,20,000
Payables = \(\frac{\text { Purchase }}{6}=\frac{₹ 24,20,000}{6} \) = ₹ 4,03,333
(g) Capital turnover = \(\frac{\text { Cost of Sales }}{\text { Capital Emloyed }} \) =2
Capital Employed = \(\frac{\text { Cost of Sales }}{2}=\frac{₹ 24,00,000}{2}= \) = ₹ 12,00,000
(h) Share Capital = Capital Employed – Reserves & Surplus
=₹ 12,00,000- ₹ 2,00000 =₹ 10,00,000
(PPE turnover, inventory turnover capital turnover is calculated on cost of sales)
Question 39.
Answer the following:
Explain the important ratios that would be used in each of the following situations.
(i) A bank is approached by a company for a loan of ₹ 50 lakh for working capital purposes.
(ii) A long-term creditor interested in determining whether his claim is adequately secured.
(iii) A shareholder who is examining his portfolio and who is to decide whether he should hold or sell his holding in the company.
(iv) A finance manager is interested to know the effectiveness with which a firm uses its available resources. (May 2012, 4 marks)
Answer:
important Ratios used in different situations
| 1. Liquidity Ratios | Liquidity short-term solvency ratios would be used by the bank or financial institutions to check the ability of the company to pay its short-term liabilities. A bank may use the Current ratio and Quick ratio to judge the short-term solvency of the firm. |
| 2. Capital Structure/Leverage Ratios | Long-term creditors would use the capital structure/leverage ratio to ensure the long-term stability and structure of the firm. A long-term creditor interested in determining whether his claim is adequately secured may use Debt-service coverage and interest coverage ratio. |
| 3. Profitability Ratios | Generally, shareholders would use the profitability ratios to measure the profitability or the operational efficiency of the firm to see the final results of business operations. A shareholder may use return on equity, earnings per share, and dividend per share. |
| 4. Activity Ratios | The top financial executive would use these ratios to evaluate the efficiency with which the firm manages and utilizes its assets. Some important ratios are (a) Capital turnover ratio (b) Current and PPE turnover ratio (c) Stock, Debtors, and Creditors turnover ratio. |
Question 40.
From the following table of financial ratios of R. Textiles Limited, comment on various ratios given at the end:
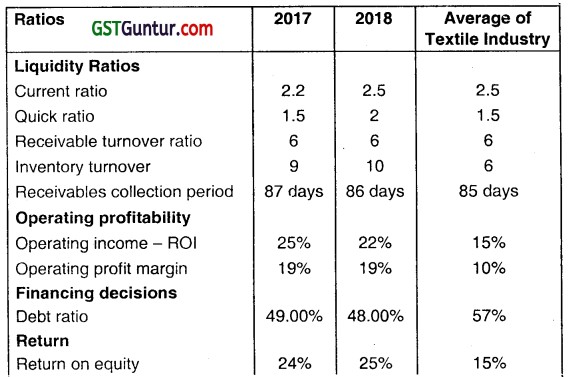
COMMENT on the following aspect of R. Textiles Limited
(i) Liquidity
(ii) Operating profits
(iii) Financing
(iv) Return to the shareholders.
Answer:
| Ratios | Comment |
| Liquidity | Current ratio has improved from last year and matching the industry average. Quick ratio also improved than last year and above the industry average. This may happen due to reduction in receivable collection period and quick inventory turnover. However, this also indicates idleness of funds. Overall it is reasonably good. All the liquidity ratios are either better or same in both the year compare to the Industry Average. |
| Operating Profits | Operating Income-ROI reduced from last year but Operating Profit Margin has been maintained. This may happen due to variability of cost on turnover. However, both the ratio are still higher than the industry average. |
| Financing | The company has reduced its debt capital by 1% and saved operating profit for equity shareholders. It also signifies that dependency on debt compared to other industry players (57%) is low. |
| Return to the shareholders | R’s ROE is 24 percent in 2017 and 25 percent in 2018 compared to an industry average of 15 percent. The ROE has stable and improved over the last year. |
Question 41.
Answer the following:
(i) Explain briefly the limitations of Financial ratios. (Nov 2009, 2 marks)
Answer:
The limitations of financial ratios are as below:
| 1. Concept of Ideal Ratio | The concept of ideal ratio is vague and there is no uniformity as to what an ideal ratio is. |
| 2. Thin line of difference between good and bad ratio | The line of difference between good and bad ratios is so thin that they are hardly separable. |
| 3. Financial ratios are not independent | The FR’s cannot be considered in isolation. They are inter related but not independent. Thus, decision taken on the basis of one ratio may not be correct. |
| 4. Misleading | Various firms may follow different accounting policies. In such cases ratio comparison among companies may be misleading. |
| 5. Impact of Seasonal Factors | Seasonal factor brings boom or recession. Ratios may indicate different results during different periods. |
| 6. Impact of Inflation | Under the impact of inflation, the ratios might not present a true picture. |
| 7. Product line diversification | Due to product line diversification, the overall position of the firm may differ from position of individual product line. |