The Company Audit – CA Inter Auditing Notes is designed strictly as per the latest syllabus and exam pattern.
The Company Audit – CA Inter Auditing Notes
Question 1.
Examine the following: “Section 139(1) of the Companies Act, 2013 provides that every company shall, at the first annual general meeting appoint an auditor who shall hold office till the conclusion of its sixth annual general meeting”. [RTP-May 18]
Answer:
Appointment of Subsequent Auditors in case of Non-Government Companies:
Section 139(1) of the Companies Act, 2013 provides that every company shall, at the first AGM appoint an individual or a firm as an auditor who shall hold office from the conclusion of that meeting till the conclusion of its 6th AGM and thereafter till the conclusion of every 6th meeting.
The following points need to be noted in this regard:
- The company shall place the matter relating to such appointment of ratification by member at every Annual General Meeting.
- Before such appointment is made, the written consent of the auditor to such appointment, and a certificate from him or it that the appointment, if made, shall be in accordance with the conditions as may be prescribed, shall be obtained from the auditor.
- The certificate shall also indicate whether the auditor satisfies the criteria provided in section 141.
- The company shall inform the auditor concerned of his or its appointment, and also file a notice of such appointment with the Registrar within 15 days of the meeting in which the auditor is appointed.
Question 2.
Managing Director of PQR Ltd. (Non-Government company) himself wants to appoint Shri Ganpa- ti, a practicing Chartered Accountant, as first auditor of the company. Comment on the proposed action of the Managing Director.
Answer:
Appointment of First Auditor of Non-Govt, Company:
Section 139(6} of the Companies Act, 2013 lays down that “the first auditor or auditors of a company shall be appointed by the Boardof directors within 30 days from the date of registration of the company”.
In the instant case, the appointment of Shri Ganpati, a practicing Chartered Accountant as first auditors by the Managing Director of PQR Ltd. by himself is in violation of Section 139(6} of the Companies Act, 2013, which authorizes the Board of Directors to appoint the first auditor of the company.
Conclusion: In view of the above, the Managing Director of PQR Ltd. should be advised not to appoint the first auditor of the company.
Question 3.
The first auditor of M/s Healthy Wealthy Ltd., a Government company, was appointed by the Board of Directors. [MTP-March 19, RTP-May 19]
Answer:
Appointment of First Auditor of Govt. Company
- Section 139(7) of the Companies Act, 2013 lays down that in the case of a Government company or any other company owned or controlled, directly or indirectly, by the Central Government, or by any State Government, or State Governments, or partly by the Central Government and partly by one or more State Governments, the first auditor shall be appointed by the CAG of India within 60 days of registration of the company.
- In case the CAG of India does not appoint such auditor within the said period, the BOD of the company shall appoint such auditor within the next 30 days.
- In the case of failure of the Board to appoint such auditor within the next 30 days, it shall inform the members of the company who shall appoint such auditor within the 60 days at an EGM.
- Hence in the case of M/s Healthy Wealthy Ltd., being a government company, the first auditors shall be appointed by the CAG of India.
Conclusion: The appointment of first auditors made by the Board of Directors of M/s Healthy
Wealthy Ltd., is null and void.

Question 4.
Nick Ltd. is a subsidiary of Ajanta Ltd., whose 20% shares have been held by Central Government, 25% by Uttar Pradesh Government and 10% by Madhya Pradesh Government. Nick Ltd. appointed Mr. P as statutory auditor for the year.
Answer:
Appointment of Auditor of Govt. Company:
- As per Sec. 2 (45) of the Companies Act, 2 013, a Government company is defined “as any company in which not less than 51% of the paid-up share capital is held by the Central Government or by any State Government or Governments or partly by the Central Government and partly by one or more State Governments and includes a company which is a subsidiary of a Government Company as thus defined”.
- Sec. 139(7) requires that the auditors of a government company shall be appointed or reappointed by the Comptroller and Auditor General of India.
- In the given case Ajanta Ltd. is a government company as its 20% shares have been held by Central Govt., 25% by U.P. State Government and 10% by M.P. State Govt. Total 55% shares have been held by Central and State Governments.
- Nick Ltd. will also be a government company, being subsidiary company of Ajanta Ltd. and hence the Auditor of Nick Ltd. can be appointed only by C & AG.
Conclusion: Appointment of ‘P’ is invalid and ‘P’ should not give acceptance to the Directors of Nick Ltd.
Question 5.
At the AGM of ICI Ltd., Mr. X was appointed as the statutory auditor. He, however, resigned after 3 months since he wanted to give up practice and join industry. State, how the new auditor will be appointed by ICI Ltd. and the conditions to be complied for.
Or
At the AGM of HDB Pvt. Ltd., Mr. R was appointed as the statutory auditor. He, however, resigned after 3 months since he wanted to purse his career in banking sector. The board of director has appointed Mr. L as the statutory auditor in board meeting within 30 days. Comment on the matter. With reference to the provisions of companies Act, 2013. [May 18 (5 Marks), RTP-Nov. 20]
Answer:
Filling of Casual vacancy:
- As per Sec. 139(8) of the Companies Act, 2013, any casual vacancy in the office of an auditor may be filled by Board of Directors within thirty days.
- However, if casual vacancy has been created by the resignation of the auditor, such appointment shall also be approved by the company at a general meeting convened within three months of the recommendation of the board.
- The auditor so appointed shall hold office till the conclusion of the next annual general meeting.
Conclusion:
In this case the casual vacancy has been created on account of resignation. Therefore, Board of Directors will have to fill the vacancy within thirty days and such appointment shall be approved by the company at the general meeting within three months of the recommendations of the board. The new auditor so appointed shall hold office only till the conclusion of the next AGM.
Question 6.
Due to the resignation of the existing auditor(s), the Board of directors of X Ltd. appointed Mr. Hari as the auditor. Is the appointment of Hari as auditor valid₹
Answer:
Board’s Powers to Appoint an Auditor:
- As per Sec. 139(8) of the Companies Act, 2013, any casual vacancy in the office of an auditor may be filled by Board of Directors within thirty days.
- However, if casual vacancy has been created by the resignation of the auditor, such appointment shall also be approved by the company at a general meeting convened within three months of the recommendation of the board.
- The auditor so appointed shall hold office till the conclusion of the next annual general meeting.
Conclusion: Appointment of auditor by Board of Directors will be Valid if it is made within 30 days of casual vacancy and such appointment is approved by the company at a general meeting within three months of the recommendations of the Board.
Question 7.
At an AGM of a listed company, Mr. R a retiring auditor after completing the tenure of 5 consecutive years of his service claims that he has been reappointed automatically, as the intended resolution of which a notice had been given to appoint Mr. P, could not be proceeded with, due to Mr. P’s death.
Answer:
Restrictions over tenure of Auditor (Rotation of Auditor)
- As per Sec. 139(2) of the Companies Act, 2013, listed companies and other prescribed class of companies shall not appoint or reappoint an individual as auditor for more than one term of five consecutive years.
- Sec. 139(10) of Companies Act, 2013 provides that if no auditor is appointed or reappointed at AGM, existing auditor will continue.
- In the given case, notice has been given of an intended resolution to appoint some person or persons in the place of a retiring auditor, and by reason of the death, incapacity or disqualification of that person or of all those persons, as the case may be, the resolution cannot be proceeded with.
- In the instant case, if Sec. 139(10) of the Companies Act, 2013 is invoked, it results into violation of Sec. 139(2). Hence, Mr. R cannot continue as auditor due to restrictions of Sec. 139(2).
Conclusion: Mr. R cannot continue as auditor of the company due to rotation provisions. Companies Act, 2013 does not provide any provision for such kind of situation, hence it can be concluded that vacancy arises in the office of auditor which need to be filled by company in EGM.
Question 8.
No AGM was held for the year ended 31st March, 2020, in XYZ Ltd., Mr. X is the auditor for the previous 5 years, whether he should continue to hold office for current year or not.
Answer:
Auditor’s position if no AGM is held:
Sec. 139(1) of the Companies Act, 2013 provides that every company shall, at the first AGM appoint an individual or a firm as an auditor who shall hold office from the conclusion of that meeting till the conclusion of its 6th AGM and thereafter till the conclusion of every 6th meeting.
In case the AGM is not held within the period prescribed, the auditor will continue in office till the AGM is actually held and concluded.
Conclusion: Mr. X shall continue to hold office till the conclusion of the AGM.
Question 9.
M/s Young & Co., a CA firm, and Statutory Auditors of Old Ltd., is dissolved on 1-4-2020 due to differ-ences of opinion among the partners. The Board of Directors of Old Ltd. in its meeting on 6-4-2020 appointed another firm M/s Sharp & Co. as their new auditors for one year.
Answer:
Filling of Casual Vacancy:
- As per Sec. 139(8) of the Companies Act, 2013, any casual vacancy in the office of an auditor may be filled by Board of Directors within thirty days.
- However, if casual vacancy has been created by the resignation of the auditor, such appointment shall also be approved by the company at a general meeting convened within three months of the recommendation of the board.
- The auditor so appointed shall hold office till the conclusion of the next annual general meeting.
Conclusion: In the instant case the action of the board of directors in appointing M/s Sharp & Co. to fill up the casual vacancy due to dissolution of M/s Young & Co., is correct.
However, the board of directors are not correct in giving them appointment for one year. M/s Sharp & Co. can hold office until the conclusion of next AGM only.
Question 10.
ABC Pvt. Ltd. is having paid up share capital of ₹ 18 Cr. but having public borrowing from nationalized banks and financial institutions of ₹ 72 Cr. Comment whether, manner of rotation of auditor will be applicable over ABC Pvt. Ltd. [RTP-May 18]
Answer:
Statement is Incorrect.
- Provisions related with rotation of auditors are applicable in case of private companies having paid up capital of ₹ 50 Crore or more and to companies having paid up capital below ₹ 50 Crore, but having public borrowings from financial institutions, banks or public deposits of ₹ 50 Crore or More.
- In the instant case, as borrowings is of ₹ 50 Crore, provisions related with rotation of auditors are applicable.
Question 11.
Jolly Ltd., a listed company, appointed M/s Polly & Co., a Chartered Accountant firm, as the statutory auditor in its AGM held at the end of September, 2020 for 11 years. Comment whether the appointment is valid.
Answer:
Rotation of Auditor & Cooling Off Period Provisions:
- As per Section 139(2) of the Companies Act, 2013, no listed company or a company belonging to such class or classes of companies as prescribed, shall appoint or re-appoint
- an individual as auditor for more than one term of five consecutive years; and
- an audit firm as auditor for more than two terms of five consecutive years.
- In the given case, Jolly Limited is a listed company, the provisions relating to rotation of auditor will be applicable.
Conclusion: Jolly Ltd. cannot appoint the auditor for more than two terms of five consecutive years each, i.e. M/s Polly & Co. shall hold office from the conclusion of this meeting upto conclusion of 6th AGM to be held in the year 2025 and thereafter can be re-appointed as auditor for one more term of five years i.e. upto year 2030. The appointment shall be subject to ratification by members at every AGM of the company. As a result, the appointment made by Jolly Ltd. for 11 years is void.
Question 12.
M/s XYZ & Co., is an audit firm having partner Mrs. X, Mr. Y and Mr. Z, whose tenure has expired in the company immediately preceding the financial year. M/s ABZ & Co., another audit firm in which Mr. Z is a common partner, appointed as auditor for next five years. Comment whether the appointment is valid.
Answer:
To Examine validity of appointment;
- Sec. 139[2] of Companies Act, 2013 provides that no listed company or other prescribed companies, shall appoint or re-appoint an audit firm as auditor for more than two terms of five consecutive years.
- An audit firm which has completed its term, shall not be eligible for re-appointment as auditor in the same company for five years from the completion of such term.
- It is also provided that as on the date of appointment no audit firm having a common partner or partners to the other audit firm, whose tenure has expired in a company immediately preceding the financial year, shall be appointed as auditor of the same company for a period of five years.
- In the present case, assuming that company is covered under rotational provisions and two tenures of 5 year each of XYZ & Co. expired, M/S ABZ cannot be appointed as auditor as Mr. Z is common partner.
Conclusion: Appointment is not valid.
Question 13.
Discuss the following: Filling of Casual Vacancy in respect of a Company Audit. [Nov 12 (5 Marks) RTP-Mav 18]
Answer:
Filling of Casual Vacancy:
As per Section 139 (8) of the Companies Act, 2013, any casual vacancy in the office of an auditor shall-
(i) In the case of a non-government company, be filled by the Board of Directors within 30 days. But, if such casual vacancy is as a result of the resignation of an auditor, such appointment shall also be approved by the company at a general meeting convened within 3 months of the recommendation of the Board and the auditor so appointed shall hold the office till the conclusion of the next AGM.
(ii) In the case of a government company, the casual vacancy be filled by the CAG of India within 30 days. But if the CAG does not fill the vacancy within the said period the Board of Directors shall fill the vacancy within next 30 days.
Question 14.
Under what circumstances the retiring auditor cannot be reappointed. [Nov. 13 (6 Marks)]
Answer:
Circumstances in which retiring auditor cannot be reappointed:
- A specific resolution has not been passed to reappoint the retiring auditor.
- The auditor proposed to be reappointed does not possess the qualification prescribed under section 141 of the Companies Act, 2013.
- The proposed auditor suffers from the disqualifications under sections 141(3), 141(4) and 144 of the Companies Act, 2013.
- He has given to the company notice in writing of his unwillingness to be reappointed.
- A Special resolution has been passed in AGM appointing somebody else or providing expressly that the retiring auditor shall not be reappointed.
- A written certificate has not been obtained from the proposed auditor to the effect that the appointment or reappointment, if made, will be in accordance within the limits specified under section 141(3)(g) of the Companies Act, 2013.
Question 15.
State the manner of rotation of auditors on expiry of their term. [May 15 (4 Marks)]
Or
What are the provisions regarding appointment of auditors by rotation, after expiry of the term of the current auditor that a company should consider? [May 17 (5 Marks)]
Answer:
Manner of Rotation of Auditors:
Rule 6 of Companies (Audit & Auditors) Rules, 2014 prescribes the manner of rotation as below:
1. The Audit Committee shall recommend to the Board, the name of an individual auditor or of an audit firm who may replace the incumbent auditor on expiry of the term of such incumbent.
2. Where a company is required to constitute an Audit Committee, the Board shall consider the recommendation of such committee, and in other cases, the Board shall itself consider the matter of rotation of auditors and make its recommendation for appointment of the next auditor by the members in annual general meeting.
3. For the purpose of the rotation of auditors-
(i) in case of an auditor (whether an individual or audit firm), the period for which the individual or the firm has held office as auditor prior to the commencement of the Act shall be taken into account for calculating the period of five consecutive years or ten consecutive years, as the case may be;
(ii) the incoming auditor or audit firm shall not be eligible if such auditor or audit firm is associated with the outgoing auditor or audit firm under the same network of audit firms. The term “same network” includes the firms operating or functioning, hitherto or in future, under the same brand name, trade name or common control.
(iii) For the purpose of rotation of auditors:
(A) a break in the term for a continuous period of five years shall be considered as fulfilling the requirement of rotation;
(B) if a partner, who is in charge of an audit firm and also certifies the financial statements of the company, retires from the said firm and joins another firm of chartered accountants, such other firm shall also be ineligible to be appointed for a period of five years.
Question 16.
Provisions regarding rotation of auditors affect only specified class of companies. Discuss.
Or
Specify the class of companies to whom rotation of auditor applies, under the provisions of Companies Act, 2013. [May 17 (4 Marks)]
Answer:
Companies requiring rotation of auditors:
As per Section 139(2) of the Companies Act, 2013, no listed company or a company belonging to such class or classes of companies as prescribed, shall appoint or re-appoint-
- an individual as auditor for more than one term of five consecutive years; and
- an audit firm as auditor for more than two terms of five consecutive years.
Rule 5 of Companies (Audit and Auditors] Rules, 2014, prescribes the following classes of companies for the purpose of rotation:
a. all unlisted public companies having paid up share capital of ₹ 10 crore or more;
b. all private limited companies having paid up share capital of ₹ 20 crore or more;
c. all companies having paid up share capital of below threshold limit mentioned above, but having public borrowings from financial institutions, banks or public deposits of ₹ 50 crores or more.
Question 17.
Write short note on: Provisions regarding re-appointment of a retiring auditor at the Annual General Meeting, for a company not covered under auditor rotation provisions. [May 17 (4 Marks)]
Answer:
Re-appointment of Auditor – Sec. 139(9):
Subject to the provisions of sub-section (1) and the rules made thereunder, a retiring auditor may be re-appointed at an AGM, if:
(a) he is not disqualified for re-appointment;
(b) he has not given the company a notice in writing of his unwillingness to be re-appointed; and
(c) a special resolution has not been passed at that meeting appointing some other auditor or providing expressly that he shall not be re-appointed.
Sec. 139(10) of Companies Act, 2013 provides that where at any AGM no auditor is appointed or reappointed, the existing auditor shall continue to be the auditor of the company.
Question 18.
Explain the manner and procedure of selection and appointment of auditors as per Rule 3 of Companies (Audit and Auditors) Rules, 2014. [RTP-May 19]
Answer:
Manner and Procedure of selection and appointment of auditors:
Manner and procedure of selection of auditors by the members of the company at AGM has been prescribed under Rule 3 of the Companies (Audit and Auditors) Rules, 2014. Accordingly:
1. In case of a company that is required to constitute an Audit Committee u/s 177, the committee, and, in cases where such a committee is not required to be constituted, the Board, shall take into consideration the qualifications and experience of the individual or the firm proposed to be considered for appointment as auditor and whether such qualifications and experience are commensurate with the size and requirements of the company:
While considering the appointment, the Audit Committee or the Board, as the case may be, shall have regard to any order or pending proceeding relating to professional matters of conduct against the proposed auditor before the ICA1 or any competent authority or any Court.
2. The Audit Committee or the Board, as the case may be, may call for such other information from the proposed auditor as it may deem fit.
3. Subject to the provisions of sub-rule (1), where a company is required to constitute the Audit Committee, the committee shall recommend the name of an individual or a firm as auditor to the Board for consideration and in other cases, the Board shall consider and recommend an individual or a firm as auditor to the members in the AGM for appointment.
4. If the Board agrees with the recommendation of the Audit Committee, it shall further recommend the appointment of an individual or a firm as auditor to the members in the AGM.
5. If the Board disagrees with the recommendation of the Audit Committee, it shall refer back the recommendation to the committee for reconsideration citing reasons for such disagreement.
6. If the AuditCommittee, after considering the reasons given by the Board, decides not to reconsider its original recommendation, the Board shall record reasons for its disagreement with the committee and send its own recommendation for consideration of the members in the AGM; and if the Board agrees with the recommendations of the Audit Committee, it shall place the matter for consideration by members in the AGM.
Question 19.
Where a company is required to constitute an Audit Committee, all appointments of an auditor under this section shall be made after taking into account the recommendations of such committee. Explain stating also the class of companies required to constitute Audit Committee. [MTP-March 19, May 20]
Answer:
Consideration as to recommendation of Audit Committee:
Sec. 139(11) of Companies Act, 2013 provides that where a company is required to constitute an Audit Committee u/s 177, all appointments, including the filling of a casual vacancy of an auditor under this section shall be made after taking into account the recommendations of such committee.
Companies required to constitute Audit Committee: As per Sec. 177 of Companies Act, 2013, in addition to listed public companies, following classes of companies shall constitute an Audit Committee:
- all public companies with a paid-up share capital of ₹ 10 Cr. or more;
- all public companies having turnover of ₹ 100 Cr. or more;
- all public companies, having in aggregate, outstanding loans, debentures and deposits exceeding ₹ 50 Cr.
Explanation: The paid-up share capital or turnover or outstanding loans, debentures and deposits, as the case may be, as existing on the last date of latest audited F.S. shall be taken into account for this purpose.
Question 20.
Clue Ltd. is a Public unlisted company having paid-up share capital of₹ 9 crores and public borrowings from the financial institutions of ₹ 51 crores. They appointed M/s Pray and Co., a Chartered Accountant firm as the statutory auditor in its annual general meeting for 11 years.
(a) Is the manner of rotation of auditor applicable in case of Clue Ltd.₹
(b) Whether the appointment of M/s Pray and Co. is valid₹ [Nov. 20 (4 Marks)]
Answer:
Appointment and Rotation of company auditor:
(i) Rotation of Auditor:
- As per Rule 5 of Companies (Audit and Auditor’s) Rules, 2014, provisions related with rotation of auditors are applicable in case of public unlisted companies having paid up capital of ₹ 10 Crore or more and to companies having paid up capital below ₹ 10 Crore, but having public borrowings from financial institutions, banks or public deposits of ₹ 50 Crore or more.
- In the instant case, as borrowings is of ₹ 50 Crore, provisions related with rotation of auditors are applicable.
(ii) Appointment of Auditor:
As per Section 139(2) of the Companies Act, 2013, no listed company or a company belonging to such class or classes of companies as prescribed, shall appoint or re-appoint-
- an individual as auditor for more than one term of five consecutive years; and
- an audit firm as auditor for more than two terms of five consecutive years.
Clue Ltd. cannot appoint the auditor for more than two terms of five consecutive years each, i.e. M/s Pray & Co. shall hold office from the conclusion of this meeting upto conclusion of 6th AGM and thereafter can be re-appointed as auditor for one more term of five years. The appointment shall be subject to ratification by members at every AGM of the company. As a result, the appointment made by Clue Ltd. for 11 years is not valid.
Question 21.
Why Central Government permission is required, when the auditor is to be removed before expiry of their term, but the same is not needed when the auditors are changed after expiry of their term.
Answer:
Removal of an auditor before expiry of term:
- Sec. 140(1) of Companies Act, 2013 requires prior approval of Central Government in case of removal of an auditor before the expiry of his term. This is a very stringent provision to ensure that any auditor who is inconvenient to the management cannot be removed so easily. Such a provision goes a long way to ensure independence of auditor.
- Therefore, law has provided this safeguard so that Central Govt, can know the real reason of auditor’s removal before expiry of his term and if not satisfied with the reason, may not accord approval.
- On the other hand, if the auditor has completed his term, i.e. has submitted his report and thereafter he is not re-appointed, then the matter is not serious enough for Central Govt, to call for its intervention.
- In view of the above, Central Govt, permission is required when auditors are removed before expiry of their term and the same is not required when they are not re-appointed after the expiry of their term.
Question 22.
PQR Company Ltd. removed their first auditor by passing a resolution in the meeting of the Board of Directors for his removal without obtaining prior approval from the Central Government. Offer your comments in this regard. [Nov. 10(4 Marks)]
Answer:
Removal of first Auditor:
- As per Sec. 140(1) of the Companies Act, 2013, an auditor appointed u/s 139 may be removed from his office before the expiry of his term only by a special resolution of the company, after obtaining the prior approval of the Central Government.
- For this purpose, an application to the Central Government for removal of auditor shall be made in Form ADT-2 and shall be accompanied with prescribed fees.
- The application shall be made to the Central Government within thirty days of the resolution passed by the Board.
- The company shall hold the general meeting within sixty days of receipt of approval of the Central Government for passing the special resolution.
- In the instant case the first auditor appointed by the Board of Directors was removed by a resolution in the meeting of the Board of Directors inspite of the Special resolution of the Company and without the prior approval of the Central Government in that behalf.
Conclusion: Removal of Auditor is Invalid as Special Resolution has not been passed and approval of Central Govt, not obtained.
Question 23.
Comment on the following: Removal of auditor before expiry of term. [Nov. 11 (6 Marks)]
Or
Discuss about the provisions for removal of auditor before expiry of term. [Nov. 15 (6 Marks)]
Or
The auditor CA Z appointed under section 139 was removed from his office before the expiry of his term by an ordinary resolution of the company. Comment explaining clearly the procedure of removal of auditor before expiry of term. [MTP-Oct. 18]
Or
Board of Directors of “XYZ Ltd.” found the auditors of the Company acted in a fraudulent manner, and decided to remove the auditors in board’s meeting. Comment on the action of Board of Directors and describe correct procedure to be followed for removal of auditors before expiry of their term. [May 19 (4 Marks}]
Answer:
Removal of Auditor before expiry of term:
Sec. 140(1} of Companies Act, 2013 governs the provisions relating to removal of auditor before expiry of term. The salient features of Sec. 140(1} in reading with Rule 7 of Companies (Audit and Auditors} Rules, 2014 are:
- The auditor appointed under section 139 may be removed from his office before the expiry of his term only by a special resolution of the company and after obtaining the previous approval of the Central Government by making an application in Form ADT-2 and shall be accompanied with the prescribed fees.
- The application shall be made to the Central Government within 30 days of the resolution passed by the Board.
- The Company shall hold the general meeting within 60 days of receipt of approval of the Central Government for passing the special resolution.
- Before taking any action for removal of auditor before the expiry of his term, the auditor concerned shall be given a reasonable opportunity of being heard.
Conclusion:
Removal of auditor before expiry of tenure by ordinary resolution or Board resolution is not valid.
Question 24.
As one of the Joint auditors of X Ltd. a non listed company not covered u/s 139(2) for the immediately preceding five financial years, you have been considered for re-appointment by the members in the AGM as the sole auditor, while the said Joint auditors are not re-appointed. Comment. [Nov. 16 (6 Marks)]
Answer:
Appointment of Sole Auditor:
When one of the joint auditors of the previous years is considered for re-appointment by the members as the sole auditor for the next tenure, it is similar to non-re-appointment of one of the retiring joint auditors. As per Sec. 140(4} of the Companies Act, 2013, special notice shall be required for a resolution at an AGM appointing as auditor a person other than a retiring auditor, or providing expressly that a retiring auditor shall not be re-appointed, except where the retiring auditor has completed a consecutive tenure of five years or, as the case maybe, ten years, as provided u/s 139(2}.
Accordingly, provisions of the Companies Act, 2013 to be complied with are as under:
(a) Special Notice: Ascertain that special notice u/s 140 (4} of the Companies Act, 2013 was received by the company from requisite number of members (1% of total voting power or paid up capital not less than ₹ 5 Lacs} at least 14 days before the AGM date.
(b) Sending copy of notice: Check whether the said notice has been sent to all the members at least 7 days before the date of the AGM.
(c) Contents of Notice: Verify that the notice contains an express intention of a member for proposing the resolution for appointing a sole auditor in place of both the joint auditors who retire at the meeting but are eligible for re-appointment.
(d) Notice to Auditor: Ensure that the notice has also been sent to the retiring auditor.
(e) Sending the Representation: Verify whether any representation, received from the retiring auditor was sent to the members of the company.
(f) Consideration of representation: Verify from the minutes book whether the representation received from the retiring joint auditor was considered at the AGM.
Question 25.
CA. Donald was appointed as the auditor of PS Ltd. at the remuneration of ₹ 30,000. However, after 4 months of continuing his services, he could not continue to hold his office of the auditor as his wife got a government job at a distant place and he needs to shift along with her to the new place. Thus, he resigned from the company and did not perform his responsibilities relating to filing of statement to the company and the registrar indicating the reasons and other facts as may be relevant with regard to his resignation.
How much fine may he be punishable with under section 140(3) for non-compliance of section 140(2) of the Companies Act, 2013₹ [RTP-May 19, MTP-Oct. 19]
Answer:
Fine prescribed u/s 140(3) for non-compliance of Sec. 140(2):
- Sec. 140(2) of Companies Act, 2013 provides that the auditor who has resigned from the company shall file within a period of 30 days from the date of resignation, a statement in the Form ADT-3 with the company and the Registrar.
- In case of Govt, companies or Govt, owned/controlled companies, the auditor shall also file such statement with the CAG, indicating the reasons and other facts as may be relevant with regard to his resignation.
- As per Sec. 140(3) of Companies Act, 2013, if the auditor does not comply with the provisions of Sec. 140(2), he or it shall be liable to a penalty of ₹ 50,000 or an amount equal to the remuneration of the auditor, whichever is less, and in case of continuing failure, with further penalty of ₹ 500 for each day after the first during which such failure continues, subject to a maximum of ₹ 5 lakh.
Question 26.
“Mr. A”, a practicing Chartered Accountant, is holding securities of “XYZ Ltd.” having face value of ₹ 900. Whether Mr. A is qualified for appointment as an Auditor of “XYZ Ltd.”₹ Would your answer will be changed if the securities are being hold by relative of Mr. A.
Answer:
Disqualification as to Security:
As per section 141(3) (d) (i) an auditor is disqualified to be appointed as an auditor if he, or his relative or partner holding any security of or interest in the company or its subsidiary, or of its holding or associate company or a subsidiary of such holding company.
Conclusion: In the present case, Mr. A is holding security of ₹ 900 in the XYZ Ltd., therefore he is not eligible for appointment as an Auditor of “XYZ Ltd”.
Question 27.
“Mr. P” is a practicing Chartered Accountant and “Mr. Q”, the relative of “Mr. P”, is holding securities of “ABC Ltd.” having face value of ₹ 90,000. Whether “Mr. P” is Qualified from being appointed as an Auditor of “ABC Ltd”₹
Answer:
Disqualifications as to Securities:
As per section 141(3)(d) (i) an auditor is disqualified to be appointed as an auditor if he, or his relative or partner holding any security of or interest in the company or its subsidiary, or of its holding or associate company or a subsidiary of such holding company.
However, the relative of the auditor may hold the securities or interest in the company of face value not exceeding ₹ 1,00,000.
Conclusion: In the present case, Mr. Q (relative of Mr. P, an auditor), is having securities of ₹ 90,000 face Value in the ABC Pvt. Ltd., which is as per requirement of proviso to section 141 (3) (d) (i), Therefore, Mr. P will not be disqualified to be appointed as an auditor of ABC Ltd.
Question 28.
“BC & Co.” is an Audit Firm having partners “Mr. B” and “Mr. C”, and “Mr. A” the relative of “Mr. C”, is holding securities of “MWF Ltd.” having face value of ₹ 1,01,000. Whether “BC & Co.” is qualified from being appointed as an Auditor of “MWF Ltd”₹
Would you answer will be changed if Mr. A hold 5000 shares (face value of ₹ 10 each) in MWF Ltd. Having market value of ₹ 1,50,000.
Answer:
Disqualifications as to security:
As per section 141(3) (d) (i) an auditor is disqualified to be appointed as an auditor if he, or his relative or partner holding any security of or interest in the company or its subsidiary, or of its holding or associate company or a subsidiary of such holding company.
However, the relative of the auditor may hold the securities or interest in the company of face value not exceeding of ₹ 1,00,000.
Conclusion: In the instant case BC & Co, will be disqualified for appointment as an auditor of MWF Ltd. as the relative of Mr. C i.e. partner of BC & Co., is holding the securities in MWF Ltd. which is exceeding the limit mentioned in provison to section 141(3)(d)(i).
However, in the second case, BC & Co. is eligible to be appointed as auditor, as relative may hold securities of face value upto ₹ 1 Lac.
Question 29.
M/s. ABC & Co. is an audit firm, having patterns CA. A, CA. B and CA. C. The firm has been offered the appointment as an auditor of XYZ Ltd. for the financial year 2020-21.
Mr. D, the relative of CA. A, is holding 25,000 shares (face value of ₹ 10 each) in XYZ Ltd. having market value of₹ Rs. 90,000. Are M/s. ABC & Co. qualified to be appointed as auditors of XYZ Ltd. (May 18 (4 Marks), MTP-May 20, RTP-Nov. 20]
Answer:
Disqualifications as to security:
- As per section 141 (3) (d) (i) an auditor is disqualified to be appointed as an auditor if he, or his relative or partner holding any security of or interest in the company or its subsidiary, or of its holding or associate company or a subsidiary of such holding company.
- However, the relative of the auditor may hold the securities or interest in the company of face value not exceeding of ₹ 1,00,000.
Conclusion: In the instant case ABC & Co, will be disqualified for appointment as an auditor of XYZ Ltd. as the relative of Mr. C i.e. partner of BC & Co., is holding the securities in XYZ Ltd. of face value of ₹ 2,50,000 which is exceeding the limit mentioned in proviso to section 141(3)(d)(i).
Question 30.
A, a chartered accountant has been appointed as auditor of Laxman Ltd. in the AGM of the company held in Sep. 2019, which assignment he accepted. Subsequently in January, 2018 he joined B, another chartered accountant, who is the Manager Finance of Laxman Ltd., as partner. [RTP-May 19]
Answer:
Disqualification as to partner of employee:
- Section 141(3)(c) of the Companies Act, 2013 prescribes that any person who is a partner or in employment of an officer or employee of the company will be disqualified to act as an auditor of a company.
- Sec. 141(4) provides that an auditor who becomes subject, after his appointment, to any of the disqualifications specified in Sec. 141 (3), he shall be deemed to have vacated his office as an auditor.
Conclusion: In the present case, A, an auditor of M/s Laxman Ltd., joined as partner with B, who is Manager Finance of M/s Laxman Limited, will be disqualified by Sec. 141 (3)(c) and, therefore, he shall be deemed to have vacated office of the auditor of M/s Laxman Limited.
Question 31.
An auditor purchased goods worth ₹ 501,500 on credit from a company being audited by him. The company allowed him one month’s credit, which it normally allowed to all known customers.
Answer:
Disqualification as to indebtedness:
- Section 141(3)(d) of the Companies Act, 2013 specifies that a person shall be disqualified to act as an auditor if he is indebted to the company for an amount exceeding ₹ 5 Lacs.
- Sec. 141(4) provides that a person appointed as auditor incurs any of the disqualification mentioned u/s 141(3) after his appointment, he shall vacate the office immediately and it will be treated a casual vacancy.
- Where an auditor purchases goods or services from a company audited by him on credit, he is considered to be indebted to the company and in case the outstanding amount exceeds ₹ 5 Lacs, he is disqualified to be appointed as auditor of the company.
- It does not make any difference if the company allows him the same credit period as it allows to other customers.
Conclusion: In instant case, auditor has become indebted to the company and consequently he has
deemed to have vacated his office.
Question 32.
Ram and Hanuman Associates, Chartered Accountants in practice have been appointed as Statutory Auditor of Krishna Ltd. for the accounting year 2019-2020. Mr. Hanuman holds 100 equity shares of Shiva Ltd., a subsidiary company of Krishna Ltd.
Answer:
Auditor holding securities of a company:
- As per Sec. 141 (3) (d) of the Companies Act, 2013, a person shall not be eligible for appointment as an auditor of a company, who, or his relative or partner is holding any security of or interest in the company or its subsidiary, or of its holding or associate company or a subsidiary of such holding company.
- In the present case, Mr. Hanuman, Chartered Accountant, a partner of M/s Ram and Hanuman Associates, holds 100 equity shares of Shiva Ltd. which is a subsidiary of Krishna Ltd.
Conclusion: The firm, M/s Ram and Hanuman Associates would be disqualified to be appointed as statutory auditor of Krishna Ltd., which is the holding company of Shiva Ltd., because one of the partner Mr. Hanuman is holding equity shares of its subsidiary.
Question 33.
Mr. Amar, a Chartered Accountant, bought a car financed at ₹ 7,00,000 by Chaudhary Finance Ltd., which is a holding company of Charan Ltd. and Das Ltd. He has been the statutory auditor of Das Ltd. and continues to be even after taking the loan.
Answer:
Disqualification as to indebtedness:
- As per Sec. 141(3)(cf)(;7) of the Companies Act, 2013, a person is not eligible for appointment as auditor of any company, If he is indebted to the company, or its subsidiary, or its holding or associate company or a subsidiary of such holding company, in excess of ₹ 5 Lacs.
- In the given case Mr. Amar is disqualified to act as an auditor u/s 141(3)(d)(;7) as he is indebted to M/s Chaudhary Finance Ltd. for more than ₹ 5 Lacs.
- Further he cannot act as an auditor of any subsidiary of Chaudhary Finance Ltd. i.e. he is also disqualified to work in Charan Ltd. & Das Ltd.
- Further Sec. 141 (4) provides that a person appointed as auditor incurs any of the disqualification mentioned u/s 141(3) after his appointment, he shall vacate the office immediately and it will be treated a casual vacancy.
Conclusion: Mr. Amar should vacate his office immediately and Das Ltd. must have to appoint any other CA as an auditor of the company.
Question 34.
Praveen, a member of the ICAI, does not hold a Certificate of practice. Is his appointment as an auditor valid₹
Answer:
Qualifications of an Auditor:
- As per Sec. 141(1) a person shall be qualified for appointment as an auditor of a company, only if he is a Chartered Accountant within the meaning of the Chartered Accountants Act, 1949.
- Under the Chartered Accountants Act, 1949, only a Chartered Accountant holding the certificate of practice can engage in public practice.
Conclusion: Mr. Praveen does not hold a certificate of practice and hence cannot be appointed as an auditor of a company.
Question 35.
‘B’ owes ₹ 5,01,000 to ‘C’ Ltd., of which he is an auditor. Is his appointment valid₹ Will it make any difference, if the advance is taken for meeting-out travelling expenses₹
Answer:
Indebtedness to the Company:
As per Section 141 (3) (d) (ii) of the Companies Act, 2013, a person who, or his relative or partner is indebted to the company, or its subsidiary, or its holding or associate company, or a subsidiary of its holding company, for an amount exceeding ₹ 5 Lacs, then he is not qualified for appointment as an auditor of a company.
Even if the advance was taken for meeting out travelling expenses particularly before commencement of audit work, his appointment is not valid because in such a case also the auditor shall be indebted to the company. The auditor is entitled to recover fees on a progressive basis only.
Conclusion: B’s appointment is not valid and he is disqualified as the amount of debt exceeds ₹ 5,00,000.
Question 36.
Mr. Aditya, a practising chartered accountant is appointed as a “Tax Consultant” of ABC Ltd., in which his father Mr. Singhvi is the Managing Director.
Answer:
Appointment of relative as tax consultant:
- Sec. 141(3)(f) of Companies Act, 2013 disqualifies a person to be appointed as auditor whose relative is a director or is in employment of the company as director or key managerial personnel.
- However, no such disqualification is prescribed under the law for appointing a person as a tax consultant therefore sec. 141(3)(f) will not be attracted.
Conclusion: Mr. Aditya can be appointed as a tax consultant irrespective that his father is the managing director of the company.
Question 37.
CA. P is providing the services of investment banking to C Ltd. Later on, he was also offered to be appointed as an auditor of the company for the current financial year. Advise. [RTP-May 18]
Answer:
Services not to be Rendered by the Auditor:
Section 144 of the Companies Act, 2013 prescribes certain services not to be rendered by the auditor. ‘ An auditor appointed under this Act shall provide to the company only such other services as are approved by the Board of Directors or the audit committee, as the case may be, but which shall not include any of the following services (whether such services are rendered directly or indirectly to the company or its holding company or subsidiary company), namely:
- accounting and book keeping services;
- internal audit;
- design and implementation of any financial information system;
- actuarial services;
- investment advisory services;
- investment banking services;
- rendering of outsourced financial services;
- management services; and
- any other kind of services as may be prescribed.
Further section 141(3)(i) of the Companies Act, 2013 also disqualify a person for appointment as an auditor of a company who is engaged as on the date of appointment in consulting and specialized services as provided in section 144.
In the given case, CA Innocent was appointed as an auditor of Contravene Ltd. He was offered additional services of actuarial, investment advisory and investment banking which was also approved by the Board of Directors.
Conclusion: The auditor is advised not to accept the services as these services are specifically notified in the services not to be rendered by him as an auditor as per section 144 of the Act.
Question 38.
Mr. Y was appointed as an auditor of PQR Ltd. for the year ended 31-3-2021 at the AGM held on 16-8-2020. Mr. Y has been indebted to the company for sum of ₹ 5,10,000 as on 1-4-2020, the opening date of accounting year which has been subject to his audit. However, Mr. Y having come to know that he might be appointed as auditor, he repaid the amount on 10-8-2020. One of the shareholders, complains that the appointment of Mr. Y as an auditor was invalid because he incurred disqualification u/s 141 of the Companies Act, 2013. Comment. [May 10 (6 Marks)]
Answer:
Relevant Date for determining Disqualification:
- As per Sec. 141(3) (d) of the Companies Act, 2013, a person who is indebted to the company for an amount exceeding ₹ 5,00,000 shall be disqualified to act as an auditor of such company.
- The relevant date for determining whether a person is disqualified or not is the date of appointment. Hence, if a person has liquidated his debt before the appointment date, there is no disqualification to be construed for such appointment.
- In the given case, Mr. Y was appointment as an auditor of PQR Ltd. for the year ended 31-3-2021 at the AGM held on 16-8-2020. He repaid the loan amount fully to the company on 10-8-2020 i.e. before the date of his appointment.
Conclusion:
The appointment of Mr. Y as an auditor is valid and the shareholder’s complaint is not acceptable.
Question 39.
Comment on the following: Sri & Company, a firm of Chartered Accountants was appointed as statutory auditors of Aaradhana Company Ltd. Aaradhana Company Ltd. holds 51% shares in Sarang Company Ltd. Mr. Sri, one of the partners of Sri & Company, owed ₹ 1,500 as on the date of appointment to Sarang Company Ltd. for goods purchased in normal course of business. [Nov. 10 (5 Marks)]
Answer:
Disqualification as to indebtedness:
As per Section 141[3](d)(ii) of the Companies Act, 2013, a person who, or his relative or partner is indebted to the company, or its subsidiary, or its holding or associate company, or a subsidiary of its holding company, for an amount exceeding ₹ 5,00,000 then he is not qualified for appointment as an auditor of a company.
Conclusion: Mr Sri is not disqualified to be appointed as auditor of the company as he is indebted to the company for an amount not exceeding ₹ 5,00,000, consequently, Sri & Co., is not disqualified to be appointed as an auditor of Aaradhana Company Ltd.
Question 40.
M/s RM & Co. is an audit firm having partners CA. R and CA. M. The firm has been offered the ap-pointment as an auditor of Enn Ltd. for the Financial Year 2020-21. Mr. Bee, the relative of CA. R, is holding 5,000 shares (face value of₹ 10 each) in Enn Ltd. having market value of₹ 1,50,000. One of the shareholders, complains that the appointment of RM & Co. as an auditor is invalid because it incurred disqualification u/s 141 of the Companies Act, 2013. Analyse and advise. [MTP-March 18, RTP-May 18]
Answer:
Disqualification u/s 141(3)(d):
1. Section 141(3)(d)(i) of Companies Act, 2013 provides that a person shall not be eligible for appointment as an auditor of a company, who, or his relative or partner is holding any security of or interest in the company or its subsidiary, or of its holding or associate company or a subsidiary of such holding company. However, as per proviso to this section, the relative of the person may hold the securities or interest in the company of face value not exceeding of ₹ 1,00,000.
2. In the instant case, M/s RM & Co. is an audit firm having partners CA. R and CA. M. Mr. Bee is a relative of CA. Rand he is holding shares of Enn Ltd. of face value of₹ 50,000 only (5,000 shares × ₹ 10 per share).
Conclusion: M/s RM & Co. is not disqualified for appointment as an auditor of Enn Ltd. as the relative of CA. R (i.e. partner of M/s RM & Co.) is holding the securities in Enn Ltd. which is within the limit mentioned in proviso to section 141(3)(d)(i) of the Companies Act, 2013.
Question 41.
RGS & Co. a firm of Chartered Accountants has three partners, namely, R, G & S. The firm is allotted the audit of BY Ltd. R, partner in the firm subsequently holds 100 shares in BY Ltd. Comment. [MTP-Oct. 18]
Answer:
Disqualification u/s 141(3)(d):
1. As per Sec. 141(3)(d) of Companies Act, 2013 read with Rule 10 of the Companies (Audit and Auditors) Rules, 2014, a person who, or his relative or partner is holding any security of or interest in the company or its subsidiary, or of its holding or associate company or a subsidiary of such holding company, shall not be eligible for appointment as an auditor of a company However, a relative may hold security or interest in the company of face value not exceeding ₹1 lakh.
2. Sec. 141(4) provides that where a person appointed as an auditor of a company incurs any of the disqualifications mentioned in Sec. 141(3) after his appointment, he shall vacate his office as such auditor and such vacation shall be deemed to be a casual vacancy in the office of the auditor.
3. In the instant case, RGS & Co. a firm of Chartered Accountants has three partners, namely, R, G & S. The firm is allotted the audit of BY Ltd. R, partner in the firm subsequently holds 100 shares in BY Ltd.
Conclusion: Applying the provisions of Sec. 141(3)(GQ and Sec. 141(4), it may be concluded that Firm of RGS, Chartered Accountants is not eligible to continue as auditors. Firm shall vacate its office as auditor and such vacation shall be treated as casual vacancy.
Question 42.
“CA. NM who is rendering management consultancy service to LA Ltd. wants to accept offer letter for appointment as an auditor of the LA Ltd. for the next financial year.” Discuss with reference to the provision of the Companies Act, 2013. [Nov. 18 (5 Marks)]
Answer:
Disqualification u/s 141(3)(i):
- Section 141 (3)(i) of Companies Act, 2013 provides that a person who directly or indirectly renders any service referred to in Sec. 144 to the company or its holding company or its subsidiary company shall not be eligible for appointment as an auditor of that company.
- Sec. 144 of Companies Act, 2013 provides the list of services which an auditor of the company cannot render, directly or indirectly to the company, its holding or subsidiary company. Management services is included in the list of services prescribed under section 144.
- In the instant case, CA. NM who is rendering management consultancy service to LA Ltd. wants to accept offer letter for appointment as an auditor of the LA Ltd. for the next financial year.
Conclusion:
CANM is disqualified by virtue of provisions of Sec. 141(3)(z) of Companies Act, 2013. Hence, he is advised not to accept the appointment as auditor as long as he is rendering management consultancy services to the company.
Question 43.
“ABC & Co.” is an Audit Firm having partners “Mr. A”, “Mr. B” and “Mr. C”, Chartered Accountants. “Mr. A”, “Mr. B” and “Mr. C” are holding appointment as an Auditor in 4,6 and 10 Companies respectively.
(i) Provide the maximum number of Audits remaining in the name of “ABC & Co.”
(ii) Provide the maximum number of Audits remaining in the name of individual partner i.e. Mr. A, Mr. B and Mr. C.
(iii) Can ABC & Co. accept the appointment as an auditor in 60 private companies having paid-up share capital less than ₹ 100 Cr., which has not committed default in filing its financial statements u/s 137 or annual return u/s 92 of Companies Act with the Registrar, 2 small companies and 1 dormant company?
(iv) Would your answer be different, if out of those 60 private companies, 45 companies are having paid-up share capital of ₹ 110 crore each? [MTP-Oct. 20]
Answer:
Ceiling on Number of Audit:
As per section 141(3) (g) of the Companies Act, 2013, a person shall not be eligible for appointment as an auditor if he is in full time employment elsewhere or a person or a partner of a firm holding appointment as its auditor, if such person or partner is at the date of such appointment or reappointment holding appointment as auditor of more than twenty companies;
As per section 141(3)(g), this limit of 20 company audits is per person. In the case of an audit firm having 3 partners, the overall ceiling will be 3 × 20 = 60 company audits. Sometimes, a chartered accountant is a partner in a number of auditing firms. In such a case, all the firms in which he is partner or proprietor will be together entitled to 20 company audits on his account.
Conclusion:
(i) ABC & Co. can hold appointment as an auditor of 40 more companies as computed below:
Total Number of Audits available to the Firm = 20 × 3 = 60
Number of Audits already taken by all the partners in their individual capacity = 4 + 6 + 10 = 20
Remaining number of Audits available to the Firm = 40
(ii) Mr. A can hold: 20 – 4 = 16 more audits.
Mr. B can hold 20 – 6 = 14 more audits and
Mr. C can hold 20 – 10 = 10 more audits.
(iii) ABC & Co. can hold appointment as an auditor in all the 60 private companies having paid-up share capital less than ₹ 100 crore, 2 small companies and 1 dormant company as these are excluded from the ceiling limit of company audits given under section 141 (3) (g) of the Companies Act, 2013.
(iv) ABC & Co. can accept the appointment as an auditor for 2 small companies, 1 dormant company, 15 private companies having paid-up share capital less than ₹ 100 crore, and 40 private companies having paid-up share capital of ₹ 110 crore each in addition to above 20 company audits already holding.
Question 44.
K8C & Co. a firm of Chartered Accountants has three partners, K, B & C; K is also in whole time employment elsewhere. The firm is offered the audit of ABC Ltd. and is already holding audit of 40 companies. Comment
Answer:
Ceiling on Number of Company Audits:
- As per section 141(3) (g) of the Companies Act, 2013, a person shall not be eligible for appointment as an auditor if he is in full time employment elsewhere or a person or a partner of a firm holding appointment as its auditor, if such person or partner is at the date of such appointment or reappointment holding appointment as auditor of more than twenty companies, other than one person company, dormant companies, small companies and private companies having paid up capital less then 100 Crores.
- In the firm of KBC & Co., K is in whole-time employment elsewhere, therefore, he will be excluded in determining the number of company audits that the firm can hold.
- If B and C do not hold any audits in their personal capacity or as partners of other firms, the total number of company audits that can be accepted by KBC & Co., is forty, and in the given case company is already holding forty audits.
Conclusion: KBC & Co. can’t accept the offer for audit of ABC Ltd.
Question 45.
PBS & Associates, a firm of Chartered Accountants, has three partners P, B and S. The firm is already having audit of 45 companies. The firm is offered 20 company audits. Decide and advise whether PBS & Associates will exceed the ceiling prescribed under Section 141(3)(g) of the Companies Act, 2013 by accepting the above audit assignments?
Answer:
Ceiling on Number of Company Audits:
- As per section 141(3)(g) of the Companies Act, 2013, a person shall not be eligible for appointment as an auditor if he is in full time employment elsewhere or a person or a partner of a firm holding appointment as its auditor, if such person or partner is at the date of such appointment or reappointment holding appointment as auditor of more than twenty companies, other than one person company, dormant companies, small companies and private companies having paid up capital less than 100 Crores. which has not committed default in filing its financial statements u/s 137 or annual return u/s92 of Companies Act with the Registrar.
- In the case of firm of auditors, it has been further provided that specified number of companies shall be construed as the number of companies specified for every partner of the firm who is not in full time employment elsewhere.
- In the firm of PBS & Associates, the overall ceiling will be 3 × 20 = 60 company audits.
- Assuming that the partners, P, B & S do not hold any audits in their personal capacity or as partners of other firms, the total number of company audits that can be accepted by PBS & Associates is sixty, and in the given case company is already holding forty five audits.
Conclusion: PBS & Associates can accept offer of audit of 15 Companies.
Question 46.
Discuss on the following: Ceiling on number of audit in a company to be accepted by an auditor. [Nov. 12 (5 Marks)]
Or
What are the provisions prescribed under Companies Act, 2013 in respect of ceiling on number of audits in a company to be accepted by an auditor? [MTP-April 19]
Or
What are the provisions prescribed under companies Act, 2013 in respect of ceiling on number of audits in a company to be accepted by an auditor? [MTP-April 19]
Answer:
Ceiling on number of audit;
1. Section 141(3)(g) of Companies Act, 2013 provides that a person is not eligible to be appointed as auditor of a company if he is in full time employment elsewhere or a person or a partner of a firm holding appointment as its auditor, if such persons or partner is at the date of such appointment or reappointment holding appointment as auditor of more than 20 Companies other than one person company, dormant companies, small companies and private companies having paid up share capital less than 100 Crores, which has not committed default in filing its financial statements u/s 13 7 or annual return u/s 92 of Companies Act with the Registrar.
2. In the case of firm of auditors, it has been further provided that specified number of companies shall be construed as the number of companies specified for every partner of the firm who is not in full time employment elsewhere.
3. Where any partner of the firm is also a partner of any other firm or firms of auditors, the number of companies which may be taken into account, by all the firms together, in relation to such partner shall not exceed the specified number, in the aggregate.
4. Where any partner of a firm of auditors is also holding office, in his individual capacity, as the auditor of one or more companies, the number of companies which may be taken into account in his case shall not exceed the specified number, in the aggregate.
Question 47.
“The remuneration of the auditor of a company shall be fixed in its general meeting or in such manner as may be determined therein.” Explain with reference to provisions of the Companies Act, 2013. [MTP-Oct. 19]
Answer:
Remuneration of Auditors:
As per Sec. 142 of the Act, the remuneration of the auditor of a company shall be fixed in its general meeting or in such manner as may be determined therein. However, board may fix remuneration of the first auditor appointed by it.
Further, the remuneration, in addition to the fee payable to an auditor, includes the expenses, if any, incurred by the auditor in connection with the audit of the company and any facility extended to him but does not include any remuneration paid to him for any other service rendered by him at the request of the company.
Hence, it may be concluded that the remuneration to auditor shall also include any facility provided to him.
Question 48.
“Auditor of a company shall have a right of access to the books of account and vouchers of the company” Explain.
Answer:
Auditor’s Right of Access to Books of account and vouchers of the company:
Sec. 143(1)of Companies Act, 2013 provides that every auditor of a company shall have aright of access at all times to the books of account and vouchers of the company, whether kept at the registered office of the company or at any other place.
The term ‘books of account and vouchers’ includes all books which have any bearing or are likely to have any bearing on the accounts, whether these be the usual financial books or the statutory or statistical books. Similarly, the term ‘voucher’ includes all or any of the correspondence which may in any way serve to vouch for the accuracy of the accounts.
When the auditor is denied access to books, etc., his only remedy would be to report to the members that he could not obtain all the information and explanations he had required or considered necessary for the performance of his duties as auditors.
Question 49.
Explain Auditor’s right and duties in relation to-
(a) Report to the members of the company on the accounts examined by him [RTP-Nov. 19]
(b) Obtain information and explanation from officers. [RTP-Nov. 18]
Answer:
Auditor’s Right and Duties in relation to report on the accounts examined:
Sec. 143(2] of the Companies Act, 2013 provides that the auditor shall make a report to the members of the company on the following:
- accounts examined by him and
- on every financial statement which are required by or under this Act to be laid before the company in general meeting and
The Auditor’s Report shall state that to the best of his information and knowledge, the said accounts, financial statements give a true and fair view of the state of the company’s affairs as at the end of its financial year and profit or loss and cash flow for the year and such other matters as may be prescribed.
Auditor’s Right and Duties to Obtain information and explanation from officers:
- Sec. 143(1] of the Companies Act, 2013 provides that every Auditor shall be entitled to require from the officers of the company such information and explanation as he may consider necessary for the performance of his duties as auditor.
- As per Sec. 2(59] of Companies Act, 2013, the term ‘officer’ includes any director, manager or key managerial personnel or any person in accordance with whose directions or instructions the BOD or any one or more of the directors is or are accustomed to act.
- When the auditor is not provided the information required by him or is denied access to books, etc., his only remedy would be to report to the members that he could not obtain all the information and explanations he had required or considered necessary for the performance of his duties as auditors.
Question 50.
State the matters to be specified in Auditor’s Report in terms of provisions of Section 143(3) of the Companies Act, 2013.
Answer:
Matters to be specified in Auditor’s report in terms of provisions of Section 143(3):
Sec. 143(3) of Companies Act, 2013 requires that he auditor’s report shall also state the following:
(a) whether he has sought and obtained all the information and explanations which to the best of his knowledge and belief were necessary for the purpose of his audit and if not, the details thereof and the effect of such information on the financial statements;
(b) whether, in his opinion, proper books of account as required by law have been kept by the company so far as appears from his examination of those books and proper returns adequate for the purposes of his audit have been received from branches not visited by him;
(c) whether the report on the accounts of any branch office of the company audited u/s 143(8] by a person other than the company’s auditor has been sent to him under the proviso to that sub-section and the manner in which he has dealt with it in preparing his report;
(d) whether the company’s balance sheet and profit and loss account dealt with in the report are in agreement with the books of account and returns;
(e) whether, in his opinion, the financial statements comply with the accounting standards;
(f) the observations or comments of the auditors on financial transactions or matters which have any adverse effect on the functioning of the company;
(g) whether any director is disqualified from being appointed as a director under sub-section (2) of section 164;
(h) any qualification, reservation or adverse remark relating to the maintenance of accounts and other matters connected therewith;
(i) whether the company has adequate internal financial controls with reference to financial statements in place and the operating effectiveness of such controls;
(j) such other matters as may be prescribed.
Question 51.
While conducting the audit of a limited company for the year ended 31st March, 2021, the auditor wanted to refer to the Minute Books. The Board of Directors refused to show the Minute Books to the auditor.
Or
During the audit of PQR Ltd. you as an auditor requested officers of the company to have access to secretarial records and correspondence which they refused to provide. Comment. [MTP-April 19]
Answer:
Right of Access to Books of Account:
- Sec. 143(1) of the Companies Act, 2013 grants powers to the auditor that every auditor has a right of access, at all times, to the books of account and vouchers of the company.
- The term books of account include all books which have any bearing or are likely to have any bearing on the accounts, whether these be the usual financial books or the statutory or statistical books.
- In order to verify actions of the company and to vouch and verify some of the transactions of the company, it is necessary for the auditor to refer to the decisions of the shareholders and/ or the directors of the company.
- It is, therefore, essential for the auditor to refer to the Minute Books. In the absence of the Minute Books, the auditor may not be able to vouch/verify certain transactions of the company.
Conclusion: In case the directors have refused to produce the Minute Books, the auditor may consider
extending the audit procedure as also consider qualifying his report in any appropriate manner.
Question 52.
The auditor of X Ltd. did not report on the matters, specified u/s 143(1) of the Companies Act, 2013, on which he inquired into, because of the reason that he was satisfied. But the management of the company wanted the auditor to report on those matters so that the members can also be aware of the true position of the company. Comment as to whether the auditor is required to report the matters, specified under the Act, he inquired into and whether the contention of the management is sustainable.
Answer:
Reporting of Matters contained under Section 143(1) of the Companies Act, 2013:
1. Sec. 143(1) of the Act deals with the duties of an auditor requiring him to make an inquiry in respect of specified propriety matters.
2. The matters in respect of which the inquiry has to be made by the auditor are relating to loans and advances on the basis of security, transactions represented merely by book entries, investments sold at less than cost price, loans and advances shown as deposits, personal expenses charged to revenue account etc.
3. The law requires the auditor to make an inquiry, the Research Committee of the Institute opined that the auditor is not required to report on these matters unless he has any special comments to make on any of the items referred to therein. If the auditor is satisfied as a result of the inquiries, he has no further duty to report that he is so satisfied.
4. Therefore, it could be said that the auditor should make a report to the members in case he finds answer to any of these matters in adverse,
Conclusion: The auditor of X Ltd. is correct in non-reporting on the matters specified in Sec. 143(1) of the Act and hence, the contention of the management is not sustainable.
Question 53.
“Travelling expenses of ₹ 2.25 lakhs shown in Statement of Profit and Loss of X Ltd., including a sum of₹ 1.10 lakhs spent by a Director on his foreign travel for company’s business accompanied by his mother for her medical treatment”. Comment.
Answer:
Personal Expenses of Directors
- All payments to Directors as remuneration or perquisites whether in the case of a public or private company need to be authorised in accordance with the Companies Act as well as Articles of Association of the company.
- If the terms of appointment of a Director include payment of expenses of a personal nature, then such expenses can be incurred by the company; otherwise, no such expense can be incurred or reimbursed by the company.
- In the instant case the auditor has to ensure that the payment made by the company towards foreign travel of Director’s mother is covered by terms of appointment or approved by the company in general meeting.
- This payment is also covered u/s 143(1), and hence auditor is required to inquire into the matter and make a disclosure in his report accordingly.
Question 54.
M/s XYZ & Co., auditors of Goodwill Education Foundation, a recognised non-profit organisation feels that the standards on auditing need not to be applied as Goodwill Education Foundation is a non-profit making concern.
Answer:
Compliance with Standards on Auditing;
- As per Sec. 143(9) of the Companies Act, 2013, every auditor shall comply with the auditing standards. Further as per Sec. 143(10), the Central Government may prescribe the standards of auditing or any addendum thereto, as recommended by the ICAI, in consultation with and after examination of the recommendations made by the NFRA.
- However, until any auditing standards are notified, standards of auditing specified by the ICAI shall be deemed to be the auditing standards.
- Further, the Preface to Standards on Auditing requires that while discharging their attest function; it is the duty of the Chartered Accountant to ensure that SAs are followed in the audit of financial information covered by their audit reports.
Conclusion: In the given case, even though the client is a non-profit oriented entity the SAs shall apply and the auditor is required to ensure their compliance. In case he fails to discharge his duty he shall be guilty of professional misconduct.
Question 55.
An auditor became aware of a matter regarding a company, only after he had issued his audit opinion. Had he become aware of the same prior to his issuing the audit report, he would have issued a different opinion.
Answer:
Auditor’s duties w.r.t. subsequent events:
- Sec. 146 of the Companies Act, 2013 requires the auditors of a company to attend the general meeting of the company unless otherwise exempted by the company.
- Auditor shall have the right to be heard at such meeting on any part of the business which concerns him as auditors.
- The discovery of a fact after issuance of the financial statements that existed at the date of the audit report which would have caused the revision of the audit report, requires the auditor to bring this to the notice of shareholders.
- Further SA 560 “Subsequent Event” also prescribes the procedures which the auditor is required to perform.
Conclusion: It will be advisable for the auditor to attend the meeting with a view to bringing to the notice of the shareholders the matter which came to his knowledge subsequent to his signing the report and perform procedures are per the requirement of SA 560.
Question 56.
Y, is the auditor of X Pvt. Ltd. In which there are four shareholders only, who are also the Directors of the company. On account of bad trade and for reducing the expenses in all directions, the directors asked Y to accept a reduced fee and for that he has been offered not to carry out such full audit as he has done in the past. Y accepted the suggestions of the directors.
Answer:
Restricting Scope of Audit:
- Auditor’s duties are governed by the provisions of Sec. 143 of Companies Act, 2013, which can not be restricted either by the director or even by the entire body of shareholders.
- Further, remuneration is a matter of arrangement between the auditor and the shareholders. Section 142 specifies the remuneration of an auditor, shall be fixed by the company in general meeting or in such manner as the company in general meeting may determine.
- Duties of auditor may not necessarily commensurate with his remuneration.
Conclusion: Y, should not accept the suggestions of the directors regarding the scope of the work to be done. If he accepts the suggestions of the directors regarding the scope of work to be done, it would not reduce his responsibility as an auditor under the law and he will be violating the provisions of the Companies Act, 2013.
Question 57.
At the Annual General Meeting of the Company, a resolution was passed by the entire body of shareholders restricting some of the powers of the Statutory Auditors. Whether powers of the Statutory Auditors can be restricted₹
Answer:
Restrictions on Powers of Statutory Auditors:
Section 143 of the Companies Act, 2013 provides that an auditor of a company shall have right of access at all times to the books and account and vouchers of the company whether kept at the Head Office or other places and shall be entitled to require from the offices of the company such information and explanations as the auditor may think necessary for the purpose of his audit.
These specific rights have been conferred by the statute on the auditor to enable him to carry out his duties and responsibilities prescribed under the Act, which cannot be restricted or abridged in any manner.
Further it was held in the case of Newton v. Birmingham Small Arms Co. that any resolution even if passed by entire body of shareholders which preclude the auditors from availing themselves of all the information for which they are entitled to under the Company Law are inconsistent with the Act and therefore null and void.
Conclusion: Any resolution restricting the scope of statutory right of auditor even if passed by entire body of shareholders is ultra virus and therefore void.
Question 58.
Mr. Rajendra, a fellow member of the Institute of Chartered Accountants of India, working as Manager of Shrivastav and Co., a Chartered Accountant firm, signed the audit report of Ora Ltd. on behalf of Shrivastav & Co.
Answer:
Signature on Audit Report:
Section 145 of the Companies Act, 2013 requires that the person appointed as an auditor of the company shall sign the auditor’s report or sign or certify any other document of the company in accordance with the provisions of Sec. 141(2), i.e. where a firm including a LLP is appointed as an auditor of a company, only the partners who are CAs shall be authorized to act and sign on behalf of the firm.
In the present case, Mr. Rajendra, a fellow member of the Institute and a manager of M/s Shrivastav & Co., Chartered Accountants, cannot sign on behalf of the firm in view of the specific requirements of the Companies Act, 2013. If any auditor’s report or any document of the company is signed or authenticated otherwise than in conformity with the requirements of Section 145, the auditor concerned and the person, if any, other than the auditor who signs the report or signs or authenticates the document shall, if the default is will ful, be punishable with a fine.
Question 59.
The members of C. Ltd. preferred a complaint against the auditor stating that he has failed to send the auditors report to them.
Answer:
Dispatch of Auditor’s Report to Shareholders:
- Section 143 of the Companies Act, 2013 lays down the powers and duties of auditor. As per provisions of the law, it is no part of the auditor’s duty to send a copy of his report to members of the company.
- The auditor’s duty concludes once he forwards his report to the company. It is the responsibility of company to send the report to every member of the company.
- In case of Allen Graig and Company (London) Ltd., it was held that duty of the auditor after having signed the report to be annexed to a balance sheet is confined only to forwarding that report to the secretary of the company. It will be for the secretary or the director to convene a general meeting and send the balance sheet and report to the members (or other person) entitled to receive it.
Conclusion: Auditor cannot be held liable for the failure to send the report to the shareholders.
Question 60.
One of the directors of Hitech Ltd. is attracted by the disqualification under Section 164(2) of the Companies Act, 2013.
Answer:
Disqualification of a Director under section 164(2) of the Companies Act, 2013:
- Section 143(3)(g) of the Companies Act, 2013 imposes a specific duty on the auditor to report whether any director is disqualified from being appointed as directors under section 164(2) of the Companies Act, 2013.
- The auditor has to ensure that written representation have been obtained by the Board from each director that one is not hit by Section 164(2).
Conclusion: In this case, one of the director is attracted by disqualification u/s 164(2) of the Act, the auditor shall state in his report as per Sec. 143 about the disqualification of the particular director.
Question 61.
The Board of Directors of a company have filed a complaint with the 1CA1 against their statutory auditors for their failing to attend the AGM of the Shareholders in which audited accounts were considered.
Answer:
Auditor’s Attendance at Annual General Meeting:
♦ Section 146 of the Companies Act, 2013 requires the auditor of a company to attend either by himself or through his qualified authorised representative to attend the general meeting, unless exempted.
♦ The said section provides that all notices and other communications relating to any general meeting of a company shall also be forwarded to the auditor.
♦ Further, it has been provided that the auditor shall have right to be heard at such meeting on any part of the business which concerns him as an auditor.
Conclusion:
Complaint filed by the Board of Directors is valid if the auditor was not being exempted by the company.
Question 62.
Mr. X, a Director of M/s KP Private Ltd., is also a Director of another company viz., M/s GP Private Ltd., which has not filed the financial statements and annual return for last three years 2018-19 to 2020-21. Mr. X is of the opinion that he is not disqualified u/s 164(2) of the Companies Act, 2013, and auditor should not mention disqualification remark in his audit report.
Answer:
Disqualification of a Director under section 164(2) of the Companies Act, 2013:
1. Section 143(3)(g) of the Companies Act, 2013 imposes a specific duty on the auditor to report whether any director is disqualified from being appointed as director u/s 164(2) of the Companies Act, 2013.
2. As per provisions of Section 164(2), if a director is already holding a directorship of a company which has not filed the financial statements or annual returns for any continuous period of 3 financial years shall not be eligible to be reappointed as a director of that company or appointed in other company for a period of five years from the date on which the said company fails to do so.
Conclusion: In this case, Mr. X is a director of M/s KP Private Ltd. as well as of M/s GP Private Ltd., And, M/s GP Private Ltd., has not filed the financial statements and annual return for last three years. Hence the provisions of section 164(2) are applicable to him and as such he is disqualified from directorship of both the companies. Therefore, the auditor shall report about the disqualification u/s 143(3)(g) of the Companies Act, 2013.
Question 63.
Comment: Contravene Ltd. appointed CA Innocent as an auditor for the company for the current financial year. Further the company offered him the services of actuarial, investment advisory and investment banking which was also approved by the Board of Directors.
Answer:
Services not to be Rendered by the Auditor:
Section 144 of the Companies Act, 2013 prescribes certain services not to be rendered by the auditor. An auditor appointed under this Act shall provide to the company only such other services as are approved by the Board of Directors or the audit committee, as the case may be, but which shall not include any of the following services (whether such services are rendered directly or indirectly to the company or its holding company or subsidiary company), namely:
- accounting and book keeping services;
- internal audit;
- design and implementation of any financial information system;
- actuarial services;
- investment advisory services;
- investment banking services;
- rendering of outsourced financial services;
- management services; and
- any other kind of services as may be prescribed.
Further section 141(3)(i) of the Companies Act, 2013 also disqualify a person for appointment as an auditor of a company who is engaged as on the date of appointment in consulting and specialized services as provided in section 144.
In the given case, CA Innocent was appointed as an auditor of Contravene Ltd. H e was offered additional services of actuarial, investment advisory and investment banking which was also approved by the Board of Directors.
Conclusion: The auditor is advised not to accept the services as these services are specifically notified in the services not to be rendered by him as an auditor as per section 144 of the Act.
Question 64.
Mr. Budiha, Statutory AuiJitors of Secret Ltd. was not permitted by the Board of Directors to attend general meeting of the company on the ground that his right to attend general meetings is restricted only to those meetings at which the accounts audited by him are to be presented and discussed.
Answer:
Auditor’s Attendance at Annual General Meeting:
- Section 146 of the Companies Act, 2013 requires the auditor of a company to attend either by himself or through his qualified authorised representative to attend the general meeting, unless exempted.
- The said section provides that all notices and other communications relating to any general meeting of a company shall also be forwarded to the auditor.
- Further, it has been provided that the auditor shall, have right to be heard at such meeting on any part of the business which concerns him as an auditor.
- In the present case Mr. Budha, Statutory Auditors of Secret Ltd. was not permitted by the Board of Directors to attend general meeting of the company on the ground that his right to attend general meetings is restricted only to those meetings at which the accounts audited by him are to be presented and discussed.
Conclusion: Action of Board of Directors is contrary to the provisions of Section 146 as auditor’s
duties and rights with respect of general meetings are extended to ali general meetings.
Question 65.
Explain the auditor’s duties with respect to reporting over fraud under Companies Act, 2013.
Or
Mr. A is appointed as statutory auditor of a company for the financial year ended 31st March, 2019. During the course of audit, it was found that few doubtful transactions had been committed by finance manager who retired in March, 2019. The fraud was going on since last 3 years and the total amount misappropriated exceeding ₹ 100 lakhs. As a statutory auditor, what would be reporting responsibilities of Mr. A? [May 18 (5 Marks}]
Answer:
Auditor’s duties to report fraud to the Central Government:
Section 143(12] of Companies Act, 2013 requires that if an auditor of a company in the course of the performance of his duties as auditor, has reason to believe that an offence of fraud involving such amount or amounts as may be prescribed, is being or has been committed in the company by its officers or employees, the auditor shall report the matter to the Central Government within such time and in such manner as may be prescribed. For this purpose, Rule 13 prescribes the amount of ₹ 1 Cr. or more.
However, in case of a fraud involving lesser than the specified amount, i.e. below ₹ 1 Cr., the auditor shall report the matter to the audit committee constituted u/s 177 or to the Board in other cases within such time and in such manner as may be prescribed:
The companies, whose auditors have reported frauds to the audit committee or the Board but not reported to the Central Government, shall disclose the details about such frauds in the Board’s report in such manner as may be prescribed.
Rulel3 of Companies (Audit and Auditors) Rules, 2014 prescribes the manner of Reporting of Frauds in various cases.
Question 66.
Explain the manner of Reporting of fraud under Companies Act, 2013
Answer:
Manner of Reporting of Fraud:
Rulel3 of Companies (Audit and Auditors] Rules, 2014 prescribes the manner of Reporting of Frauds as below:
1. If an auditor of a company, in the course of the performance of his duties as statutory auditor, has reason to believe that an offence of fraud, which involves or is expected to involve individually an amount of ₹ 1 Cr. or above, is being or has been committed against the company by its officers or employees, the auditor shall report the matter to the CG.
2. The auditor shall report the matter to the CG as under:
(a) the auditor shall report the matter to the Board or the Audit Committee, as the case may be, immediately but not later than 2 days of his knowledge of the fraud, seeking their reply or observations within 45 days;
(b) on receipt of such reply or observations, the auditor shall forward his report and the reply or observations of the Board or the Audit Committee along with his comments (on such reply or observations of the Board or the Audit Committee) to the CG within 15 days from the date of receipt of such reply or observations;
(c) in case the auditor fails to getany reply or observations from the Board or the Audit Committee within the stipulated period of 45 days, he shall forward his report to the CG along with a note containing the details of his report that was earlier forwarded to the Board or the Audit Committee for which he has not received any reply or observations;
(d) the report shall be sent to the Secretary, Ministry of Corporate Affairs in a sealed cover by Registered Post with Acknowledgement Due or by Speed Post followed by an e-mail in confirmation of the same;
(e) the report shall be on the letter-head of the auditor containing postal address, e-mail address and contact telephone number or mobile number and be signed by the auditor with his seal and shall indicate his Membership Number; and
[f] the report shall be in the form of a statement as specified in Form ADT-4.
3. In case of a fraud involving amount less than ₹ 1 Cr., the auditor shall report the matter to Audit Committee constituted u/s 177 or to the Board immediately but not later than 2 days of his knowledge of the fraud and he shall report the matter specifying the following:
(a) Nature of Fraud with description;
(b) Approximate amount involved; and
(c) Parties involved.
4. The following details of each of the fraud reported to the Audit Committee or the Board under sub-rule (3) during the year shall be disclosed in the Board’s Report:
(a) Nature of Fraud with description;
(b) Approximate Amount involved;
(c) Parties involved, if remedial action not taken; and
(d) Remedial actions taken.
Question 67.
Explain the term “Auditor’s Lien”. [Nov. 12 (4 Marks)]
Or
Though legally auditor may exercise right of Lien in case of companies, it is mostly impracticable for legal and practicable constraints. Do you agree₹ [May 19 (3 Marks)]
Answer:
Auditor’s Lien:
- Lien refers to the right of a person for lawful possession of somebody’s else property on which he has worked. Right of lien is exercised for non-payment of his dues for the work done.
- The auditor can exercise right of lien on the client’s books and documents in his possession for non-payment of fees by the client, for the work done on the books and documents.
- In respect of auditor exercising the lien, The institute of Chartered Accountants of England and Wales has expressed a similar view subject to the following conditions:
- Documents must belong to the client who owes the money,
- These documents must come to the possession of the auditor on the client’s authority.
- The auditor can retain such documents, only if he has done work on such documents, on which fees have not been paid.
In view of the conditions as stated above, it appears that though legally auditor may exercise right of Lien in case of companies, it is mostly impracticable for legal and practicable constraints.
It is to be noted in this regard that Ethical Standard Board of ICAI held that a chartered accountant cannot exercise lien over the client documents/records for non-payment of his fees.
Question 68.
State the services which are not to be rendered by an auditor as per the provisions of Companies Act, 2013. [Nov. 16 (6 Marks)]
Answer:
Services not to be Rendered by the Auditor:
Section 144 of the Companies Act, 2013 prescribes certain services not to be rendered by the auditor. An auditor appointed under this Act shall provide to the company only such other services as are approved by the Board of Directors or the audit committee, as the case may be, but which shall not include any of the following services (whether such services are rendered directly or indirectly to the company or its holding company or subsidiary company), namely:
- accounting and book keeping services;
- internal audit;
- design and implementation of any financial information system;
- actuarial services;
- investment advisory services;
- investment banking services;
- rendering of outsourced financial services;
- management services; and
- any other kind of services as may be prescribed.
Question 69.
Write short note on: Audit enquiry w.r.t. Companies Act, 2013. [Nov. 16 (4 Marks)]
Or
The auditor is not required to report on the matters specified in sub-section (1) of Section 143 unless he has any special comments to make on any of the items referred to therein. If he is satisfied as a result of the inquiries, he has no further duty to report that he is so satisfied. Explain clearly stating the matters for which the auditor has to perform his duty of inquiry under this section. [MTP-Aug. 18]
Or
Explain the duties of Auditor to inquire under Section 143(1) of the Companies Act, 2013. [RTP-Nov. 18]
Or
The auditor has to make inquires on certain matters under section 143(1) of Companies Act, 2013. Discuss those matters. [MTP-Oct, 20]
Answer:
Audit Inquiry u/s 143(1):
Section 143(1) of Companies Act, 2013 provides that amongst other matters, auditor is required to
inquire into the following matters, namely:
(a) whether loans and advances made by the company on the basis of security have been properly secured and whether the terms on which they have been made are prejudicial to the interests of the company or its members;
(b) whether transactions of the company which are represented merely by book entries are prejudicial to the interests of the company;
(c) where the company not being an investment company or a banking company, whether so much of the assets of the company as consist of shares, debentures and other securities have been sold at a price less than that at which they were purchased by the company;
(d) whether loans and advances made by the company have been shown as deposits;
(e) whether personal expenses have been charged to revenue account;
(f) where it is stated in the books and documents of the company that any shares have been allotted for cash, whether cash has actually been received in respect of such allotment, and if no cash has actually been so received, whether the position as stated in the account books and the balance sheet is correct, regular and not misleading.
Note: In the opinion of Research Committee of the ICAI, reporting in these matters is required only if the auditor finds answer to any of these matters in adverse.
Question 70.
Auditors have right to attend only those general meeting at which the accounts audited by them are to be discussed. Comment. [May 19 (3 Marks)]
Answer: Auditor’s right as to attend general meetings:
1. Sec. 146 of Companies Act, 2013 provides that all notices of, and other communications relating to, any general meeting shall be forwarded to the auditor of the company, and the auditor shall, unless otherwise exempted by the company, attend either by himself or through his authorised representative, who shall also be qualified to be an auditor, any general meeting and shall have right to be heard at such meeting on any part of the business which concerns him as the auditor.
2. Sec. 146 states that auditor is required to attend, either by himself or through his authorised representative any general meeting of the company. Hence the statement that auditors have right to attend only those general meeting at which the accounts audited by them are to be discussed does not seems to be correct.
Note: From the language of the provisions of Sec. 146, it appears thatto attend general meeting is auditor’s duty, not his right. Auditor has a right to be heard at such meeting on any part of the business which concerns him as the auditor.
Question 71.
According to Companies Act, 2013, the person appointed as an auditor of the company shall sign the auditor’s report in accordance with the relevant provisions of the Act. Explain clearly the relevant provisions relating to signing of report. [RTP-Nov. 19]
Answer:
Signing of Audit Report:
- As per section 145 of the Companies Act, 2013, the person appointed as an auditor of the company shall sign the auditor’s report or sign or certify any other document of the company, in accordance with the provisions of section 141(2).
- Section 141(2) of the Companies Act, 2013 states that where a firm including a limited liability partnership is appointed as an auditor of a company, only the partners who are chartered accountants shall be authorised to act and sign on behalf of the firm.
- The qualifications, observations or comments on financial transactions or matters, which have any adverse effect on the functioning of the company mentioned in the auditor’s report shai! be read before the company in general meeting,
Question 72.
The head accountant of a company entered fake invoices of credit purchases in the books of account i aggregate of ₹ 50 lakh and cleared all the payments to such bogus creditor. How will you deal as an auditor? [RTP-May 20]
Answer:
Reporting of Fraud:
- As per requirement of Sec. 143[12] of Companies Act, 2013 read with Rule 13 of Companies (Audit and Auditor’s] Rules, 2 014, the auditor of the company is required to report the fraudulent activity to the Board or Audit Committee (as the case may be] within 2 days of his knowledge of fraud.
- Company is also required to disclose the same in Board’s Report.
- It may be noted that the auditor need not to report the Central Government as the amount of fraud involved is less than ₹ 1 crore, however, reporting under CARO, 2016 is required.
Question 73.
Examine the applicability of CARO, 2020 in the below mentioned cases:
(a) Educating Child is a limited company registered under section 8 of the Companies Act, 2013.
(b) Ashu Pvt. Ltd. having paid capital and reserves of ₹ 50 lakh. During the year, the company had borrowed ₹ 70 lakh each from a bank and a financial institution independently. Turnover for the year was ₹ 900 lakh.
Answer:
Applicability of CARO, 2020
CARO, 2020 shall apply to every company including a foreign company as defined in Sec. 2(42] of the Companies Act, 2013, except:
- a banking company;
- n insurance company;
- a company licensed to operate u/s 8 of the Companies Act;
- a One Person Company as defined in Sec. 2(62) of the Companies Act and a Small Company as defined in Sec. 2(85) of the Companies Act; and
- a private limited company, not being a subsidiary or holding of a public company,
- having a Paid up capital & Reserves & Surplus not more than ₹ 1 Cr. as on the balance sheet date, and
- which does not have total borrowings exceeding ₹ 1 Cr. from any bank or financial institution at any point of time during the financial year, and
- which does not have a total revenue as disclosed in Schedule III to the Companies Act, 2013 (including revenue from discontinuing operations) exceeding ₹ 10 Cr. during the financial year as per the financial statements.
Conclusion: (a] CARO, 2020 is not applicable in case of Educating Child as it is registered under section 8 of the Companies Act, 2013 (b] In case of Ashu Pvt. Ltd., CARO, 2020 is applicable as borrowings in aggregate exceeds ₹ lCr.
Question 74.
Write short note on: Reporting requirement under CARO, 2020 w.r.t. physical verification of Property, Plant and Equipment.
Answer:
Reporting requirement under CARO w.r.t. Physical Verification of Property, Plant and Equipment:
1. Para 3 of CARO 2020 requires the auditor to comment “Whether the Property, Plant and Equipment have been physically verified by the management at reasonable intervals; whether any material discrepancies were noticed on such verification and if so, whether the same have been properly dealt with in the books of account.
2. The term “Reasonable Intervals” has not been defined and hence depends upon the circumstances of each case considering the number of assets, nature of assets, relative value of assets, difficulty in verifications, situation of the assets etc.
3. The management may decide about the periodicity of physical verification of fixed assets, While an annual verification may be reasonable; it may be impracticable to carry out the same in some cases. In such cases the verification should be programmed in such manner that all assets are verified at least once in every three years.
4. Auditor is also required to obtain a written representation from management confirming that the fixed assets are physically verified by the management in accordance with the policy of the company. The representation should mention the periodicity of the physical verification, details of the material discrepancies noticed during the physical verification. If no discrepancies were noticed during the physical verification, the representation should also mention this fact clearly.
Question 75.
The company has dispensed with the practice of taking inventory of their inventories at the year- end as in their opinion the exercise is redundant, time consuming and intrusion to normal functioning of the operations. Explain reporting requirement under CARO, 2020.
Answer:
Reporting Requirements w.r.t. Inventory:
Para 3[ii] of CARO, 2020 requires the auditor to comment on the following:
(a) whether physical verification of inventory has been conducted at reasonable intervals by the management; and
(b) whether, in the opinion of the auditor, the coverage and procedure of such verification by the management is appropriate;
(c) whether any discrepancies of 10% or more in the aggregate for each class of inventory were noticed and if so, whether they have been properly dealt with in the books of account;
Question 76.
Comment: No cost accounting records are maintained though the company is required to maintain the same.
Answer:
Non-maintenance of Cost Records;
- As per the CARO, 2020, where maintenance of cost records has been prescribed by the C. G., auditor of the company is specifically required to state whether such accounts and records as prescribed have been made and maintained.
- Though the auditor is not required to conduct detailed audit but the auditor is expected to conduct a general review of the cost records to determine whether the prescribed accounts and records are prima facie complete.
- Therefore, whether cost audit is ordered or not the auditor should report upon the non maintenance of the cost records.
Question 77.
Comment on the following: ABC Ltd. Has not deposited provident fund contributions of ₹ 20 lakhs to the authorities, but accounted in the books.
Answer:
Non-Deposit of Provident Fund Dues:
- The auditor’s report under CARO, 2020 has to specifically state whether the company is regular in depositing undisputed statutory dues including PF with the appropriate authority and, if not, the extent of the arrears of outstanding statutory dues as at the last day of the FY year concerned for a period of more than six months from the date they became payable, shall be indicated by the auditor.
- In this case, the failure of ABC Ltd. To deposit provident fund of ₹ 20 lakhs will be reported by the auditor as per CARO, 2020 issued u/s 143(11) of the Companies Act, 2013.
- In indicating the arrears, the period to which the arrears relate should preferably be also given.
Question 78.
Comment on the following: XYZ (Pvt.) Ltd. has paid up capital and Reserves of ₹ 110 lacs and secured Loans of Nationalized Banks having sanctioned limit of ₹ 28 lacs and outstanding balance of₹ 23 lacs. The turnover of the company is 10.10 crores for the year ended 31-3-2021. Customer returns goods worth 40 lacs on 2-4-2021, out of sales made during the year ended 31-3-2021. The management is of the opinion that CARO is not applicable to the company. [May 10 (6 Marks)]
Answer:
Applicability of CARO:
CARO is not applicable to a private limited company:
- having a paid up capital & Reserves & Surplus not more than ₹ 1 Cr. as on the balance sheet date, and
- which does not have total borrowings exceeding ₹ 1 Cr. from any bank or financial institution at any point of time during the financial year, and
- which does not have a total revenue as disclosed in Schedule III to the Companies Act, 2013 (including revenue from discontinuing operations) exceeding ₹ 10 Cr. during the financial year as per the financial statements.
In the given case, the paid up capital and reserves of XYZ (Private) Ltd. is ₹ 110 lacs. Outstanding loan amount is ₹ 23 lacs although sanction limit is ₹ 28 lacs. Company’s turnover is ₹ 10.10 crores.
Sales return are deducted from the turnover in the year in which return takes place.
Conclusion: Contention of the management that provision of CARO are not applicable over the company is not correct and the auditor is required to report on the matter specified in the said order.
Question 79.
On what companies the CARO, 2020 is applicable and what companies are not covered by it₹
Or
What is CARO? Explain the companies which are not covered by CARO. [Nov. 11 (8 Marks)]
Or
Write short note on: Companies not covered under CARO [Nov. 14 (4 Marks)]
Or
Discuss which class of companies are specifically exempt from the applicability of CARO. [Nov. 16 (6 Marks)]
Answer:
Applicability of CARO, 2020:
CARO, 2020 shall apply to every company including a foreign company as defined in Sec. 2(42) of the Companies Act, 2013, except:
(i) a banking company;
(ii) an insurance company;
(iii) a company licensed to operate u/s 8 of the Companies Act;
(iv) a One Person Company as defined in Sec. 2(62) of the Companies Act and a Small Company as
defined in Sec. 2(85) of the Companies Act; and
(v) a private limited company, not being a subsidiary or holding of a public company,
- having a Paid up capital & Reserves & Surplus not more than ₹ 1 Cr. as on the balance sheet date, and
- which does not have total borrowings exceeding ₹ 1 Cr. from any bank or financial institution at any point of time during the financial year, and
- which does not have a total revenue as disclosed in Schedule 111 to the Companies Act, 2013 (including revenue from discontinuing operations) exceeding ₹ 10 Cr. during the financial year as per the financial statements.
The order would be applicable for unlimited companies irrespective of the size of their paid up capital and reserves, turnover or borrowings.
Question 80.
Discuss the matters to be included in the auditor’s report regarding statutory dues and repayment of loans or borrowing to a financial institution, bank, Government or dues to debenture holders as per CARO, 2020.
Answer:
Reporting under CARO, 2020
(a) Statutory Dues:
- Whether the company is regular in depositing undisputed statutory dues including GST, provident fund, employees’ state insurance, income-tax, sales-tax, service tax, duty of customs, duty of excise, value added tax,cess and any other statutory dues to the appropriate authorities and if not, the extent of the arrears of outstanding statutory dues as at the last day of the financial year concerned for a period of more than six months from the date they became payable, shall be indicated.
- Where statutory dues referred above have not been deposited on account of any dispute, then the amounts involved and the forum where dispute is pending shall be mentioned.
(b) Repayment of Loans and Borrowings:
Whether the company has defaulted in repayment of loans or other borrowings or in the payment of interest thereon to any lender, if yes, the period and amount of default to be reported as per the format below:
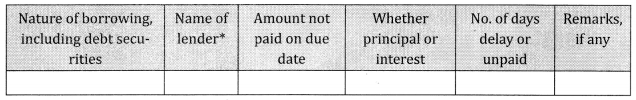
lender wise details to be provided in case of defaults to banks, financial institutions and Government.
(b) whether the company is a declared wilful defaulter by any bank or financial institution or other lender
Question 81.
State the matters to be included in the auditor’s report as per CARO, 2020 regarding-
(a) Default in repayment of loans or borrowing to a financial institution, bank etc.
(b) Fraud by the company or on the Company by its officers or employees.
Answer:
Reporting under CARO, 2020
(a) Default in Repayment of Loans and Borrowings:
Whether the company has defaulted in repayment of loans or other borrowings or in the payment of interest thereon to any lender, if yes, the period and amount of default to be reported as per the format below:
lender wise details to be provided in case of defaults to banks, financial institutions and Government.
(b) Fraud by the company or on the company [Para 3(xi)]:
- Whether any fraud by the company or any fraud on the Company has been noticed or reported during the year; If yes, the nature and the amount involved is to be indicated.
- Whether any report u/s 143(12) of the Companies Act has been filed by the auditors in Form ADT-4 as prescribed under rule 13 of Companies (Audit and Auditors) Rules, 2014 with the Central Government;
- Whether the auditor has considered whistle-blower complaints, if any, received during the year by the company.
Question 82.
State the matters to be included in the auditor’s report as per CARO, 2020 regarding-
(i) Private placement of preferential issue.
(ii) Utilisation of IPO and further public offer. [May 18 (4 Marks)]
Answer:
Reporting requirements under CARO, 2020:
(i) Private Placement of Preferential issues:
Para 3(x) of CARO, 2020 requires the following:
- Whether the company has made any preferential allotment or private placement of shares or convertible debentures (fully, partially or optionally convertible) during the year and if so,
- Whether the requirements of section 42 and section 62 of the Companies Act, 2013 have been complied with and the funds raised have been used for the purposes for which the funds were raised, if not, provide details in respect of amount involved and nature of noncompliance;
(ii) Utilisation of IPO and Further Public Offer:
Para 3(x) of CARO, 2020 requires the following:
- Whether moneys raised by way of initial public offer or further public offer (including debt instruments) during the year were applied for the purposes for which those are raised, if not,
- The details together with delays or default and subsequent rectification, if any, as may be applicable, be reported.
Question 83.
State the matters to be included in the auditor’s report as per CARO, 2020 regarding-
(i) Property Plant and Equipment
(ii) Statutory dues
Or
Explain the Reporting requirements the auditor should ensure under CARO, 2020 related to Property Plant and Equipment. [May 19 (3 Marks)]
Answer:
Matters to be included in the Auditor’s Report under CARO, 2020:
The auditor’s report on the accounts of a company to which CARO applies shall include a statement on the following matters, namely-
(i) Property, Plant and Equipment:
As per clause (i) of Para 3 of CARO, 2020, reporting requirements in respect of property, plant and equipment are:
Adequacy of Records:
- Whether the company is maintaining proper records showing full particulars, including quantitative details and situation of Property, Plant and Equipment.
- Whether the company is maintaining proper records showing full particulars of intangible assets.
Physical verification:
- Whether these Property, Plant and Equipment have been physically verified by the management at reasonable intervals;
- Whether any material discrepancies were noticed on such verification and if so,
- Whether the same have been properly dealt with in the books of account.
Title Deeds:
- Whether the title deeds of all the immovable properties (Other than properties where the company is the lessee and the lease agreements are duly executed in favour of the lessee) disclosed in the financial statements are held in the name of the company.
- If not, provide details in Specific format.
Revaluation of Property, Plant and Equipment:
- Whether the company has revalued its Property, Plant and Equipment (including Right of Use assets) or intangible assets or both during the year and,
- If so, whether the revaluation is based on the valuation by a Registered Valuer; specify the amount of change, if change is 10% or more in the aggregate of the net carrying value of each class of Property, Plant and Equipment or intangible assets;
Proceedings for holding Benami Property:
- Whether any proceedings have been initiated or are pending against the company for holding any benami property under the Benami Transactions (Prohibition) Act, 1988 and rules made thereunder,
- If so, whether the company has appropriately disclosed the details in its financial statements.
(ii) Statutory Dues:
- Whether the company is regular in depositing undisputed statutory dues including GST, provident fund, employees’ state insurance, income-tax, sales-tax, service tax, duty of customs, duty of excise, value added tax,cess and any other statutory dues to the appropriate authorities and if not, the extent of the arrears of outstanding statutory dues as at the last day of the financial year concerned for a period of more than six months from the date they became payable, shall be indicated.
- Where statutory dues referred above have not been deposited on account of any dispute, then the amounts involved and the forum where dispute is pending shall be mentioned.
Question 84.
“The company has raised funds by issuing fully convertible debentures. These funds were raised for the expansion and diversification of the business. However, the company utilized these funds for repayment of long term loans and advances.” Advise the auditor regarding requirements under CARO, 2020. [Nov. 18 (4 Marks)]
Answer:
Reporting requirements under CARO, 2020:
Para 3(x) of CARO, 2020 requires the following:
- Whether moneys raised by way of initial public offer or further public offer (including debt instruments) during the year were applied for the purposes for which those are raised, if not,
- The details together with delays or default and subsequent rectification, if any, as may be applicable, be reported.
- In the instant case, company has raised funds by issuing fully convertible debentures. These funds were raised for the expansion and diversification of the business. However, the company utilized these funds for repayment of long-term loans and advances.
Conclusion: Auditor is required to report the fact that funds raised for the expansion and diversification
of the business by issue of fully convertible debentures were utilized for repayment of long term
loans and advances.
Question 85.
M Ltd. has given certain loans to related parties and also has accepted certain deposits. As an auditor, how you include the above items in paragraph 3 of CARO, 2020₹ [Nov. 19 (4 Marks)]
Answer:
Reporting under CARO, 2020:
(i) Loans to related parties:
Whether during the year the company has granted any loans or advances in the nature of loans, secured or unsecured, to companies, firms, Limited Liability Partnerships or any other parties, if so,
a. whether during the year the company has provided loans or provided advances in the nature of loans, if so, indicate-
i. the aggregate amount during the year, and balance out standing at the balance sheet date with respect to such loans or advances to subsidiaries, joint ventures and associates;
ii. the aggregate amount during the year, and balance outstanding at the balance sheet date with respect to such loans or advances to parties other than subsidiaries, joint ventures and associates;
b. whether the terms and conditions of the grant of all loans and advances in the nature of loans and guarantees provided are not prejudicial to the company’s interest;
c. in respect of loans and advances in the nature of loans, whether the schedule of repayment of principal and payment of interest has been stipulated and whether the repayments or receipts are regular;
d. if the amount is overdue, state the total amount overdue for more than 90 days, and whether reasonable steps have been taken by the company for recovery of the principal and interest;
e. whether any loan or advance in the nature of loan granted which has fallen due during the year, has been renewed or extended or fresh loans granted to settle the overdues of existing loans given to the same parties, if so, specify the aggregate amount of such dues renewed or extended or settled by fresh loans and the percentage of the aggregate to the total loans or advances in the nature of loans granted during the year [not applicable to companies whose principal business is to give loans];
f. whether the company has granted any loans or advances in the nature of loans either repayable on demand or without specifying any terms or period of repayment, if so, specify the aggregate amount, percentage thereof to the total loans granted, aggregate amount of loans granted to Promoters, related parties as defined in Sec. 2(76) of the Companies Act, 2013.
(ii) Public Deposits:
In case the company has accepted deposits from the public, Para 3(v) of CARO, 2020 requires the auditor to report the following:
(a) Whether the directives issued by the RBI and the provisions of sections 73 to 76 or any other relevant provisions of the Companies Act and the rules framed thereunder, where applicable, have been complied with. If not, the nature of contraventions be stated;
(b) If an order has been passed by Company Law Board or National Company Law Tribunal or Reserve Bank of India or any Court or any other Tribunal, whether the same has been complied with or not₹
Question 86.
Write short note on: Joint audit [Nov. 08 (5 Marks)]
Or
Explain the concept of Joint Audit. Discuss its advantages and Disadvantages. [May 11 (8 Marks)]
Or
Discuss the following: Advantages and Disadvantages of Joint Audit. [Nov. 14 (5 Marks)]
Or
The practice of appointing Chartered Accountants as joint auditors is quite widespread in big companies and corporations. Explain stating the advantages of the joint audit. [RTP-Nov. 19]
Answer:
Joint Audit – Meaning, Advantages and Disadvantages:
Meaning: Joint audit means that more than one firm/individuals is appointed as the Statutory Auditors of the company. It implies pooling together the resources and expertise of two or more firms to perform an expert job. SA 299 “Joint Audit of financial statements” deals with the professional responsibilities which the auditors undertake in accepting appointments as joint auditors.
Advantages:
(a) Poling and sharing of expertise.
(b) Better quality of work performance
(c) Advantage of mutual consultation.
(d) Improved services to client.
(e) Lower costs to carry out the audit work.
(f) Healthy competition towards a better performance
Disadvantages:
(a) Co-ordination problems in conduct of work.
(b) Lack of clear definition of responsibility.
(c) Different standings of joint auditee.
(d) Negligence of areas of common concern.
(e) Sharing of fees.
(f) Uncertainty about the liability for the work done.
Question 87.
A joint auditor is not bound by the views of the majority of the joint auditors regarding matters to be covered in the report, lustily this statement in the light of responsibilities of Joint Auditors under SA 299. [May 10 (5 Marks}]
Answer:
Reporting Responsibilities of Joint Auditor:
(a) The statement that a joint auditor is not bound by the views of the majority of the joint auditors regarding the matters to be covered in the report is true.
(b) SA 299 “Joint Audit of Financial Statements” provides the following in respect of reporting responsibilities of joint auditor:
- Joint auditors are required to issue common audit report.
- However, in case of any disagreement among joint auditors with regard to the opinion or any matters to be covered by the audit report, they shall express their opinion in a separate audit report.
- A joint auditor is not bound by the views of the majority of the joint auditors regarding the opinion or matters to be covered in the audit report and shall express opinion formed by the said joint auditor in separate audit report in case of disagreement.
- In case of separate reports, the audit report(s) issued by the joint auditor(s) shall make a reference to the separate audit report(s) issued by the other joint auditor(sj. Such reference shall be made under the heading “Other Matter Paragraph” as per SA 706
Question 88.
Write short note on: Responsibilities of Joint Auditor.
Or
In joint Audit, “each joint auditor is responsible only for the work allocated to him”. [May 12 (5 Marks)]
Or
You have been appointed as an auditor of a company along with 2 other auditors. What steps would you like to take to ensure a smooth and effective audit? To what extent do you think you will be responsible in relation to the work performed by yours co-auditors and vice versa?
Or
Mention the points/areas in which all the joint auditors are jointly and severally responsible. [Nov. 15 (5 Marks)]
Answer:
Areas of Joint Responsibility in case of Joint auditors:
SA 299 “Joint Audit of Financial Statements” deals with the responsibilities of joint auditors. Accordingly, in respect of audit work divided among the joint auditors, each joint auditor shall be responsible only for the work allocated to such joint auditor including proper execution of the audit procedures.
All the joint auditors shall be jointly and severally responsible for:
1. the audit work which is not divided among the joint auditors and is carried out by all joint auditors;
2. decisions taken by all the joint auditors under audit planning in respect of common audit areas concerning the NTE of the audit procedures to be performed by each of the joint auditors;
3. matters which are brought to the notice of the joint auditors by any one of them and on which there is an agreement among the joint auditors;
4. examining that the F.S. of the entity comply with the requirements of the relevant statutes;
5. presentation and disclosure of the F.S. as required by the applicable FRF;
6. ensuring that the audit report complies with the requirements of the relevant statutes, the applicable Standards on Auditing and the other relevant pronouncements issued by ICAI.
It shall be the responsibility of each joint auditor to determine the NTE of audit procedures to be applied in relation to the areas of work allocated to said joint auditor.
It is the individual responsibility of each joint auditor to study and evaluate the prevailing system of internal control and assessment of risk relating to the areas of work allocated to said joint auditor.
Question 89.
“Before the commencement of audit, the joint auditors should discuss and develop a joint audit plan.” Discuss the points to be considered in developing the joint audit plan by the joint auditors. [Nov. 19 (4 Marks)]
Answer:
Points to be considered in developing the joint audit plan
As per SA 299 “Joint Audit of Financial Statements” Prior to the commencement of the audit, the
joint auditors shall discuss and develop a joint audit plan. In developing the joint audit plan, the
joint auditors shall:
(a) Identify division of audit areas and common audit areas amongst the joint auditors that define the scope of the work of each joint auditor;
(b) Ascertain the reporting objectives of the engagement to plan the timing of the audit and the nature of the communications required;
(c) Consider and communicate among all joint auditors the factors that, in their professional judgment, are significant in directing the engagement team’s efforts;
(d) Consider the results of preliminary engagement activities and, where applicable, whether knowledge gained on other or similar engagements performed earlier by the respective engagement partner(s) for the entity is relevant.
(e) Ascertain the NTE of resources necessary to perform the engagement.
Question 90.
X Ltd. has a branch office in Malaysia. The company has appointed Mr. X, who is qualified to audit accounts as per Malaysian laws. Mr. Z, the statutory auditor objects to the same, contending that he alone can audit the branch office accounts. Discuss.
Answer:
Eligibility criteria for appointment as Branch Auditor
As per Sec. 143(8) of the Companies Act, 2013, where the branch office is situated in a country outside India, the accounts of the branch office shall be audited either by the company’s auditor or by an accountant or by any other person duly qualified to act as an auditor of the accounts of the branch office in accordance with the laws of that country.
Hence, a company can appoint as auditor of a foreign branch an accountant duly qualified to act as an auditor in accordance with the laws of the foreign country.
Conclusion: Mr. Z contention that he alone can audit the branch office accounts is not valid.
Question 91.
When the accounts of the branch are audited by a person other than the company’s auditor, there is need for a clear understanding of the role of such auditor and the company’s auditor in relation to the audit of the accounts of the branch and the audit of the company as a whole. Explain. [RTP-Nov. 18, MTP-Oct. 20]
Answer:
Role and Responsibilities of Company Auditor and Branch Auditor:
SA 600 “Using the work of Another Auditor” establishes the standard when an auditor, reporting on the financial statements of a company, uses the work of another auditor on the financial information of one or more components included in the financial statements of the entity. There should be sufficient liaison between the principal auditor and the other auditor. SA 600 provides the following in this regard:
1. Where another auditor has been appointed for the component, the principal auditor would normally be entitled to rely upon the work of such auditor unless there are special circumstances to make it essential for him to visit the component and/or to examine the books of account and other records of the said component. Further, it requires that the principal auditor should perform procedures to obtain sufficient appropriate audit evidence, that the work of the other auditor is adequate for the principal auditor’s purposes, in the context of the specific assignment.
2. When using the work of another auditor, the principal auditor should ordinarily perform the following procedures:
(a) advise the other auditor of the use that is to be made of the other auditor’s work and report and make sufficient arrangements for co-ordination of their efforts at the planning stage of the audit. The principal auditor would inform the other auditor of matters such as areas requiring special consideration, procedures for the identification of inter-component transactions that may require disclosure and the time-table for completion of audit; and
(b) advise the other auditor of the significant accounting, auditing and reporting requirements and obtain representation as to compliance with them.
3. The principal auditor might discuss with the other auditor the audit procedures applied or review a written summary of the other auditor’s procedures and findings which may be in the form of a completed questionnaire or check-list.
4. The principal auditor may also wish to visit the other auditor. The nature, timing and extent of procedures will depend on the circumstances of the engagement and the principal auditor’s knowledge of the professional competence of the other auditor. This knowledge may have been enhanced from the review of the previous audit work of the other auditor.
Question 92
Explain the audit procedure when principal auditor is using the work of another auditor. [Nov. 14 (8 Marks)]
Answer:
Audit Procedure when principal auditor is using the work of another auditor:
As per SA 600 “Using the work of Another Auditor” when the principal auditor is using the work of another auditor, he is supposed to perform the following:
(a) When principal auditor plans to use the work of another auditor, he should consider the professional competence of the other auditor in the context of specific assignment if the other auditor is not a member of the ICAI.
(b) The principal auditor should perform procedures to obtain sufficient appropriate audit evidence, that the work of the other auditor is adequate for the principal auditor’s purposes, in the context of the specific assignment.
(c) The principal auditor should consider the significant findings of the other auditor.
(d) The principal auditor should document in his audit working papers the followings
- Components audited by another;
- Audit procedures adopted and results thereof;
- Conclusion that particular component is not material;
- Manner of dealing with modification in another auditor’s report
(e) When the principal auditor concludes, based on his procedures, that the work of the other auditor cannot be used and the principal auditor has not been able to perform sufficient additional procedures regarding the financial information of the component audited by the other auditor, the principal auditor should express a qualified opinion or disclaimer of opinion because there is a limitation on the scope of audit.
(f) When the principal auditor has to base his opinion on the financial information of the entity as a whole relying upon the statements and reports of the other auditors, his report should state clearly the division of responsibility for the financial information of the entity by indicating the extent to which the financial information of components audited by the other auditors have been included in the financial information of the entity.
Question 93.
There should be a sufficient liaison between a principal auditor and other auditors”. Discuss the above statement and state in this context the reporting consideration, when the auditor uses the professional work performed by other auditor.
Answer:
Coordination between Principal Auditor and Other Auditor:
SA 600 “Using the work of Another Auditor” applies in situation where an auditor [principal auditor), reporting on the financial information of an entity, uses the work of another auditor [other auditor) with respect to the financial information of one or more components included in the financial information ofthe entity. To ensure coordination among both of them, SA 600 provides the followings:
1. There should be sufficient liaison between the principal auditor and the other auditor.
2. For this purpose, the principal auditor may find it necessary to issue written communication(s) to the other auditor.
3. The other auditor, knowing the context in which his work is to be used by the principal auditor, should co-ordinate with the principal auditor.
- Adhering to time-table.
- Bringing to the attention of Principal auditor any significant finding.
- Compliance with relevant statutory requirements.
- Respond to detailed questionnaire.
Reporting Considerations:
1. When the principal auditor concludes, based on his procedures, that the work of the other auditor cannot be used,
2. The principal auditor has not been able to perform sufficient additional procedures regarding the financial information of the component audited by the other auditor, and
3. The principal auditor should express a qualified opinion or disclaimer of opinion because there is a limitation on the scope of audit.
Question 94.
ABC Ltd. is a company incorporated in India. It has branches within and outside India. Explain who can be appointed as an auditor of these branches within and outside India. Also explain to whom branch auditor is required to report. [RTP-May 20]
Answer:
Branch Auditor:
Sec. 143(8) of the Companies Act, 2013, prescribes the duties and powers of the company’s auditor with reference to the audit of the branch and the branch auditor. Accordingly, where a company has a branch office, the accounts of that office shall be audited by either of following:
- the auditor appointed for the company, i.e. company auditor, or
- any other person qualified for appointment as an auditor of the company under this Act, or
- where the branch office is situated in a country outside India, the accounts of the branch office shall be audited either by the company’s auditor or by an accountant or by any other person duly qualified to act as an auditor of the accounts of the branch office in accordance with the laws of that country.
The branch auditor shall prepare a report on the accounts of the branch examined by him and send it to the auditor of the company who shall deal with it in his report in such manner as he considers necessary.
Rule 12 of the Companies (Audit and Auditors) Rules, 2014, provides the following in relation to branch audit and branch auditor:
1. The duties and powers of the company’s auditor with reference to the audit of the branch and the branch auditor, if any, shall be as contained in sub-sections (1) to (4) of section 143.
2. The branch auditor shall submit his report to the company’s auditor.
Question 95.
RJ Limited is in the business of trading of cycles having Head Office at Delhi and branch at Mumbai. Statutory audit of Head Office was to be done by CA. D and statutory audit of branch at Mumbai was to be done by CA. M. During the course of audit by CA. D at head office, CA. D wanted to visit branch at Mumbai and verily the inventory records at Mumbai. The management of RJ Limited did not allow CA. D to visit Mumbai office and verify the inventory records as the branch audit of Mumbai was already being undertaken by another CA. M. In the above situation, discuss the rights available with CA. D in terms of the Companies Act, 2013. [Nov. 20 (3 Marks)]
Answer:
Right of Access of Company Auditor for Branch Records:
- As per Sec. 143(8) of the Companies Act, 2013 the audit of the branches can be done by the company auditor himself or by another auditor. Even where, the branch accounts are audited, the company auditor has right to visit the branch if he deems it necessary to do so for the performance of his duties as auditor.
- Company Auditor has also right of access at all times to the books and accounts and vouchers of the company maintained at the branch office. He can appropriately deal with the report of the branch auditor in framing his main report. He will disclose how he had dealt with the branch audit report.
- In this case, the audits of two branches were done by the company auditor and one branch was done by a separate branch auditor.
Conclusion: Management’s objection that the company auditor is transgressing the scope of audit areas agreed, is absolutely, wrong. The right of company auditor in visiting and accessing the records of branch cannot be forfeited. Even where the branch accounts are audited by another local auditor, the company auditor has right to visit the branch and can have access to the books and vouchers of the company maintained at the branch office.
Question 96.
Briefly discuss the following with respect to applicable provisions under the Companies Act, 2013 and rules made thereunder:
(a) Maintenance of Cost Records
(b) Applicability of Cost Audit
(c) Non-applicability of Cost Audit.
Answer:
Cost Records and Audit Provisions:
(a) Maintenance of Cost records: Sec. 148(1) of Companies Act, 2013 provides that the Central Government may, by order, in respect of such class of companies engaged in the production of such goods or providing such services as may be prescribed, direct that particulars relating to the utilisation of material or labour or to other items of cost as may be prescribed shall also be included in the books of account kept by that class of companies.
Rule 3 of Companies (Cost Records and Audit) Rules, 2014 provides that the specified class of companies, including foreign companies, engaged in the production of the goods or providing services, having an overall turnover from all its products and services of ₹ 35 Cr. or more during the immediately preceding financial year, shall include cost records for such products or services in their books of account.
A company which is classified as a micro enterprise or a small enterprise under the Micro, Small and Medium Enterprises Development Act, 2006 are exempted from compliance of these provisions.
Specified Class of Companies are classified in two categories:
1. Regulated Sectors: It covers Telecommunication, Electricity, Petroleum and Gas, Drugs and Pharma, Fertilizers and Sugar
2. Non-Regulated Sectors: It includes a number of companies including those engaged in Arms and ammunitions, Steel, Rubber and Allied products, Coffee, tea, Cement etc.
(b) Applicability of Cost Audit:
Section 148(2) of Companies Act, 2013 provides that if the Central Government is of the opinion, that it is necessary to do so, it may, by order, direct that the audit of cost records of class of companies, which are covered under Sec. 148(1) and which have a net worth of such amount as may be prescribed or a turnover of such amount as may be prescribed, shall be conducted in the manner specified in the order.
Rule 4 of Companies (Cost Records and Audit) Rules, 2014 provides the following:
Regulated Sector Industries: Cost records are required to be audited if the overall annual turnover of the company from all its products and services during the immediately preceding financial year is ₹ 5 0 Cr. or more and the aggregate turnover of the individual product or products or service or services for which cost records are required to be maintained under rule 3 is ₹ 25 Cr. or more.
Non-Regulated Sectors: Cost records are required to be audited if the overall annual turnover of the company from all its products and services during the immediately preceding financial year is ₹ 100 Cr. or more and the aggregate turnover of the individual product or products or service or services for which cost records are required to be maintained under rule 3 is ₹ 35 Cr. or more.
(c) Non-Applicability of Cost Audit:
The requirement for cost audit under these rules shall not apply to a company which is covered in rule 3; and
(i) whose revenue from exports, in foreign exchange, exceeds seventy five per cent of its total revenue; or
(ii) which is operating from a special economic zone.
Question 97.
Elucidate the provisions of Companies Act, 2013 relating to submission of cost audit report to the Board and Central Government.
Answer:
Submission of Cost Audit report:
- Every cost auditor, who conducts an audit of the cost records of a company, shall submit the cost audit report along with his or its reservations or qualifications or observations or suggestions, if any, in Form CRA-3.
- Every cost auditor shall forward his duly signed report to the Board of Directors of the company within a period of 180 days from the closure of the financial year to which the report relates and the Board of Directors shall consider and examine such report particularly any reservation or qualification contained therein.
- Every company covered under these rules shall, within a period of thirty days from the date of receipt of a copy of the cost audit report, furnish the Central Government with such report along with full information and explanation on every reservation or qualification contained therein, in Form CRA-4 in XBRL format in specified manner along with specified fees.
Question 98.
Write short note on: Cost Audit. [May 05 (4 Marks)]
Answer:
Cost Audit:
- Section 148(2) of Companies Act, 2013 provides that if the Central Government is of the opinion, that it is necessary to do so, it may, by order, direct that the audit of cost records of class of companies, which are covered under Sec. 148(1) and which have a net worth of such amount as may be prescribed or a turnover of such amount as may be prescribed, shall be conducted in the manner specified in the order. The audit conducted under this section shall be in addition to the audit conducted under section 143 of the Companies Act, 2013.
- The audit shall be conducted by a Cost Accountant in Practice who shall be appointed by the Board of such remuneration as may be determined by the members in such manner as may be prescribed. No person appointed under section 139 as an auditor of the company shall be appointed for conducting the audit of cost records.
- The auditor conducting the cost audit shall comply with the cost auditing standards.
- The report on the audit of cost records shall be submitted to the Board of Directors of the company and company shall within 30 days from the date of receipt of a copy of the cost audit report prepared furnish the Central Government with such report along with full information and explanation on every reservation or qualification contained therein.
Question 99.
“Mr. A is offered by ABC Ltd. for appointment as cost auditor and asked to certify certain requirements before such appointment.” Discuss those requirements with reference to the provisions of the Companies Act, 2013. [Nov. 18 (5 Marks)]
Answer:
Requirements as to Certificate from Cost Auditor:
As per Rule 6 of the Companies (Cost Records and Audit) Rules, 2014, the Cost Auditor appointed
shall submit certificate that-
(a) the individual or the firm, as the case may be, is eligible for appointment and is not disqualified for appointment under the Act, the Cost and Works Accountants Act, 1959 and the Rules or regulations made thereunder.
(b) the individual or the firm, as the case may be, satisfies the criteria provided in Sec. 141, so far as may be applicable.
(c) the proposed amendment is within the limits laid down by or under the authority of the Act.
(d) the list of proceedings against the cost auditor or audit firm or any partner of the audit firm pending with respect to professional matters of conduct, as disclosed in the certificate, is true and correct.
Objective Type Questions – Correct/Incorrect
Question 1.
Where at any AGM, no auditor is appointed or re-appointed, the existing auditor shall continue be the auditor of the company.
Answer:
Statement is correct.
- As per section 139(10) of the Companies Act, 2013, where at any AGM, no auditor is appointed or re-appointed, the existing auditor shall continue to be the auditor of the company.
Question 2.
If the auditor appointed at the AGM refuses to accept the same, the Company can appoint another person by holding General Meeting. [May 07 (2 Marks)]
Answer:
Statement is incorrect:
- If the auditor appointed at the AGM refuses to accept the same, it will be held that no auditor is appointed at the AGM.
- Sec. 139(10) of Companies Act, 2013 will apply which provides that if no auditor is appointed at AGM, the existing auditor will continue to be the auditor of the company.
Question 3.
Government companies are also to be considered for the ceiling on number of audits. [Nov. 07 (2 Marks)]
Answer:
Statement is correct. Section 141(3)(g) of Companies Act, 2013 provides that a person is not eligible to be appointed as auditor of a company if he is in full time employment elsewhere or a person or a partner of a firm holding appointment as its auditor, if such persons or partner is at the date of such appointment or reappointment holding appointment as auditor of more than 20 Companies other than one person company, dormant companies, small companies and private companies having paid up share capital less than 100 Crores.
Question 4.
If appointment of a person as an auditor is void-ab-initio, it should be treated as a casual vacancy. [Nov. 07 (2 Marks)]
Answer:
Statement is incorrect.
- If appointment of a person as an auditor is void-ab-initio, it should not be treated as a casual vacancy.
- Sec. 139(10) of Companies Act, 2013 will apply which provides that if no auditor is appointed at AGM, the existing auditor will continue to be the auditor of the company.
Question 5.
An auditor can be appointed as first auditor of a newly formed company simply because his name has been stated in the Articles of Association. [May 08 (2 Marks)]
Answer:
Statement is incorrect.
- Section 139(6) of the Companies Act, 2013 lays down that “the first auditor or auditors of a company shall be appointedby the Board of directors within 30 days from the date of registration of the company”.
- In the case of failure of the Board to appoint first auditor, it shall inform the members of the company, who shall within 90 days at an EGM shall appoint the auditor.
Question 6.
C.A. Mr. X is the Auditor of PQ Ltd. in which one of his relative is having substantial interest, whether Mr. X is qualified to be an Auditor₹ [Nov. 08 (2 Marks)]
Answer:
Statement is incorrect.
- Sec. 141 disqualifies a person to be appointed as auditor if he or his relative or his partner is holding any security in the company. However relative may hold securities of face value not exceeding ₹ 1 Lac. Assuming that the interest of the relative exceeds face value of ₹ 1 Lac, Mr. X is disqualified.
- Further as per provisions of Chartered Accountant Act, 1949, a CA will be considered as guilty of professional misconduct if he expresses any opinion on the financial statements of an entity in which he or his partner or his relative has substantial interest.
Question 7.
An Auditor may be removed from Office before the expiry of his term, by the company in General Meeting. [Nov. 08 (2 Marks)]
or
The first auditor appointed by the board of directors can be removed by the board at its subsequent meeting. [Nov. 07 (2 Marks)]
Answer:
Statement is incorrect.
- As per Sec. 140(1) of the Companies Act, 2013, an auditor appointed u/s 139 may be removed from his office before the expiry of his term only by a special resolution of the company, after obtaining the prior approval of the Central Government.
- For this purpose, an application to the Central Government for removal of auditor shall be made in Form ADT-2 and shall be accompanied with prescribed fees.
- The application shall be made to the Central Government within thirty days of the resolution passed by the Board.
Question 8.
An auditor of a company in which not less than 25% of authorized capital is held by public financial institution is to be appointed by a special resolution in general meeting. [June 09 (2 Marks)]
Answer:
Statement is incorrect.
- There is no special provision under the Companies Act, 2013, as to the requirement of special resolution for appointment of auditor of a company in which not less than 25% of authorized capital is held by public financial institution.
- Appointment will be made as per the requirement of section 139(1) of Companies Act, 2013, which does not require any special resolution.
Question 9.
While conducting audit of Government Companies, the auditors are paid their Professional Fees as prescribed by the Government. [May 10 (2 Marks)]
Answer:
Statement is incorrect.
As per sec. 142(1) of the Companies Act, 2013, the fees of auditors of a company is fixed by the company in its general meeting or in such a manner as the company in general meeting may determine.
Question 10.
Audit Committee is to be formed by each and every company and the auditor has no compulsion to attend the meeting of the Audit Committee. [May 10 (2 Mhrks)]
Answer:
Statement is incorrect.
- As per sec. 177 of the Companies Act, 2013 Audit committee is to be formed by every listed companies, all public companies with a paid up capital of ₹ 10 Cr. or more, all public companies having turnover of ₹ 100 Cr. or more, all public companies having in aggregate, outstanding loans or borrowings or debentures or deposits exceeding ₹ 50 Cr. or more.
- Further, the Auditor shall have the right to be heard in the meetings of the Audit Committee when it considers the Auditor’s Report but shall not have the right to vote.
Question 11.
The auditor should study the Memorandum and Articles of Association to see the validity of his appointment. [May 10. Nov. 15 (2 Marks)]
Answer:
Statement is incorrect.
- Memorandum of Association lays down the object to be carried on and Articles of Associations reflects the regulations of the company to govern its internal management and to regulate the rights of the members.
- Auditor should ascertain whether the company has complied with provisions of sections 139 and 140 to ensure validity of his appointment.
Question 12.
A casual vacancy caused by resignation of the auditor can be filled by the Board of Directors. [Nov. 09 (2 Marks)]
Answer:
Statement is incorrect.
- As per sec. 139(8) of Companies Act, 2013, casual vacancy caused by the resignation of an auditor cannot be filled in by the Board of Directors itself.
- Such appointment shall also be approved by the company at general meeting convened within three months of the recommendation of the board and the auditor so appointed shall hold office till the conclusion of the next annual general meeting.
Question 13.
Comment on the following: AGM is not held in time, auditor automatically vacates his office. [May 13 (2 Marks)]
Answer:
Statement is false.
- Section 139(1) of Companies Act, 2013 provides that an auditor is appointed for a particular period, i.e., from conclusion of one AGM until conclusion of the 6th AGM subject to ratification of such appointment at every AGM.
- In case the AGM is not held within the period prescribed, the auditor will continue in office till the AGM is actually held and concluded.
- Therefore, auditor shall continue to hold office till the conclusion of the AGM. Auditor’s office is not vacated automatically if AGM is not held in time.
Question 14.
Rajat, an Auditor recovers his fees on progressive basis is said to be indebted to the company. [Nov. 13 (2 Marks)]
Answer:
Statement is incorrect.
- If the auditor recovers fees from the company on a progressive basis, even though the audit has not been completed he cannot be said to be indebted to the company.
- Only when the auditor recovers the fees as an advance, he will be said to be indebted to the company and attracts disqualification u/s 141(3)(d)(z7) of Companies Act, 2013.
Question 15.
The first auditor of PQR Ltd., a Government Company was appointed by the board of directors of company. fNov. 13 (2 Marks)!
Answer:
Statement is incorrect.
- Sec. 139(7] of the Companies Act, 2013 provides that the first auditor of a Government Company shall be appointed by the CAG.
- Board of Directors appoints first auditors in case of other companies as per sec. 139(6] of Companies Act, 2013.
Question 16.
Mr. ‘R’, a practicing Chartered Accountant, is appointed as a “Tax Consultant” of MN Ltd., in which his father Mr. ‘C is the managing director. [Nov. 13 (2 Marks]]
Answer:
Appointment is valid.
- A member of the ICAI will be held guilty of professional misconduct if he or partner of his firm or their relatives hold substantial interest in an enterprise and he expresses his opinion on the F.S. of such enterprise.
- In this case, Mr. R is a “Tax Consultant” and not a “Statutory Auditor” of ABC Ltd., hence he is not disqualified to be appointed as tax consultant.
Question 17.
Audit of Private Limited Companies are to be excluded while calculating ceiling on number of audits. [Nov. 13 (2 Marks)]
Answer:
Statement is incorrect.
- Sec. 141 (3]Cg] of Companies Act, 2013 does not exclude audit of private limited companies while calculating ceiling on number of audits.
Question 18.
The Board of Directors can fill the casual vacancy caused by resignation of an auditor, who shall hold office until the conclusion of the next AGM. [May 14 (2 Marks)]
Answer:
Statement is incorrect.
- As per sec. 139(8] of Companies Act, 2013, casual vacancy caused by the resignation of an auditor cannot be filled in by the Board of Directors itself.
- Such appointment shall also be approved by the company at general meeting convened within three months of the recommendation of the board and the auditor so appointed shall hold office till the conclusion of the next annual general meeting.
Question 19.
The first Auditor is generally appointed by the company at a General Meeting. [Nov. 14(2 Marks)]
Answer:
Statement is incorrect:
- As per section 139(6) of the Companies Act, 2013, the first auditor(s) of a company shall be appointed by the Board of Directors within 30 days from the date of registration of the company.
- General Meeting is authorized to appoint the subsequent auditor u/s 139(1).
Question 20.
The first auditor of a Government Company was appointed by the Board in its meeting after 10 days from the date of registration. [May 15 (2 Marks)]
Answer:
Statement is incorrect.
- As per section 139(7] of the Companies Act, 2013, the first auditor of a government company shall be appointed by the Comptroller and Auditor-General of India within 60 days from the date of registration of the company.
- If CAG does not appoint the first auditor within 60 days, the Board shall appoint in next 30 days.
Question 21.
Director’s relative can act as an auditor of the company. [May 15 (2 Marks)]
Answer:
Statement is incorrect:
As per section 141(3) of the Companies Act, 2013, a person shall not be eligible for appointment as an auditor of a company whose relative is a Director or is in the employment of the Company as a director or key Managerial Personnel.
Question 22.
If an LLP (Limited Liability Partnership Firm) is appointed as an auditor of a company, every partner of a firm shall be authorized to act as an auditor. [May 15 (2 Marks)]
Answer:
Statement is incorrect:
As per section 141(2) of the Companies Act, 2013, where a firm including a limited liability partnership (LLP) is appointed as an auditor of a company, only the partners who are Chartered Accountants shall be authorised to act and sign on behalf of the firm.
Question 23.
AB & Co. is an audit firm having partners Mr. A and Mr. B Mr. C, the relative of Mr. B is holding se-curities having face value of₹ 2,00,000 in XYZ Ltd. AB & Co. is qualified for an auditor of XYZ Ltd. [Nov. 15 (2 Marks)]
Answer:
Statement is incorrect.
- Sec. 141(3)(d)(i) of the Companies Act, 2013, disqualifies a person to be appointed as auditor of a company if the person or his relative or his partner is holding securities in the company. However Relative may hold securities of face value up to ₹ 1,00,000.
- AB & Co. is disqualified to be appointed as auditor of XYZ Ltd. as relative of Mr. B, the partner of the AB & Co. is holding securities of face value of₹ 2,00,000.
Question 24.
Manner of rotation of auditor will not be applicable to company A, which is having paid up share capital of ₹ 15 crores and having public borrowing from nationalized bank of ₹ 50 crore because it is a Private Limited Company. [Nov. 15 (2 Marks), RTP-May 18]
Answer:
Statement is incorrect.
- Provisions related with rotation of auditors are applicable in case of private companies having paid up capital of ₹ 20 Crore or more and to companies having paid up capital below ₹ 20 Crore, but having public borrowings from financial institutions, banks or public deposits of ₹ 5 0 Crore or More.
- In the instant case, as borrowings is of ₹ 50 Crore, provisions related with rotation of auditors are applicable.
Question 25.
Managing director of A Ltd. himself appointed the first auditor of the company. [Nov. 15 (2 Marks), MTP-Oct. 19]
Or
Managing Director of Pigeon Ltd. himself wants to appoint CA. Champ, a practicing Chartered Accountant, as first auditor of the company. [MTP-May 20]
Answer:
Statement is incorrect.
- Sec. 139(6) of Companies Act, 2013 provides that the first auditor of the company is to be appointed by the Board of Directors within 30 days of registration of the company. If the Board fails, members shall within 90 days appoint the auditor in EGM. In case of Government company, the first auditor is to be appointed by CAG of India.
- Appointment of first auditor by the managing director is not correct.
Question 26.
A Chartered Accountant holding securities of S Ltd. having face value of ₹ 950 is qualified for appointment as an auditor of S Ltd. [Nov. 15 (2 Marks)]
Answer:
Statement is incorrect.
- Sec. 141(3)(d)(z) of the Companies Act, 2013, disqualifies a person to be appointed as auditor of a company if the person or his relative or his partner is holding securities in the company.
Chartered accountant is disqualified to be appointed as auditorofS Ltd. as he is holding securities of face value of ₹ 950.
Question 27.
Mr. N, a member of the Institute of Chartered Accountant of England and Wales, is qualified to be appointed as auditor of Indian Companies. [Nov. 15 (2 Marks)]
Answer:
Statement is incorrect.
- As per Section 141(1) of Companies Act, 2013, a person shall be eligible to be appointed as auditor of an Indian company only if he is a Chartered Accountant. Chartered Accountant implies the member of Institute of Chartered Accountant of India holding certificate of practice.
- Mr. N, member of Institute of Chartered Accountant of England and Wales is disqualified to be appointed as auditor of Indian companies.
Question 28.
The first auditors of a Government Company were appointed by the Board of Directors. [May 16 (2 Marks))
Answer:
Statement is incorrect.
- Section 139(7) of the Companies Act, 2013 lays down that in the case of a Government company the first auditor shall be appointed by the CAG of India within 60 days of registration of the company.
- In case the CAG of India does not appoint such auditor within the said period, the BOD of the company shall appoint such auditor within the next 30 days.
- In the case of failure of the Board to appoint such auditor within the next 30 days, it shall inform the members of the company who shall appoint such auditor within the 60 days at an EGM.
Question 29.
Mr. Pawan, a practicing Chartered Accountant, is appointed as “Tax-Consultant” of ABC Ltd., in which his father. Mr. Singh is Managing Director. [May 16 (2 Marks)]
Answer:
Statement is correct.
- Sec. 141(3)(f) of Companies Act, 2013 disqualifies a person to be appointed as auditor whose relative is a director or is in employment of the company as a director or key managerial personnel.
- However no such disqualification is prescribed under the law for appointing a person as a tax consultant, therefore sec. 141(3)(f) will not be attracted.
- Mr. Pawan can be appointed as a tax consultant irrespective that his father is the managing director of the company.
Question 30.
Central Government permission is required when auditors are to be removed before expiry of their term, but not so when auditors are changed after expiry of their term. [Nov. 16 (2 Marks)]
Answer:
Statement is correct.
Removal of auditor before expiry of his term is a serious matter and may adversely affect his independence. Hence, the permission of the Central Government is required when auditors are removed before expiry of their term and the same is not needed when they are not re-appointed after expiry of their term.
Chartered accountant is disqualified to be appointed as auditor of S Ltd. as he is holding securities of face value of₹ 950.
Question 31.
If the Board of Directors fails to appoint the first auditor in case of a company other than a Govern- | ment Company, then the Central Government shall appoint the auditor. [May 17 (2 Marks)]
Answer:
Statement is incorrect.
As per section 139(6) of Companies Act, 2013, in case of non-government companies, if Board fails to appoint the first auditor, it shall inform the members of the company, who shall within 90 days at an EGM shall appoint the auditor.
Question 32.
If LLP is appointed as an auditor of a company, every partner of a firm shall be authorized to act as an auditor. [RTP-May 18]
Answer:
Statement is incorrect.
As per section 141(2) of the Companies Act, 2013, where a firm including LLP is appointed as an auditor of a company, only the partners who are Chartered Accountants shall be authorised to act and sign on behalf of the firm.
Question 33.
PQR & CO., Chartered Accountants, resigned from the audit of a government company and filed the resignation with the company and the registrar within 30 days. Comment, whether PQR & CO. has complied with the provisions of the Companies Act, 2013. [May 18 (2 Marks), MTP-April 19]
Answer:
Statement is incorrect.
As per Sec. 140(2) of Companies Act, 2013, in case of Govt, companies or Govt, owned/controlled companies, the auditor shall also file statement of resignation with the Comptroller and Auditor General of India, indicating the reasons and other facts as may be relevant with regard to his resignation.
Question 34.
K Ltd., a non-government company, was incorporated on 01.10.2017. Mr. B, managing Director of K Ltd., himself appointed the first auditor of the company on 31.12.2017. [May 18 (2 Marks)]
Answer:
Statement is incorrect.
- AsperSec. 139(6) of Companies Act, 2013, the first auditor of a company, other than a Government company, shall be appointed by the Board of Directors. The appointment shall be made within 30 days from the date of registration of the company.
- In the case of failure of the Board to appoint first auditor, it shall inform the members of the company, who shall within 90 days at an EGM shall appoint the auditor.
Question 35.
The Board of Director of ABC Ltd., a listed company at Bombay Stock Exchange, is required to fill the casual vacancy of an auditor only after taking into account the recommendations of the audit committee. [Nov. 18 (2 Marks)]
Answer:
Statement is correct:
As per Sec. 139(11) of Companies Act, 2013, where a company is required to constitute an Audit Committee u/s 177, all appointments, including the filling of a casual vacancy of an auditor under Sec. 139 shall be made after taking into account the recommendations of such committee.
Question 36.
Any partner of an LLP, who is appointed as an auditor of a company, can sign the audit report. [Nov. 18 (2 Marks)]
Answer:
Statement is incorrect.
As per Sec. 141(2) of Companies Act, 2013, where a firm including a LLP is appointed as an auditor of a company, only the partners who are CA shall be authorised to act and sign on behalf of the firm.
Question 37.
Where the firm of appointed as an auditor of the entity the audit report is signed only in the name of audit firm. [May 19 (2 Marks)]
Answer:
Statement is incorrect.
- AsperSec. 145 of the Companies Act, 2013, the person appointed as an auditor of the company shall sign the auditor’s report or sign or certify any other document of the company, in accordance with the provisions of section 141(2). Sec. 141(2) of the Companies Act, 2013 states that where a firm including a LLP is appointed as an auditor of a company, only the partners who are chartered accountants shall be authorised to act and sign on behalf of the firm.
- As per SA 700 “Forming an Opinion and Reporting on Financial Statements” where the firm is appointed as the auditor, the report is signed in the personal name of the auditor and in the name of the audit firm.
Question 38.
Bhartiya Gas Ltd. a Government Company, the Comptroller and Auditor-General of India shall, in respect of a financial year, appoint an auditor duly qualified to be appointed as an auditor of companies under this Act, within a period of 180 days from the end of the financial year, who shall hold office till the end of the next financial year. [May 19 (2 Marks)]
Answer:
Statement is incorrect.
In the case of a Government company, the Comptroller and Auditor-General of India shall, in respect of a financial year, appoint an auditor duly qualified to be appointed as an auditor of companies under this Act, within a period of 180 days from the commencement of the financial year, who shall hold office till the conclusion of the annual general meeting.
Question 39.
As per Section 139(6), the first auditor of a company, including a Government company, shall be appointed by the Board of Directors within 60 days from the date of registration of the company. [RTP-Nov. 19]
Answer:
Statement is incorrect.
As per Sec. 139(6) of the Companies Act, 2013, the first auditor of a company, other than a Government company, shall be appointed by the Board of Directors within 30 days from the date of registration of the company.
Question 40.
As per section 140(2) of the Act, the auditor who has resigned from the company need not inform the Registrar of Companies. [RTP-Nov. 19]
Answer:
Statement is incorrect.
As per Sec. 140(2) of the Companies Act, 2013, the auditor who has resigned from the company shall file within a period of 30 days from the date of resignation, a statement in the prescribed Form ADT-3 (as per Rule 8 of CAAR) with the company and the Registrar.
Question 41.
CA. K has resigned as auditor, after 2 months from appointment of NML Ltd. He needs to file ADT-3 with the Registrar within 60 days from the date of resignation. [Nov. 19 (2 Marks)]
Answer:
Statement is incorrect.
As per Sec. 140(2) of the Companies Act, 2013, the auditor who has resigned from the company shall file within a period of 30 days from the date of resignation, a statement in the Form ADT-3 with the company and the Registrar.
Question 42.
All public companies, having in aggregate, outstanding loans or borrowings or debentures or deposits exceeding hundred crore rupees or more shall constitute an Audit Committee. [RTP-May 20]
Answer:
Statement is incorrect.
As per Sec. 177 of Companies Act, 2013, all public companies, having in aggregate, outstanding loans or borrowings or debentures or deposits exceeding fifty crore rupees or more shall constitute an Audit Committee.
Question 43.
According to Section 140(1), the auditor appointed under section 139 may be removed from his office before the expiry of his term only by a general resolution of the company. [RTP-May 20]
Answer:
Statement is incorrect.
As per Sec. 140(1), the auditor appointed u/s 139 may be removed from his office before the expiry of his term only by a special resolution of the company, after obtaining the previous approval of the Central Government in that behalf as per Rule 7 of CAAR, 2014.
Question 44.
As per sub-section (5) of the section 140, the Tribunal cannot direct the company to change its auditors. [RTP-May 20]
Answer:
Statement is incorrect.
As per Sec. 140(5), the Tribunal either suo motu or on an application made to it by the Central Government or by any person concerned, if it is satisfied that the auditor of a company has, whether directly or indirectly, acted in a fraudulent manner or abetted or colluded in any fraud by, or in relation to, the company or its directors or officers, it may, by order, direct the company to change its auditors.
Question 45.
Audit committee is to be constituted by every public company to ensure better standards of corporate governance. [MTP-Oct. 20]
Answer:
Statement is incorrect.
As per Sec. 177 of Companies Act, 2013 audit committee is to be constituted by every listed public company and following classes of public companies only:
- the Public Companies having paid up share capital of₹ 10 crore or more; or
- the Public Companies having turnover of ₹ 100 crore; or
- the Public Companies which have, in aggregate, outstanding loans, debentures and deposits, exceeding ₹ 50 crore.
Question 46.
The term “relative”, as defined under the Companies Act, 2013, means anyone who is closely related to another. [RTP-Nov. 20]
Answer:
Statement is incorrect.
The term “relative”, as defined under the Companies Act, 2013, means anyone who is related to another as members of a Hindu Undivided Family; husband and wife; Father (including step- father), Mother (including step-mother), Son (including step-son), Son’s wife, Daughter, Daughter’s husband, Brother (including step-brother), Sister (including step-sister).
Question 47.
According to Section 140(1), the auditor appointed under section 139 may be removed from his office before the expiry of his term only by passing a Board resolution. [RTP-Nov. 20]
Answer:
Statement is incorrect.
According to Section 140(1), the auditor appointed under section 139 may be removed from his office before the expiry of his term only by a special resolution of the company, after obtaining the previous approval of the Central Government in that behalf as per Rule 7 of CAAR, 2014
Question 48.
Auditor’s lien on his client’s books and record is not unconditional. [May 07 (2 Marks)]
Answer:
Statement is correct.
Auditor’s lien is subject to following conditions:
- Documents must belong to the client who owes the money.
- These documents must come to the possession of the auditor on the client’s authority.
- The auditor can retain such documents, only if he has done work on such documents, on which fees have not been paid.
Question 49.
The auditor of a company is entitled to attend any General Meeting of the company as his duty. [Nov. 08 (2 Marks)]
Answer:
Statement is correct.
Section 146 of the Companies Act, 2013 requires the auditor of a company to attend either by himself or through his qualified authorised representative to attend the general meeting, unless exempted. Company is required to forward all notices and other communications relating to any general meeting of a company to the auditor.
Auditor shall have right to be heard at such meeting on any part of the business which concerns him as an auditor.
Question 50
Mr. X, a Chartered Accountant, is an employee of M/s M & N Co., a firm of Chartered Accountants of India. The firm is the Auditors of ABC & Co. Ltd. After auditing the accounts of the Company the Auditor firm allowed Mr. X, their employee, to sign the audit report which he did. [Nov. 09 (2 Marks)]
Answer:
Statement is incorrect.
- An employee Chartered Accountant cannot sign the auditor’s report on behalf of the auditing firm.
- Only a partner in the firm can sign the audit report in compliance with the provisions of sec. 145 read with section 141(2) of the Companies Act, 2013.
Question 51.
It is the responsibility of the Auditor to ensure that statement of profit and Loss and Balance Sheet of the company shall comply with the Accounting Standards. [Nov. 14 (2 Marks)]
Answer:
Statement is incorrect:
- As per section 143(3) of Companies Act, 2013, it is the duty of the auditor to report whether, in his opinion, the financial statements comply with the accounting standards.
- To ensure that statement of profit and loss and balance sheet of the company comply with the accounting standards is the responsibility of the company.
Question 52
C&AG orders to conduct test audit of the accounts of a Government company. [May 15 (2 Marks)]
Answer:
Statement is correct.
As per Sec. 143(7) of Companies Act, 2013, CAG may in case of government company, if he considers necessary, by an order cause test audit to be conducted of the accounts of such company.
Question 53.
The auditor of A Ltd. Company wanted to refer to the minute books during audit but boards of directors refused to show the minute books to the auditors. [Nov. 15 (2 Marks)]
Answer:
Statement is incorrect.
- Sec. 141(3) of Companies Act, 2013 provides that every auditor of a company shall have a right of access at all times to the books of account and vouchers of the company, whether kept at the registered office of the company or at any other place.
- The term ‘books of account and vouchers’ includes all books which have any bearing, or are likely to have any bearing on the accounts, whether these be the usual financial books or the statutory or statistical books.
Question 54.
The auditor has to report to Central Govt, within 90 days of his knowledge of an offence involving fraud. [Nov. 15 (2 Marks)]
Answer:
Statement is incorrect.
- Sec. 141(12) of Companies Act, 2013 provides that if an auditor of a company, in the course of the performance of his duties as auditor, has reason to believe that an offence of fraud which involves an amount of ₹ 1 Cr. or above is being or has been committed against the company by officers or employees of the company, he shall report the matter to the CG.
- Rule 13 of Companies [Audit and Auditor’s) Rules, 2014 provides that auditor shall report to the Board or the Audit Committee immediately but not later than 2 days of his knowledge of fraud, seeking their reply within 45 days.
- On receipt of reply, he shall forward his report to the Central Government within 15 days from the receipt of such reply.
Question 55.
The members of XYZ Ltd. preferred a complaint against the auditor stating that he has failed to send the auditor’s report to them. [May 16 (2 Marks)]
Answer:
Statement is incorrect.
- Section 143 of the Companies Act, 2013 lays down the powers and duties of auditor. As per provisions of the law, it is no part of the auditor’s duty to send a copy of his report to members of the company.
- In case of Allen Graig and Company [London) Ltd., it was held that duty of the auditor after having signed the report to be annexed to a balance sheet is confined only to forwarding that report to the secretary of the company. It will be for the secretary or the director to convene a general meeting and send the balance sheet and report to the members [or other person) entitled to receive it.
Question 56.
Auditor’s right of lien is unconditional. [Nov. 16 [2 Marks)]
Answer:
Statement is not correct.
Auditor’s lien is subject to following conditions:
- Documents must belong to the client who owes the money.
- These documents must come to the possession of the auditor on the client’s authority.
- The auditor can retain such documents, only if he has done work on such documents, on which fees have not been paid.
Question 57.
Fraud against the company shall be reported by the auditor to the Central Government within 45 days of his knowledge, [May 17 (2 Marks)]
Answer:
Statement is incorrect.
- As per Rule 13 of Companies [Audit & Auditor’s) Rules, 2014, the auditor shall report the fraud to the CG within 15 days of reply received from the Board or Audit Committee, as the case may be.
- In case auditor does not receive any reply within the stipulated period of 45 days, he shall forward his report to the CG within next 15 days.
Question 58.
The auditor has to report under section 143 of Companies Act, 2013whether company has adequate internal controls in place and overall effectiveness of such internal controls. [MTP-Oct. 20]
Answer:
Statement is incorrect.
- As per Sec. 143 of the Companies Act, 2013, auditor has to report whether the company has adequate internal financial controls with reference to financial statements in place and operating effectiveness of such controls.
- The auditor has to report on adequacy and effectiveness of internal financial controls only and not internal controls.
Question 59.
CARO, 2020 does not apply to a foreign company. [May 13 (2 Marks)]
Answer:
Statement is incorrect.
CARO, 2020 applies to all companies including foreign companies except Banking, Insurance, Sec. 8 Companies, One Person Company, Small Companies and Private Ltd, companies subject to certain conditions.
Question 60.
CARO, 2020 shall not apply to a Private Limited Company whose paid up capital and reserves are not more than ₹ 50 Lacs. [May 14 (2 Marks)]
Answer:
Statement is correct.
CARO, 2020 is not applicable over a private limited company, not being a subsidiary or holding of a public company, if following conditions are satisfied:
- having a Paid up capital & Reserves & Surplus not more than ₹ 1 Cr. as on the balance sheet date, and
- which does not have total borrowings exceeding ₹ 1 Cr. from any bank or financial institution at any point of time during the financial year, and
- which does not have a total revenue as disclosed in Schedule III to the Companies Act, 2013 (including revenue from discontinuing operations) exceeding ₹₹0 Cr. during the financial year as per the financial statements.
Question 61.
Provisions of Companies (Auditor’s Report) Order, 2020, apply to clubs, chambers of commerce, research institutes etc., which have been established under section 8 of the Companies Act, 2013. [Nov. 09 (2 Marks)]
Answer:
Statement is Incorrect.
CARO, 2020 applies to all companies including foreign companies except Banking, Insurance, sec. 8 Companies, One Person Company, Small Companies and Private Ltd. companies subject to certain conditions.
Question 62.
CARO 2020 is also applicable to the audit of branch of a company, except where the company is exempt from the applicability of the order.
Answer:
Statement is correct.
Provisions of CARO are equally applicable in case of branches also, because under sec. 143(8), a branch auditor has same duties as of company auditor.
Question 63.
Provision of CARO, 2020 is not applicable to ABC Pvt. Ltd., a subsidiary of XYZ Ltd. (a public company) having fully paid Capital and Reserves & Surplus of ₹ 50 lakhs, Secured loan from bank of ₹ 90 Lakhs and Turnover of ₹ 5 Crore, for the financial year 2020-21. [Nov. 19 (2 Marks)]
Answer:
Statement is incorrect.
CARO, 2020 is not applicable over a private limited company, not being a subsidiary or holding of a public company, if following conditions are satisfied:
- having a paid-up capital & Reserves & Surplus not more than ₹ 1 Cr. as on the balance sheet date, and
- which does not have total borrowings exceeding ₹ 1 Cr. from any bank or financial institution at any point of time during the financial year, and
- which does not have a total revenue as disclosed in Schedule III to the Companies Act, 2013 (including revenue from discontinuing operations) exceeding ₹ 10 Cr. during the financial year as per the financial statements.
In this case, CARO is applicable as ABC Pvt. Ltd is a subsidiary of another public company.
Question 64.
Internal auditor of the company cannot also be its cost auditor. [Nov. 07 (2 Marks)]
Answer:
Statement is correct.
- Cost auditor should not be the internal auditor of a company for the period for which he is conducting the cost audit.
- If the cost auditor is also the internal auditor, he would not be able to discharge his duties properly.
Question 65.
Comment on the following: ABC Ltd. having turnover of ₹ 100 crores during financial year 2015-16, need not get its branch audited whose turnover is ₹ 1.5 crores during the same year. [May 13 (2 Marks)]
Answer:
Statement is incorrect.
As per section 143(8) of Companies Act, 2013 where a company has a branch office, the accounts of that office shall be audited by either of following:
- the auditor appointed for the company, i.e. company auditor, or
- any other person qualified for appointment as an auditor of the company under this Act, or
- where the branch office is situated in a country outside India, the accounts of the branch office shall be audited either by the company’s auditor or by an accountant or by any other person duly qualified to act as an auditor of the accounts of the branch office in accordance with the laws of that country.
Question 66.
A joint auditor is not bound by the views of the majority of the joint auditors regarding matters to be covered in the auditor’s report. [May 17 (2 Marks)]
Answer:
Statement is correct.
SA 299 “Joint Audit of financial statements” provides the following in respect of reporting responsibilities of joint auditor:
- Normally, the joint auditors are able to arrive at an agreed report.
- However, where the joint auditors are in disagreement with regard to any matters to be covered by the report, each one of them should express his own opinion through a separate report.
- A joint auditor is not bound by the views of the majority of the joint auditors regarding matters to be covered in the report and should express his opinion in a separate report in case of a disagreement.
Question 67.
Joint auditor is always bound by the views of majority of the joint auditors regarding matters to be covered in report. [May 19 (2 Marks)]
Answer:
Statement is incorrect:
SA 299 “Joint Audit of Financial Statements” provides that a joint auditor is not bound by the views of the majority of the joint auditors regarding matters to be covered in the report and should express his opinion in a separate report in case of a disagreement.
Question 68.
Rule 3 of the Companies (Cost Records and Audit) Rule, 2014 provides the classes of companies, engaged in the production of goods of providing services, having an overall turnover of Rs. 25 crore or more during the immediately preceding financial year, required to include cost records in their books of account. [May 19 (2 MarksJl
Answer:
Statement is incorrect.
Rule 3 of the Companies (Cost Records and Audit) Rule, 2014, provides that for the purposes of Sec. 148(1) of the Companies Act, 2013, the specified class of companies, including foreign companies, engaged in the production of the goods or providing services, having an overall turnover from all its products and services of ₹ 35 Cr. or more during the immediately preceding financial year, shall include cost records for such products or services in their books of account.