Strategic Analysis of Operating Income – CA Final SCMPE Question Bank is designed strictly as per the latest syllabus and exam pattern.
Strategic Analysis of Operating Income – CA Final SCMPE Question Bank
Question 1.
State with a brief reason whether you would recommend an activity based system of costing in each of the following independent situations: (May 2012, 5 marks)
(i) Company K produces one product. The overhead costs mainly consist of depreciation.
(ii) Company L produces 5 different products using different production facilities.
(iii) A consultancy firm consisting of lawyers, accountants and computer engineers provides management consultancy services to clients.
(iv) Company S produces two different labour intensive products. The contribution per unit in both products is very high. The BEP is very low. All the work is carried on efficiently to meet the target costs.
Answer:
| Description | Recommend ABC Yes/No | Reason |
| (i) K produces one product. ‘ Overhead is mainly depreciation | No | • One product situation. For allocation of overhead, ABC is not required. • ABC for cost reduction not beneficial since most of the overhead is depreciation. |
| (ii) L produces 5 different products with different facilities. | Yes | • Multi product situation. ABC is required for allocation of overhead. • ABC is necessary for pricing. • Cost drivers are likely to be differei it. • Cost reduction may be possible. • Production facilities are different. |
| (iii) Professional services – lawyers/ accountants/ computer engineers | Yes | • Variety of services. Hence ABC is required for cost allocation. • Services are very different. • ABC is necessary for pricing. • Cost reduction possible. |
| (iv) S produces 2 different labour intensive products. High unit contribution and efficient operations. | No | • Different products, but labour intensive. Hence, overhead allocation based on readily traceable direct labour cost will be accurate. Hence, ABC not required for cost allocation. • Low BEP level implies low level of fixed cost as a % of sale price or as a % of total cost. • Many fixed cost activity drivers are likely to align with the direct labour costs. Hence not required for cost allocation. • Efficient operation. Hence ABC not required even for cost reduction or ABC management. |
![]()
Question 2.
In the context of Activity Based Costing System, explain the following statement: (Nov 2012, 4 marks)
“Strategic cost analysis should exploit nternal linkages.”
Answer:
- Activity based costing is an accounting methodology that assigns cost to activities rather than to products or services.
- Activity based costing tracks the flow of activities by creating internal link between activity/ resource consumption and cost object.
- Exploiting internal linkages means taking advantage of the relationships among the activities that exist within a firm’s segment of value chain.
- Activity cost and analysis are essential parts of this strategic analysis. Activities not based on production units/sales units, based on the variable activity drivers are analyzed.
- The traditional costing system is not rich enough to supply the information needed for thorough analysis of linkages.
![]()
Question 3.
Answer the following question:
Indicated activity drivers in respect of each of the following activity cost pools: (May 2016, 4 marks)
(i) Manufacturing cost
(ii) Human resources cost
(iii) Marketing and sales costs
(iv) Accounting costs
Answer:
Activity drivers:
(i) Manufacturing cost
- No. of output produced
- No. of machine used in production.
(ii) Human resource cost
- Numbers of employees, employed and worked.
- Number of activities done by employee.
(iii) Marketing and Sales costs
- Number of units sold
- Number of places visited and number of strategy adopted.
(iv) Accounting cost
- Number of records recorded
- Number of transactions
- Number of employees employed.
![]()
Question 4.
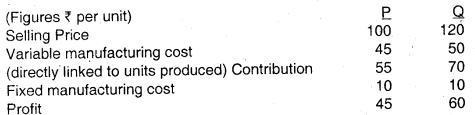
Traditional Ltd. is a manufacturer of a range of goods. The cost structure of its different products is as follows: (May 2009, 5 marks)
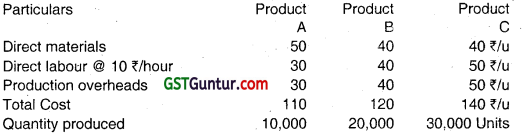
Traditional Ltd. was absorbing overheads on the basis of direct labour hours. A newly appointed management accountant has suggested that the company snouia introduce ABC system ana nas identified cost drivers and cost pools as follows:
You are required to calculate activity based production cost of all the three products.
Answer:
The total production overheads are ₹ 26,00,000.
Product A: 10,000 × ₹ 30 = ₹ 3,00,000
Product B: 20,000 × ₹ 40 = ₹ 8,00,000
Product C: 30,000 × ₹ 50 = ₹ 15,00,000
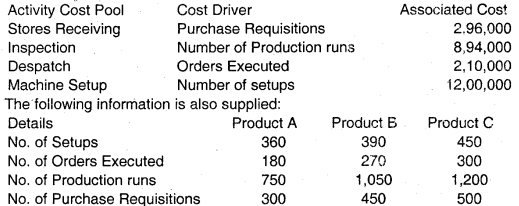
On the basis of ABC analysis this amount will be apportioned as follows :
Statement of Activity Based Production Cost
![]()
Question 5.
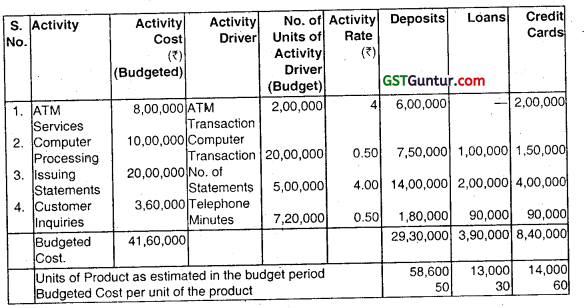
A bank offers three products, viz., deposits, Loans and Credit Cards. The bank has selected 4 activities for a detailed budgeting exercise, following activity based costing methods. (Nov 2009, 12 marks)
The bank wants to know the product wise total cost per unit for the selected activities, so that prices may be fixed accordingly.
The following information is made available to formulae the budget :
The activity drivers and their budgeted quantities are given below:
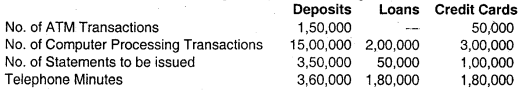
The bank budgets a volume of 58,600 deposit accounts, 13,000 loan accounts, and 14,000 Credit Card accounts.
You are required to:
(i) Calculate the budgeted rate for each activity.
(ii) Prepare the budgeted cost statement activity wise.
(iii) Find the budgeted product cost per account for each product using (i) and (ii) above.
Answer:
Budget Cost Statement
Working Notes:
![]()
Question 6.
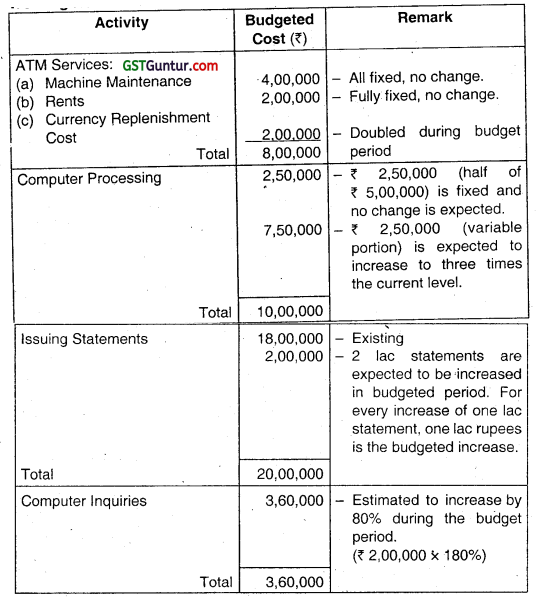
AML Ltd. is engaged in production of three types of ice-cream products: Coco, Strawberry and Vanilla. The company presently sells 50,000 units of Coco @ 25 per unit, Strawberry 20,000 @ ₹ 20 per unit and Vanilla 60,000 units @ ₹ 15 per unit. The demand ¡s sensitive to selling price and it has been observed that every reduction of ₹ 1 per unit in selling price, increases the demand for each product by 10% to the previous level. The company has the production capacity of 60,500 units of Coco, 24,200 units of Strawberry and 72,600 units of Vanilla. The company marks up 25% on cost of the product. (May 2010, 12 marks)
The Company management decides to apply ABC analysis. For this purpose it identifies four activities and the rates as follows:
Activity – Cost Rate
Ordering – ₹ 800 per purchase order
Delivery – ₹ 700 per delivery
Shelf stocking – ₹ 199 per hour
Customer support and assistance ₹ 1.10 pu. sold.
The other relevant information for the products are as follows:
Under the traditional costing system, store support costs are charged @ 30% of prime cost. In ABC these costs are coming under customer support and assistance.
Required:
(i) Calculate target cost for each product after a reduction of selling price required to achieve the sales equal to the production capacity.
(ii) Calculate the total cost and unit cost of each product at the maximum level using traditional costing.
(iii) Calculate the total cost and unit cost of each product at the maximum level using activity based costing.
(iv) Compare the cost of each product calculated in (i) and (ii) with (iii) and comment on it.
Answer:
(i) Cost of products under target costing Demanded unit and selling price
| Coco | Strawberry | Vanilla | |||
| Selling Price | Demand | Selling Price | Demand | Selling Price | Demand |
| 25 | 50,000 | 20 | 20,000 | 15 | 60,000 |
| 24 | 55,000 | 19 | 22,000 | 14 | 66,000 |
| 23 | 60,500 | 18 | 24,200 | 13 | 72,600 |
![]()
Target cost of each product after reduction in selling price
| Coco | Strawberry | Vanilla | |
| Selling price after reduction | 23.00 | 18.00 | 13.00 |
| Profit marks up 25% on cost i.e. 20% on selling price | 4.60 | 3.60 | 2.60 |
| Target cost of production (per unit) | 18.40 | 14.40 | 10.40 |
(ii) Cost of product under traditional costing
| Coco | Strawberry | Vanilla | |
| (₹) | (₹) | (₹) | |
| Units | 60,500 | 24,200 | 72,600 |
| Material cost (8,6,5, per unit) . | 8 | 6 | 5 |
| Labour cost (5,4,3 per unit) | 5 | 4 | 3 |
| Prime cost | 13 | 10 | 8 |
| Store support costs (30% of prime) | 3.90 | 3 | 2.40 |
| Cost per unit | 16.90 | 43.00 | 10.40 |
![]()
(iii) Cost of product under activity based costing
| Coco | Strawberry | Vanilla | |
| (₹) | ‘ (₹) | (₹) | |
| Units | 60,500 | 24,200 | 72,600 |
| Material cost (8,6,5, per unit) | 4,84,000 | 1,45,200 | 3,63,000 |
| Labour cost (5,4,3 per unit) | 3,02,500 | 96,800 | 2,17,800 |
| Prime cost | 7,86,500 | 2,42,000 | 5,80,800 |
| Ordering cost @ ₹ 800 (35, 30, 15) | 28,000 | 24,000 | 12,000 |
| Delivery cost @ ₹ 700 (112, 66, 48) | 78,400 | 46,200 | 33,600 |
| Shelf stocking @ ₹ 199, (130, 150, 160) | 25,870 | 29,850 | 31,840 |
| Customer Support ₹ 1.10 | 66,550 | 26,620 | 79,860 |
| Cost Per unit | 16.29 | 15.23 | 10.17 |
(iv) Comparative Analysis of cost of production (₹)
| Coco | Strawberry | Vanilla | |
| (₹) | (₹) | (₹) | |
| (a) As per Target Costing | 18.40 | 14.40 | 10.40 |
| (b) As per traditional Costing | 16.90 | 13.00 | 10.40 |
| (c) As per Activity Based Costing | 16.29 | 15.23 | 10.17 |
| (a) – (c) | 2.11 | -0.83 | 0.23 |
| (b) – (c) | 0.61 | -2.23 | 0.23 |
Note: (a) The cost of product of strawberry is higher in ABC method in comparison to target costing and traditional methods. It indicated that actual profit undpr target, costing is less than targeted. For remaining two products, k ABC is most suitable.
![]()
Question 7.
Fruitolay has decided to increase the size of the store. It wants the information about the probability of the individual product lines: Lemon, grapes and papaya. It provides the following data for the 2009 for each product line: (Nov 2010, 11 marks)
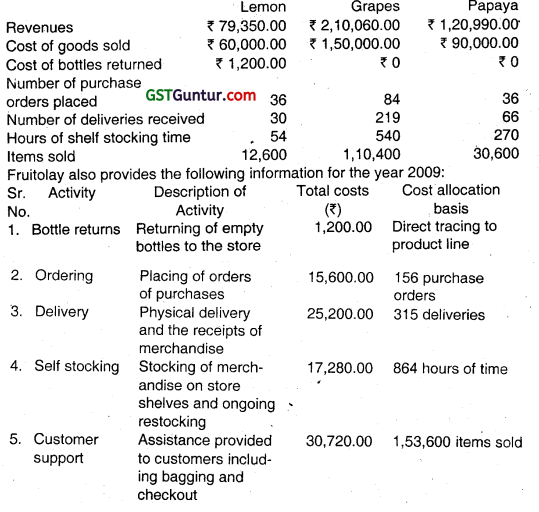
Required:
(i) Fruitolay currently allocates store support coats (all costs other than the cost of goods sold) to the product line on the basis of the cost of goods sold of each product line. Calculate the operating income and operating income as the percentage of revenue of each product line.
(ii) If Fruitolay allocates store support costs (all costs other than the cost of goods sold) to the product lines on the basis of ABC system, calculate the operating income and operating income as the percentage of revenue of each product line.
(iii) Compare both the systems.
Answer:
(i) Traditional Costing System
| Particulars | Lemon | Grapes | Papaya | Total |
| Revenue | 79,350 | 2,10,060 | 1,20,990 | 4,10,400 |
| Less: Cost of goods sold (COGS) | 60,000 | 1,50,000 | 90,000 | 3,00,000 |
| Less: Store Support Cost | 18,000 | 45,000 | 27,000 | 90,000 |
| Operating income | 1,350 | 15,060 | 3,990 | 20,400 |
| Operating Income % | 1.70% | 7.17% | 3.30% | 4.97% |
![]()
(ii) ABC System Overhead Allocation Rate
| Activity | Cost Heirarchy Level | Total Costs (₹) | Quantity of Cost Allocation Base | Overhead Allocation Rate |
| Ordering | Batch | 15600 | 156 Purchase orders | ₹ 100 |
| Delivery self | Batch | 25200 | 315 delivering orders | ₹ 80 |
| Stocking | Output unit | 17280 | 864 self stocking hours | ₹ 20 |
| Customer Support | Output unit | 30720 | 153600 items sold | ₹ 0.20 |
Store Support Cost
| Particulars | Cost Driver | Lemon | Grapes | Papaya | Total |
| Bottle Returns | Direct | 1200 | 0 | 0 | 1200 |
| Ordering | Purchase orders | 3600 | 8400 | 3600 | 15600 |
| Delivery | Deliveries | 2400 | 17520 | 5280 | 25200 |
| Self Stocking | Hours of time | 1080 | 10800 | 5400 | 17280 |
| Customer Support | Items Sold | 2520 | 22080 | 6120 | 30720 |
| Grand Total | 10800 | 58800 | 20400 | 90000 |
![]()
Operating Income
| Particulars | Lemon | Grapes | Papaya | Total |
| Revenue | 79350 | 210060 | 120990 | 410400 |
| Less: Cost of goods sold | 60000 | 150000 | 90000 | 300000 |
| Less: Store Support Cost | 10800 | 58800 | 20400 | 90000 |
| Operating income | 8550 | 1260 | 10590 | 20400 |
| Operating income % | 10.78% | 0.60% | 8.75% | 4.97% |
Summary/Comparison
| Particulars | Lemon | Grapes | Papaya | Total |
| Under Traditional Costing System | 1.70% | 7.17% | 3.30% | 4.97% |
| Under ABC System | 10.78% | 0.60% | 8.75% | 4.97% |
The grapes line drops sizeably when ABC is used. Although it constitutes 50%; COGS, it uses a higher percentage of total resources in each activity area, especially the high cost of customer support area. In contrast, lemon line draws a much lower percentage of total resources used in each activity area than its percentage of total COGS. Hence under ABC, Lemon is most profitable. Fruitolay can explore ways to increase sales of lemons and also explore price increases on grapes.
Operating Income Ranking is highest for Grapes under Traditional System because other products bear its overhead cost, whereas under ABC a more accurate picture shows Grapes as the lowest ranking product.
![]()
Question 8.
During the last 20 years, KL Ltd.’s manufacturing operation has become increasingly automated with computer-controlled robots replacing operators. KL currently manufactures over 100 products of varying levels of design complexity. A single plant wise overhead absorption rate, based on direct labour hours is used to absorb overhead costs. (May 2011, 8 marks)
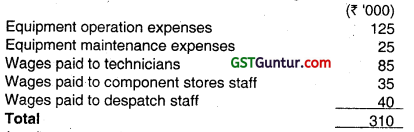
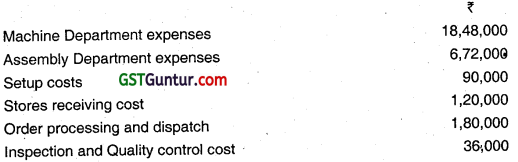
In the quarter ended March, KL’s manufacturing overhead costs were:
During the quarter, the company reviewed the Cost Accounting System and concluded that absorbing overhead costs to individual products on a labour hour absorption basis was meaningless and that overhead costs should be attributed to products using an Activity Based Costing (ABC) system. The following are identified as the most significant activities:
- Receiving component consignments from suppliers’.
- Setting up equipment for production runs
- Quality inspections
- Despatching goods as per customers’ orders.
Equipment operation and maintenance expenses are apportioned as:
- Component stores 15%, production runs 70% and despatch 15% Technicians’ wages are apportioned as:
- Equipment maintenance 30%, set up equipment for production runs 40% and quality inspections 30%.
During the quarter:
- 980 component consignments were received from suppliers.
- 1020 production runs were set up
- 640 quality inspections were carried out.
- 420 orders were despatched to customers.
KL’s production during the quarter included component R. The following information is available.
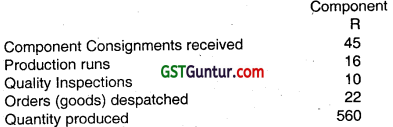
Calculate the unit manufacturing overhead cost of component R using ABC system.
Answer:
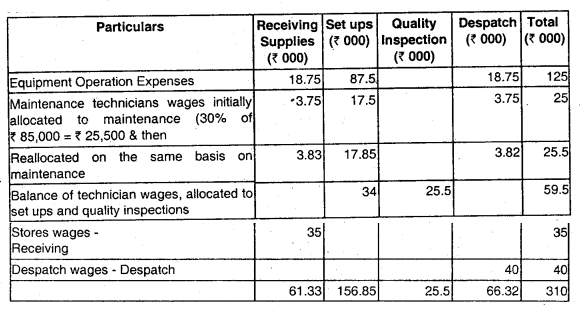
Note: Equipment operations expenses and Maintenance allocated on the basis 15% 70%, and 15% as per the information given in the question.
The next step is to identify cost drivers for each activity and established cost driver rates by dividing the activity costs by a measure of cost drive usage for the period. The calculations are as follows.
Receiving supplies (₹ 61,330/980) = ₹ 62.58 per component
Performing set ups(₹ 1,56,850/1020) = ₹ 153.77 per set up
Despatching goods (₹ 66,320/420) = ₹157.93 per goods order despatched
Quality Inspection (₹ 25,500/640) = ₹ 39.84
At last the costs are assigned to components based on their cost driver usage.
![]()
The assignments are as follows.
| Particulars | (₹) |
| Direct Labour | 300 |
| Direct Materials | ‘1200 |
| Receiving supplies | 2816.1 |
| Performing Set up | 2460.32 |
| Quality Inspection | 398.4 |
| Despatching goods | 3474.46 |
| Total Cost | 10649.28 |
| (₹) | |
| No. of units produced | 560 |
| Cost per unit | 19.01 |
For components the overhead costs have been assigned as follows (for components R)
Receiving supplies (45 receipts at ₹ 62.58)
Performing setups (16 production runs at ₹ 153.77)
Quality Inspections (10 at ₹ 39.84)
Despatching goods (22 at ₹ 157.90).
![]()
Question 9.
PO Ltd. makes two products P and Q, which are similar products with slight difference in dimensions, but use the same manufacturing processes and facilities. Production may be made interchangeably after altering machine setup. Production time is the same for both products. The cost structure is as follows: (Nov 2011)
Fixed cost per unit has been calculated based on the total practical capacity of 20,000 units per annum (which is either P or Q or both put together). Market demand is expected to be the deciding factor regarding the product mix for the next 2 years. The company does not stock inventory of finished goods. The company wishes to know whether ABC system is to be Set up at a cost of ₹ 10,000 per month for the purpose of tracking and recording the fixed overhead costs for allocation to products.
Support your advice with appropriate reasons. (6 marks)
Independent of the above, if you are told to assume that fixed costs stated above, consist of a non-cash component of depreciation to plant at ₹ 90,000 for the year, will your advice change? Explain. (2 marks)
Answer:
| Data | Reasoning | Decision |
| (i) Similar Products, Similar Production Resources | OH Cost based on production units is appropriate. ABC will also yield identical results | ABC system not required for OH allocation |
| (ii) Present OH Cost = ₹ 10/u. Proposed . Increase due to ABC system: 120000 / 20000 = ₹ 6/u | Current OH cost of ₹ 10/u will increase by ₹ 6 per unit due to installing ABC system (60% increase) | For allocation purpose, ABC not justified |
| (iii) Both have positive contribution/u. Market demand determines the mix | OH allocation has no role in decision making | No need for ABC System |
| (iv) For the purpose of OH allocation, ABC need not be installed. However, if the fixed overheads of ₹ 2,00,000 are analysed by activity and thereby a saving of at least ₹ 1,20,000 be expected (which is the cost of installing ABC system), then, ABC system may be installed | ||
| (v) For the non cash component of depn. = ₹ 90,000, FC that can be saved is a maximum of ₹ 1,10,000 (₹ 2,00,000 – ₹ 90,000).
Hence, this is clearly less than ABC cost installation. Hence do not install ABC System |
||
![]()
Question 10.
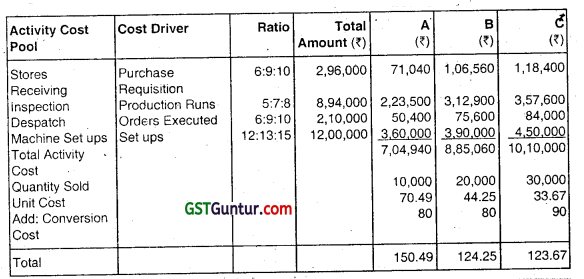
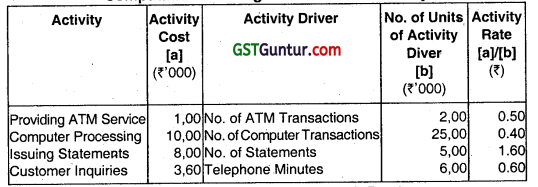
DEF Bank operated for years under the assumption that profitability can be increased by increasing Rupee volumes. But that has not been the case. Cost Analysis has revealed the following: (May 2013)
| Activity | Activity Cost (₹) | Activity Driver Activity Capacity | |
| Providing ATM service | 1,00,000 | No. of transactions | 2,00,000 |
| Computer processing | 10,00,000 | No. of transactions | 25,00,000 |
| Issuing Statements | 8,00,000 | No. of statements | 5,00,000 |
| Customer inquiries | 3,60,000 | Telephone minutes | 6,00,000 |
The following annual information on three products was also made available:
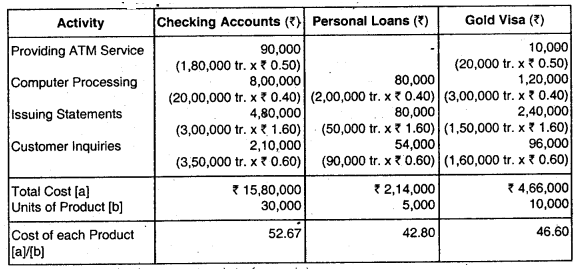
| Checking Accounts | Personal Loans | Gold Visa | |
| Units of product | 30,000 | 5,000 | 10,000 |
| ATM transactions | 1,80,000 | 0 | 20,000 |
| Computer transactions | 20,00,000 | 2,00,000 | 3,00,000 |
| Number of statements | 3,00,000 | 50,000 | 1,50,000 |
| Telephone minutes | 3,50,000 | 90,000 | 1,60,000 |
![]()
Required:
(i) Calculate rates for each activity.
(ii) Using the rates computed in requirement (i), calculate the cost of each product. (8 marks)
Answer:
Computation showing Rates for each Activity
Computation showing Cost of each Product
![]()
Question 11.
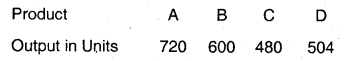
MK Ltd. manufactures four products, namely A, B, C and D using the same plant and process. The following information relates to a production period: (Nov 2013, 8 marks)
The four .products are similar and are usually produced in production runs of 24 units and sold in batches of 12 units. The total overheads incurred by the company for the period are as follows:
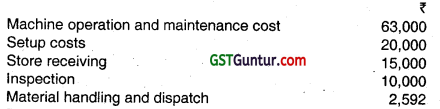
During the period the following cost drivers are to be used for the overhead cost:
Cost – Cost driver
Setup cost – No. of production runs
Store receiving – Requisitions raised
Inspection – No. of production runs
Material handling and dispatch – Orders executed
It is also determined that:
- Machine operation and maintenance cost should be apportioned between setup cost, store receiving and inspection activity in the ratio 4 : 3 : 2.
- Number of requisition raised on store is 50 for each product and the no. of orders executed is 192, each order being for a batch of 12 units of a product.
Calculate the total overhead cost per unit of each product using activity based costing after finding activity wise overheads allocated to each product.
Answer:
1. Computation of ABC Recovery Rates
| Activity | Activity Cost Pool | Cost Driver | Quantity | ABC Rate |
| Set Up | 20,000 + 28,000 = ₹ 48,000 | No. of Production Runs | 96 | ₹ 500 per Run |
| Stores Receiving | 15,000 + 21,000 = ₹ 36,000 | Requisitions raised | 50 × 4 = 200 | ₹180 per Reqn. |
| Inspection | 10,000+ 14,000 = ₹ 24,000 | No. of Production Runs | 96 | ₹ 250 per, Run |
| Material Handling | Given = ₹ 2,592 | Orders executed | 192 | 7 13.5 per Batch |
![]()
Note:
Machine Operation and Maintenance Cost of ₹ 63,000 is apportioned to the first three activities in the ratio 4:3:2, i.e. ₹ 28,000, ₹ 21,000 and ₹ 14,000
Number of Production Runs and Number of Batches are computed as under:
| Product | A | B | C | D | Total | |
| (a) | Output Quantity | 720 units | 600 units | 480 units | 504 units | |
| (b) | Quantity per Production Run | 24 units | 24 units | 24 units | 24 units | |
| (c) | Number of Production Runs (a ÷ b) | 30 runs | 25 runs | 20 runs | 21 runs | 96 runs |
| (d) | Quantity per Batch Order | 12 units | 12 units | 12 units | 12 units | |
| (e) | Number of Batches (a ÷ b) | 60 batches | 50 batches | 40 batches | 42 batches | 192 batches |
2. Computation of OH Costs using ABC System
| Product | A | B | C | □ | Total |
| • Set up | 500 × 30 = ₹ 15,000 | 500 × 25 = ₹ 12,500 | 500 × 20 = ₹ 10,000 | 500× 21 = ₹ 10,500 | ₹ 48,000 |
| • Stores Receiving | 7 9,000 | ₹ 9,000 | ₹ 9,000 | ₹ 9,000 | ₹ 36,000 |
| • Inspection | 250 × 30 = ₹ 7,500 | 250 × 25 = ₹ 6,250 | 250 × 20 = ₹ 5,000 | 250 × 21 = ₹ 5,250 | ₹ 24,000 |
| • Material Handling | 13.50 × 60 = ₹ 810 | 13.50 × 50 = ₹ 675 | 13.50 × 40 = ₹ 540 | ‘13.50 × 42 = ₹ 567 | ₹ 2,592 |
| (a) Total OH Cost | ₹ 32,310 | ₹ 28,425 | ₹ 24,540 | ₹ 25,317 | ₹ 1,10,592 |
| (b) Output Quantity | 720 units | 600 units | 480 units | 504 units | |
| (c) OH Cost p.u. | ₹ 44.875 | ₹ 47.375 | ₹ 51.125 | ₹ 50.232 |
![]()
Question 12.
PQR Ltd. specializes in the distribution of pharmaceutical products. It buys from pharmaceutical companies and resells to each of the three different markets: (May 2014, 8 marks)
(i) General Supermarket chains
(ii) Drug Store chains .
(iii) Chemist shops
The company plans to use activity based costing for analyzing the profitability of its distribution channels. The following data for the quarter ending March, 2014 is given:
| General supermarket chains | Drug store chains | Chemist shops | |
| Average sales per delivery | ₹ 96,500 | ₹ 32,450 | ₹ 6,225 |
| Average cost of goods sold per delivery | ₹ 94,650 | ₹ 31,800 | ₹ 5,950 |
| Number of deliveries | 960 | 2,470 | 8,570 |
| Total number of orders | 1,000 | 2,650 | 9,500 |
| Average number of cartons shipped per delivery | 250 | 75 | 12 |
| Average number of hours of shelf stocking per delivery | 2 | 0.5 | 0.1 |
The following information is available in respect of operating costs (other than cost of goods sold for the quarter ending March, 2014:
| Activity Area | Cost driver | Total cost (₹) |
| Customer purchase order processing | Purchase order by customers | 5,91,750 |
| Customer store delivery | Number of deliveries | 9,60,000 |
| Cartons dispatched to customer stores | Number of Cartons dispatched to customer stores | 7,92,135 |
| Shelf stocking at customer store | Hours of shelf stocking | 80,240 |
![]()
Compute the operating income of each distribution channel for the quarter ending March, 2014 using activity based costing.
Answer:
Statement showing operating Income of Distribution Channels of POR Ltd.
| Particulars | General Supermarket Chains (₹) | Drug Store Chains (₹) | Chemist Shops (₹) | Total (₹) |
| Sales
(Number of Deliveries x Average Sales per delivery) |
9,26,40,000 (960 × ₹ 96,500) | 8,01,51,500 (2,470 × ₹ 32,450) | 5,33,48,250 (8,570 × ₹ 6,225) | 22,61,39,750 |
| Less: Cost of Goods $old (Number of Deliveries x Average Cost of Goods Sold per delivery) | 9,08,64,000 (960 × ₹ 94,650) | 7,85,46,000 (2,470 x ₹ 31,800) | 5,09,91,500 (8,570 × ₹ 5,950) | 22,04,01,500 |
| Gross Margin | 17,76,000 | 16,05,500 | 23,56,750 | 57,38,250 |
| Less: Operating Costs | 5,20,200 | 6,19,425 | 12,84,500 | 24,24,125 |
| Operating Income | 12,55,800 | 9,86,075 | 10,72,250 | 33,14,125 |
![]()
Workings Notes:
Statement Showing Operating Cost of Distribution Channels of POR Ltd.
| Particulars | General Supermarket Chains (₹) | Drug Store Chains (₹) | Chemist Shops (₹) | Total (₹) |
| Customer Purchase Order Processing | 45,000 (₹ 45 × 1,000) | 1,19,250 (₹ 45 × 2,650) | 4,27,500 (₹ 45 × 9,500) | 5,91,750 |
| Customer Store Delivery | 76,800 (₹ 80 × 960) | 1,97,600 (₹ 80 × 2,470) | 6,85,600 (₹ 80 × 8,570) | 9,60,000 |
| Cartons Dispatched to Customer Stores | 3,60,000 (₹ 1.5 × 2,40,000) | 2,77,875 (₹ 1.5 ×x 1,85,250) | 1,54,260 (₹ 1.5 × 1,02,840) | 7,92,135 |
| Shelf Stocking at Customer Store | 38,400 (₹ 20 × 1,920) | 24,700 (₹ 20 × 1,235) | 17,140 (₹ 20 × 857) | 80,240 |
| 5,20,200 | 6,19,425 | 12,84,500 | 24,24,125 |
Computation of Rate Per Unit of Cost Allocation Base
| Activity | Activity Cost [a] (₹) | Activity Driver | No. of Units of Activity Drive [b] | Cost Driver Rate [a]/[b] (₹) |
| Customer Purchase Order Processing | 5,91,750 | Purchase Order by Customers | 13,150 | 45.00 |
| Customer Store Delivery | 9,60,000 | Number of Deliveries | 12,000 | 80.00 |
| Cartons Dispatched to Customer Stores | 7,92,135 | Number of Cartons Dispatched to Customer Stores | 5,28,090 | 1.50 |
| Shelf Stocking at Customer Store | 80,240 | Hours of Shelf Stocking | 4,012 | 20.00 |
![]()
No. of Units of Activity Driver:
Purchase Order by Customers
= 1,000 +2,650+9,500
= 13,150
Number of Deliveries = 960 + 2,470 + 8,570
= 12,000
Number of Cartons Dispatched to Customer Stores = Number of Deliveries × Average Number of Cartons Shipped per delivery
= (960 × 250) + (2,470 × 75) + (8,570 × 12)
= 2,40,000 + 1,85,250 + 1,02,840
= 5,28,090
Hours of Shelf Stocking = Number of Deliveries × Average Number of Hours of Shelf Stocking per delivery
= (960 × 2.0) + (2,470 × 0.5) + (8,570 × 0.1)
= 1,920 + 1,235 + 857
= 4,012
![]()
Question 13.
A company manufactures several products of varying designs and models. It uses a single overhead recovery rate based on direct labour hours. The overheads incurred by the Company in the first half of the year are as under: (Nov 2014, 10 marks)
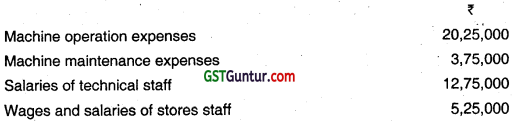
During this period, the company introduced activity based costing system and the following significant activities were identified:
- Receiving materials and components
- Set up of machines for production runs
- Quality inspection
It is also determined that:
- The machine operation and machine maintenance expenses should be apportioned between stores and production activity in 1 : 4 ratio.
- The technical staff salaries should be apportioned between machine maintenance, set up and quality inspection in 3 : 4 : 3 ratio.
![]()
The consumption of activities during the period under review are as under:
- Direct labour hours worked – 80,000
- Production set-ups – 4,080
- Material and components consignments received from suppliers – 3,920
- Number of quality inspection carried out – 2,560
The direct wages rate is ₹ 12 per hour.
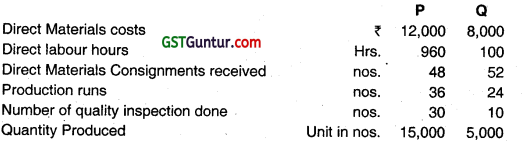
The data relating to two products manufactured by the company during the period are as under:
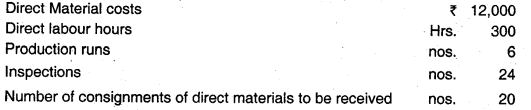
A potential customer has approached the company for the supply of 24,000 units of a component ‘R’ to be delivered in lots of 3000 units per quarter. The job will involve an initial design cost of ₹ 60,000 and the manufacture will involve the following per quarter.
You are required to
1. Calculate the cost of products P and Q based on the existing system of single overhead Recovery rate.
2. Determine the cost of products P and Q using Activity Based Costing system.
3. Compute the sales values per quarter of components ‘R’ using Activity Based Costing system, (considering a mark up of 25% on cost)
Answer:
1. Statement of Computation of Unit Cost of Product P and O on the Existing System
| Particulars | P(₹) | Q(₹) |
| Direct Material | 12,000 | 8,000 |
| Direct Labour Cost | 11,520 (₹ 12 × 960 hr.) | 1,200 (₹ 12 × 100 hr.) |
| Overheads (Direct Labour Hours × ₹ 52.5 per hour) | 50,400 | 5,250 |
| Total Cost | 73,920 | 14,450 |
| Quantity Produced (units) | 15,000 | 5,000 |
| Cost per unit | 4.928 | 2.89 |
Single Factory Direct Labour Hour Overhead Rate = \(\frac{₹ 42,00,000}{80,000 \text { labourhours }}\)
= ₹ 52.50 per Direct Labour Hour
![]()
2. Workings
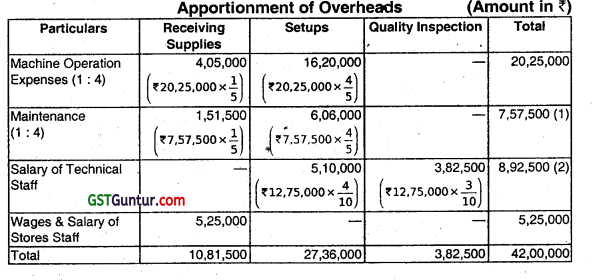
(1) ₹ 3,75,000 + Share of Technician’s Salary (₹ 12,75,000 × \(\frac{3}{10}\))
(2) ₹ 12,75,000 – Share to Machine Maintenance (₹ 12,7,000× \(\frac{3}{10}\))
To identify the cost drivers for each activity and establish cost driver rates by dividing the activity costs by a measure of cost driver usage for the period.
Calculation of Activities Cost Driver Rate
| Overheads | Activity Cost Driver Rate |
| Receiving Supplies \(\left[\frac{₹ 10,81,500}{3,920}\right]\) | ₹ 275.89 Per consignment |
| Performing Setups \(\left[\frac{₹ 27,36,000}{4,080}\right]\) | ₹ 670.59 per setup |
| Quantity Inspection \(\left[\frac{₹ 3,82,500}{2,560}\right]\) | ₹ 149.41 per quality inspection |
Thus, costs are assigned to components based on their cost driver usage. The assignments are as follows:
![]()
Statement of Determination of the Cost of Product P & Q using Activity Based Costing System
| Particulars | P(₹) | Q(₹) |
| Direct Materials | 12,000 | 8,000 |
| Direct Labour @ * 12 per hour | 11,520 | 1,200 |
| Receiving Supplies | 13,243 (₹ 275.89 × 48 Con.) |
14,346 (₹ 275.89 × 52 Con.) |
| Performing Setups | 24,141 (₹ 670.59 × 36 Set-ups) |
16,094 (₹ 670.59 × 24 Set-ups) |
| Quality Inspections | 4,482 (₹ 149.41 × 30 Ql) |
1,494 (₹ 149.41 × 10 Ql) |
| Total Costs | 65,386 | 41,134 |
| No. of Units Produced | 15,000 | 5,000 |
| Cost Per Unit | 4.36 | 8.23 |
3. Calculation of Sales Value per Quarter of Component ‘R’ (using ABC)
| Particulars of Costs | Amount (₹) |
| Direct Materials | 12,000 |
| Direct Labour (@ ₹ 12 per hour) | 3,600 (₹ 12 × 300 Hr.) |
| Initial Design Cost (₹ 60,000 ÷ 8 Quarter) | 7,500 |
| Receiving Supplies | 5,518 (₹ 275.89 × 20 Con.) |
| Performing Setups | 4,024 (₹ 670.59 × 6 Set-ups) |
| Quality Inspections | 3,586 (₹ 149.41 × 24 Ql) |
| Total Costs | 36,228 |
| Add: Margin 25% of ₹ 36,228 | 9,057 |
| Total Sales Value | 45,285 |
![]()
Question 14.
Linex Limited manufactures three products P, Q and R which are similar in nature and are usually produced in production runs of 100 units. Product P and R require both machine hours and assembly hours, whereas product Q requires only machine hours. The overheads incurred by the company during the first quarter are as under: (May 2015, 8 marks)
The data related to the three products during the period are as under:
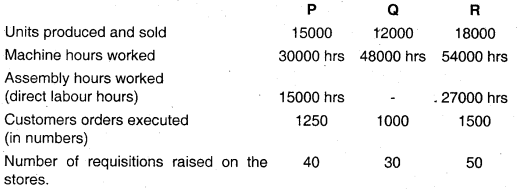
Prepare a statement showing details of overhead costs allocated to each product type using activity based costing.
Answer:
Computation of Activity Rate
| Cost Pool | Cost (?) [A] | Cost Driver [B] | Cost Driver Rate (₹) [C] = [A] ÷ [B] |
| Machine Department Expenses | 18,48,000 | Machine Hours (1,32,000 hrs.) | 14 |
| Assembly Department Expenses | 6,72,000 | Assembly Hours (42,000 hrs.) | 16.00 |
| Setup Cost | 90,000 | No. of Production Runs (450*) | 200 |
| Stores Receiving Cost | 1,20,000 | No. of Requisitions Raised on the Stores (120) | 1000 |
| Order Processing and Dispatch | 1,80,000 | No. of Customers Orders Executed (3,750) | 48 |
| Inspection and Quality Control Cost | 36,000 | No. of Production Runs (450*) | 80 |
| Total (₹) | 29,46,000 |
*Number of Production Run is 450 (150 + 120 + 180)
![]()
Statement Showing Overheads Allocation
![]()
Question 15.
X Ltd. makes a single product with the following details: (Nov 2015)
| Description | Current Situation | Proposed Change |
| Selling Price (₹/ unit) | 10 | |
| Direct Costs (₹/ unit) | 5 | |
| Present number of setups per production period, (before each production run, setup is done) | 42 | |
| Cost per set up (₹) | 450 | Decrease by ₹ 90 |
| Production units per run | 960 | 1008 |
| Engineering hours for production period | 500 | 422 |
| Cost per engineering hour (₹) | 10 |
The company has begun Activity Based Costing of fixed costs and has presently identified two cost drivers, viz, production runs and engineering hours. Of the total fixed costs presently at ₹ 96,000, after the above, ₹ 72,100 remains to be analysed. There are changes as proposed above for the next production period for the same volume of output.
(i) How many units and in how many production runs should X Ltd. produce in the changed scenario in order to break – even?
(ii) Should X Ltd. continue to break up the remaining fixed costs into activity based costs? Why? (8 marks)
Answer:
(a) Workings
Statement Showing ‘Non-unit Level Overhead Costs’
| Particulars | Current Situation | Proposed Situation |
| No. of Production Runs/ Setups | 42 | 40 \(\left(\frac{960 \text { runs } \times 42 \text { setup }}{1,008 \text { units }}\right) .\) |
| Cost per Setup | ₹ 450 | ₹ 360 ’ |
| Production Units per run | 960 units | 1,008 units |
| Production Units | 40,320 (960 units × 42) | 40320 |
| Engineering Hrs. | 500. | 422 |
| Engineering Cost per hour | ₹ 10 | ₹ 10 |
![]()
Requirement of Question
(i) Break Even Point (Changed Scenario)
Break Even Point
= \(\frac{\text { Fixed Cost }+ \text { (Setup Cost } \times \text { No. of Setups) }+ \text { (Engineering Costs } \times \text { No. of Engineering Hrs.) }}{\text { (Price }- \text { Unit Variable Cost) }}\)
= \(\frac{₹ 72,100+(₹ 360 \times 40 \text { Setups })+(₹ 10 \times 422 \mathrm{hrs} .)}{(₹ 10-₹ 5)}\) = 18,144 units
Break Even Point (No. of Production Runs).
= \(\frac{\text { Break Even(units) }}{\text { Production(unitsperrun) }}=\frac{18,144 \text { units }}{1,008 \text { units }}\) = 18 Runs
(ii) A company should adopt Activity Based Costing (ABC) system for accurate product costing, ps traditional volume based costing system does not take into account the Non-unit Level Overhead Costs such as Setup Cost, Inspection Cost, and Material Handling Cost etc.
Cost Analysis under ABC system showed that while these costs are largely fixed with respect to sales volume, but they are not fixed to other appropriate cost drivers. If break up of the remaining ₹ 72,100 fixed costs consist of only a small portion of these costs, ABC need not be applied. However, it may also be noted that the primary study has resulted in cost savings. If the savings in cost are expected to exceed the cost of study and implementing ABC, it may be justified. Further it is pertinent to mention that ABC offers no increase in product-costing accuracy for single-product setting.
![]()
Question 16.
Speedo Limited is a specialist car manufacturer that produces various models of cars. The organization is due to celebrate its 100th anniversary next year. To mark the occasion, Speedo Limited intends to produce a sports car; the Model Royal. As this will be a special edition, production will be limited to 1,000 numbers of Model Royal Cars. (Nov 2016)
Speedo Limited is considering using a target costing approach and has conducted market research to determine the features that consumers require in a sports car. Based on this market research and knowledge of competitor’s products, company has decided to price the Model Royal at ₹ 9.75 lacs. Company requires an operating profit margin of 25% of the selling price of the car. Details for the forthcoming year are as follows:
Forecast of direct costs for a Model Royal Car-
Labour – ₹ 2,50,000
Material – ₹ 14,75,000
Forecast of annual overhead costs:
| ₹ in lacs | Cost driver | |
| Production line cost | 2,310 | See note 1 |
| Transportation costs | 900 | See note 2 |
Note 1:
The production line that would be used for Model Royal has a capacity of 60,000 machine hours per year. The production line time required for Model Royal is 6 machine hours per car. This production line will also be used to make other cars and will be working at full capacity.
![]()
Note 2:
Some models of cars are delivered to showrooms using car transporters. 60% of the transportation costs are related to the number of deliveries made. 40% of the transportation costs are related to the distance travelled.
The car transporters have forecast to make a total of 640 deliveries in the year and carry 10 cars each time. The car transporter will always carry its maximum capacity of 10 cars.
The total annual distance travelled by car transporters is expected to be 2.25.0 kms. 50,000 kms of this is for the delivery of Model Royal cars only. All 1,000 Model Royal cars that will be produced will be delivered in the year using the car transporters.
Required:
(i) Calculate the forecast total cost of producing and delivering a Model Royal car using Activity Based Costing principles to assign the overhead costs.
(ii) Calculate the cost gap that currently exists between the forecast total cost and the target total cost of a Model Royal car. (10 marks)
Answer:
Computation of overhead using Activity Based Costing
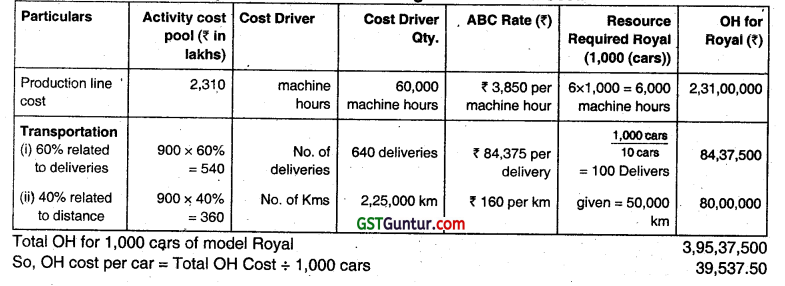
Target cost, forecast total cost and cost Gap
![]()
Question 17.
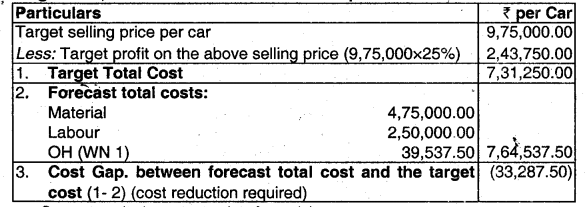
A company can make any or both of products A and B in a production period not exceeding a total of 10,000 units due to non-availability of the required material and labour. Until now, the company had been taking decisions on the product mix, based on the following marginai cost analysis. (May 2017)
Since the decisions based on the above approach did not yield the required results, the fixed costs were analysed as follows for 10,000 units of only A or 10,000 units of only B.
₹ 30,000 can be taken as the unanalysed fixed cost, and unavoidable whether A or B or both are produced.
The following cost reduction measures were taken by the Product Managers of A and B:
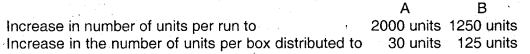
Further, the Management ensured availability of raw material and labour to support a production of 15000 units of either A or B or both together. There was no change to the step costs or contribution. However, the total unanalysed fixed cost increased to ₹ 32,000.
(i) Based on the principles of Activity Based Costing, prepare a statement showing the contribution and item wise analysed overheads for each product, arrive at the profitability of A and B and then the final profits if 15000 units of only A or 15000 units of only B are manufactured.
(ii) Find the minimum break-even point in units if only product A is manufactured after the cost reduction. (12 marks)
Answer:
(i)
(ii) BEP = \(\frac{\text { Fixed Cost }}{\text { Contribution perunit }}\) = \(\frac{32,000}{40}\)
= 800 units
Setup Cost (fixed for 2,000 units); 1 Production Run; ₹ 4,000/
Step Cost (fixed for 2,000 units); ₹ 4,000/-
Distribution Cost will have to be recovered on the basis of 30 units.
Let BEP (unit) – ‘K’
40 × K = ₹ 32,000 + ₹ 8,000 + \(\left(\frac{K}{30 \text { units }}\right)\) Boxes × ₹ 120
K = 1,111.11 units
Refining, 1,111.11 will have 37.03 boxes or say 38 boxes. The last box will cost ₹ 120 which is equivalent to contribution from 3 units. Hence, BEP is 1,114 units.
![]()
Question 18.
A Company produces three products P, Q and R for which the standard cost per unit and quantities produced are as under: (Nov 2017)
| Products | P | Q | R |
| Units produced and sold | 36,000 | 48,000 | 96,000 |
| Direct material cost per unit (₹) | 60 | 48 | 45 |
| Direct labour cost per unit (₹) | 30 | 24 | 18 |
| Machine hours per unit (hours) | 0.50 | 0.40 | 0.30 |
Total production overheads are absorbed on machine hour basis. The rate is 60 per machine hour.
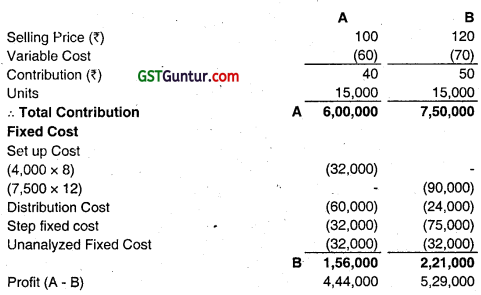
The Company has analysed its operations and determined that five activities act as cost drivers for overheads. Data relating to five activities are given below:
| Activity Area | Cost driver | Cost of each activity as % of total production overhead cost |
| Store receiving | Number of requisitions | 25% |
| Machine set up | Number of set ups | 20% |
| Machine running | Machine hours worked | 25% |
| Packing | Packing time in hours | 16% |
| Storage | Area in square metres | 14% |
![]()
The investigation into the production overhead activities for the period revealed the foIlowing:
| Activity | P | Q | R |
| Number of requisitions | 1,200 | 1,500 | 3,900 |
| Number of machine set ups | 60 | 120 | 320 |
| Packing hours | 3,000 | 4,800 | 10,200 |
| Storage (Sq metres) | 10,800 | 12,000 | 19,200 |
Required:
(i) Calculate total production overheads.
(ii) Prepare product cost statement showing per unit cost under traditional absorption costing method.
(iii) Calculate the cost driver rates.
(iv) Prepare product cost statement showing per unit cost under activity based costing method.
(v) What is the difference in costs due to adoption of traditional absorption
costing method and activity based costing method? (10 marks)
Answer:
(i) Total Machine Hours and Production Overhead
| P | R | R | Total |
| 36000 × 0.5 = 18000 hours | 48000 × 0.4 = 19200 hours | 96000 × 0.3 = 28800 hours | 66000 hours |
So, total Production Overheads = 66000 hrs × ₹ 60 = ₹ 39,60,000
(ii) Computation of ABC Rates
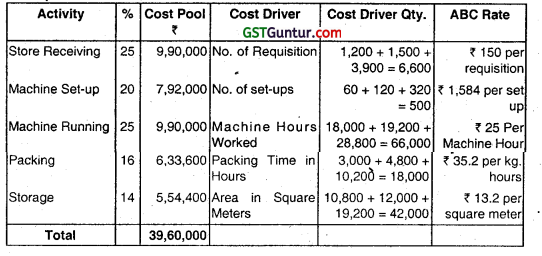
(iii) Overhead Cost Allocation using ABC Rates (₹)
![]()
(iv) Statement of Cost
| Particulars | P | Q | R |
| (a) Direct Material per unit (Given) | 60 | 48 | 45 |
| (b) Direct Labour per unit (Given) | 30 | 24 | 18 |
| (c) Prime Cost per unit (a + b) | 90 | 72 | 63 |
| (d) Overhead Cost per unit under Traditional System (hr × ₹ 60) | 0.5 × 60 = 30.00 | 0.4 × 60 = 24.00 | 0.3 × 60 = 18.00 |
| (e) Total Cost per unit under Traditional System (c + d) | 120 | 96 | 81 |
| (f) Overhead Cost per unit under ABC – System (as per – 3) | 22.03 | 21.47 | 22.25 |
| (g) Total Cost per unit under ABC System (c + f) | 112.03 | 93.47 | 85.25 |
| (h)Difference between Traditional & ABC System (e – g) | 7.97 | 2.53 | -4.25 |
| (i) Effect under Traditional System | Over Costed | Over Costed | Under Costed |
![]()
Question 19.
Fast Cook Ltd., is a pressure cooker manufacturing company doing business through wholesalers and retailers. The company is following Activity Based Costing system. Average cost per cooker is ₹ 600 and the listed price is ₹ 1000. But cookers are sold at a discount of 25% on listed price on orders for above 200 units and at a discount of 20% on orders for 200 units or less.
The company wants to analyse the profitability of two of its wholesale customers A and B and two of its retail customers X and Y on the basis of the business with them during last year. This is to explore the opportunities to increase the profitability from the customers. The relevant data pertaining to the last year are given below : (Nov 2018)
| Customer | A | B | X | Y |
| No. of purchase orders | 50 | 65 | 230 | 270 |
| No. of cookers purchased per order | 500 | 300 | 40 | 30 |
| No. of visits to customers place | 10 | 15 | 25 | 22 |
| No. of ordinary deliveries | 45 | 50 | 175 | 200 |
| No. of speed deliveries | 5 | 15 | 50 | 65 |
![]()
The activity, cost driver and the rate are as follows:
| Activity | Cost Driver | Cost per unit of Driver |
| Order processing | No. of purchase orders | 1300 |
| Visiting customers | No. of customers visited | 7400 |
| Ordinary delivery | No. of ordinary deliveries | 2000 |
| Speed delivery | No. of speed deliveries | 6000 |
Required:
(i) Evaluate the customer profitability by calculating the profit per cooker from each customer. (12 marks)
(ii) Recommend steps to be taken to improve profitability from less profitable customers. (4 marks)
(iii) List down the service organisations for which customer profitability analysis is useful. (2 marks)
(iv) Explain the specific benefits of customer profitability analysis. (2 marks)
Answer:
(i) Statement of customer profitability by calculating profit per cooker
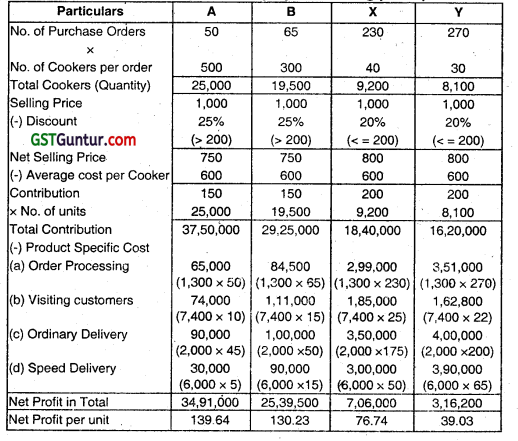
- Evaluation in Customer Profitability is more on the basis of the Product specific cost as the Contribution Largely remains same in all products.
- Evaluation of Wholesale Customers :
Customer A is more profitable as it results in higher profit ON- OVERALL & PER UNIT BASIS. Customer B should check out for its speed deliveries as it is almost 3 times that of A, resulting in high cost for itself. - Evaluation of Retail Customers :
Here, Customer X is more profitable, because of higher units sold and lower cost in order processing, ordinary and special deliveries.
![]()
(ii) In many organisations, different customers or groups of customers differs in profitability and CPA is a relatively new technique that ABC makes possible because it creates cost pool for activities.
Service Organisations, such as a bank or a hotel, in particulars need to cost customers. A bank’s activities for a customer will include the following types of activities :
- Withdrawal of cash
- Unauthorized overdraft
- Request for a statement
- Stopping a cheque
- Returning a cheque because of insufficient funds.
Different customers or categories of customers will each use different amounts of these activities and so customer profitability profiles can be built up and customers can be charged according to the cost to serve them. A hotel may have activities that are provided for specific types of customers such as well laid – out gardens, a swimming pool and a bar.
Older guests may appreciate and use the garden, families use the swimming pool and business guests use the bar. If the activities are charged to the relevant guests a correct cost per bed occupied can be calculated for this type of category. This will show the relative profitability and lead to strategies for encouraging the more profitable guests.
![]()
(iii) Service Organisations for which CPA is useful is :
- Hotel
- Bank
- Hospital
- Transport Industry
(iv) Benefits of Customer Profitability Analysis :
- It helps the supplier to identify which customers are eroding overall profitability and which customers are contributing to it.
- It can help to provide a basis for constructive dialogue between buyer and seller to improve margins.