This Statistical Description of Data – CA Foundation Statistics Notes is designed strictly as per the latest syllabus and exam pattern.
Statistical Description of Data – CA Foundation Statistics Notes
Previous Year Exam Questions
Question 1.
The quickest method to collect primary data is: [1 Mark, Nov. 2006]
(a) Personal Interview
(b) Indirect Interview
(c) Mailed Questionnaire Method
(d) Telephonic Interview
Solution:
(d) Telephonic Interview
Question 2.
Which of the following statement is true? [1 Mark, Nov. 2006]
(a) Statistics is derived from the French word ‘Statistik’
(b) Statistics is derived from the Italian word ‘Statista’
(c) Statistics is derived from the Latin word ‘Statistique’.
(d) None of these
Solution:
(b) Statistics is derived from the Italian word ‘Statista’
![]()
Question 3.
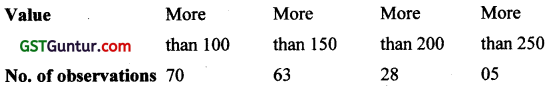
The following data relates to the incomes of 90 persons: [1 Mark, Nov. 2006]

What is the percentage of persons earning more than ₹ 2,500 ?
(a) 45
(b) 50
(c) 52
(d) 55
Solution:
(b) 50
No. of persons having income more than ₹ 2500 = 20 + 25 = 45
% of persons having income more than ₹ 2500 = \(\frac{45}{90}\) × 100 = 50%
Question 4.
In tabulation, source of data, if any is shown in the : [1 Mark, Feb. 2007]
(a) Stub
(b) Body
(c) Caption
(d) Footnote
Solution:
(d) Footnote
Question 5.
Divided bar chart is good for : [(1 Mark) Feb. 2007]
(a) Comparing various components of a variable
(b) Relating the different components to the whole.
(c) (a) and (b)
(d) (a)or(b)
Solution:
(c) (a) and (b)
Question 6.
Relative frequency for a particular class lies between: [(1 Mark) May 2007]
(a) 0 and 1
(b) 0 and 1, both inclusive
(c) -1 and 0
(d) -1 and 1
Solution:
(a) 0 and 1
Relative frequency \(=\frac{\text { Frequency of the Class Interval }}{\sum f}\)
It always lies between 0 and 1.
Question 7.
Find the number of observations between 350 and 400 from the following data: [1 Mark, May 2007]

(a) 13
(b) 15
(c) 17
(d) 19
Solution:
(a) Number of observations lying between 350 and 400 = 25 – 12 = 13
![]()
Question 8.
When the width of all classes is same, frequency polygon has not the same area as the Histogram: [1 Mark, May 2007]
(a) False
(b) True
(c) Both
(d) None
Solution:
(a) When the width i.e. size i.e. length of all classes has same frequency polygon has same area as the histogram.
Question 9.
The graphical representation of a cumulative frequency distribution is called: [1 Mark, May 2007]
(a) Histogram
(b) Ogive
(c) Both
(d) None
Solution:
(b) Ogive
Question 10.
A table has ____ parts: [1 Mark, Aug. 2007]
(a) Four
(b) Two
(c) Five
(d) None
Solution:
(c) Five
A table has five parts namely:
- Stub
- Caption
- Body
- Box head
- Footnote.
Question 11.
Cost of sugar in a month under the heads raw materials, labour, direct production and others were 12, 20, 35 and 23 units respectively, What is the difference between the central angles for the largest and smallest components of the cost of sugar? [1 Mark, Aug. 2007; June 2012]
(a) 72°
(b) 48°
(c) 56°
(d) 92°
Solution:
(d) 92°
Total cost of sugar = (12 + 20 + 35 + 23) units = 90 units
Value of Largest component = 35 units
Value of Smallest component = 12 units
Difference between their central angles = \(\frac{35-12}{90}\) × 360° = 92°
![]()
Question 12.
Frequency density corresponding to a class interval is the ratio of: [1 Mark, Aug. 2007]
(a) Class Frequency to the Total Frequency
(b) Class Frequency to the Class Length
(c) Class frequency to the Class Frequency
(d) Class Frequency to the Cumulative Frequency.
Solution:
(b) Class Frequency to the Class Length
Frequency density = \(\frac{f}{i}\)
Question 13.
In order to compare two or more related series, we consider: [1 Mark, Nov. 2007]
(a) Multiple Bar Chart
(b) Grouped Bar Chart
(c) (a) or (b)
(d) (a) and (b)
Solution:
(d) (a) and (b)
(d) Multiple Bar Chart also known as Grouped Bar Chart
Question 14.
An area diagram is: [1 Mark, Nov. 2007]
(a) Histogram
(b) Ogive
(c) Frequency Polygon
(d) None of these
Solution:
(a) Histogram
Question 15.
Most extreme value which would ever be included in a class interval are called: ’ [1 Mark, Nov. 2007]
(a) Class Interval
(b) Class Limits
(c) Class Boundaries
(d) None of these
Solution:
(c) Class Boundaries
(c) Most extreme values which would be ever included in a class-interval are called as class boundaries.
Question 16.
In 2000, out of total of 1,750 workers of a factory 1,200 were members of a trade union. The number of women employed was 200 of which 175 did not belong to a trade union. In 2004, there were 1,800 employees who belong to a trade union 5 0 who did not belong to trade union. Of all the employees in 2004,300 were women of whom only 8 were non-trade members. On the basis of this information, the ratio ; of female member of the trade union in 2000 and 2004 is : [1 Mark, Nov. 2007]
(a) 292 : 25
(b) 8 : 175
(c) 175 : 8
(d) 25 : 292
Solution:
(d) 25 : 292
Box Head / Title : Sex distribution of Trade Union and Non-union members.
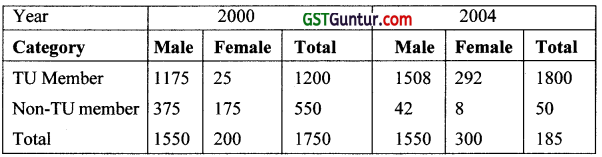
Required ratio of female members of the trade union in years 2000 & 2004 = 25 :292
TU Means – Trade union
Question 17.
The lower class boundary is: [1 Mark, Feb. 2008]
(a) An upper limit to lower class limit
(b) A lower limit to lower class limit
(c) Both (a) & (b)
(d) None of these
Solution:
(b) A lower limit to lower class limit
Question 18.
The distribution of profits of a company follows: [1 Mark, Feb. 2008]
(a) J-shaped frequency curve
(b) U-shaped frequency curve
(c) Bell- shaped frequency curve
(d) Any of these
Solution:
(c) Bell- shaped frequency curve
![]()
Question 19.
Out of 1000 persons, 25 per cent were industrial workers and the rest were agricultural workers. 300 persons enjoyed world cup matches on T.V. 30 per cent of the people who had not watched world cup matches were industrial workers. What is the number of agricultural workers who had enjoyed world cup matches on TV ? [1 Mark, Feb. 2008]
(a) 230
(b) 250
(c) 240
(d) 260
Solution:
(d) 260
| Category | T.V | NTV | TOTAL |
| Agricultural workers | 260 | 490 | 750 |
| Industrial workers | 40 | 210 | 250 |
| Total | 300 | 700 | 1000 |
Therefore, total number of agricultural workers who enjoyed world Cup on T.V = 260
Question 20.
Median of a distribution can be obtained from: [1 Mark, Feb. 2008]
(a) Histogarm
(b) Frequency Polygon
(c) Less than type ogives
(d) None of these
Solution:
(c) Less than type ogives
Question 21.
In indirect oral investigation: [1 Mark, June 2008]
(a) Data is not capable of numerical expression
(b) Not possible or desirable to approach informant directly.
(c) Data is collected from the books
(d) None of these
Solution:
(b) Not possible or desirable to approach informant directly.
Question 22.
Circular diagram are always: ‘ [1 Mark, June 2008]
(a) One-dimensional
(b) Two-dimensional ‘
(c) Three-dimensional
(d) Cartograms
Solution:
(b) Two-dimensional ‘
Question 23.
The column headings of a table are known as: [1 Mark, June 2008]
(a) Body
(b) Stub
(c) Box-head
(d) Caption
Solution:
(d) Caption
Caption explain, what the figures in the columns represent.
These column headings of a table are known as caption.
Question 24.
Some important sources of secondary data are ______ [Mark, June 2008]
(a) International and Government sources
(b) International and primary sources
(c) Private & primary sources
(d) Government sources
Solution:
(a) International and Government sources
Some important sources of secondary data are:-
- International Source: WHO, World Bank etc.
- Government Sources : RBI etc.
Question 25.
From the following data find the number of class intervals if class length is given as 5.
73, 72, 65, 41, 54, 80, 50, 46, 49, 53, [1 Mark, Dec. 2008]
(a) 6
(b) 5
(c) 7
(d) 8
Solution:
(d) 8
Since; Range = Maximum value( L) – Minimum value( S) = 80 – 41 = 39
Class length = 5
No. of class intervals \(=\frac{\text { Range }}{i}\) = \(\frac{39}{5}\) = 7.8 = 8 [because it is always next integer]
Where i = Length of class – interval
![]()
Question 26.
Which of the following is a statistical data ? [1 Mark, Dec. 2008]
(a) Ram is 50 years old
(b) Height of Ram is 5’6” and of Shyam and Hari is 5’3” and 5’4” respectively
(c) Height of Ram is 5’6” and weight is 90 kg
(d) Sale of A was more than B and C
Solution:
(b) Height of Ram is 5’6” and of Shyam and Hari is 5’3” and 5’4” respectively
Question 27.
Sales of XYZ Ltd. for 4 months is: [1 Mark, Dec. 2008]
| Months | Sales |
| Jan. | 10,000 |
| Feb. | 15,000 |
| May. | 18,000 |
| Apr. | 9,000 |
The above data represents :
(a) Discrete
(b) Continuous
(c) Individual
(d) None of these
Solution:
(c) The given data shows unclassified and ungrouped data. Hence the given series is an individual series.
Question 28.
Mid value are also called _______ [1 Mark, June. 2009]
(a) Lower limit
(b) Upper limit
(c) Class mark
(d) None
Solution:
(c) Class mark
Mid-values are also called class mark.
Class Marks = (Lower class limit + Upper class limit)/2
Question 29.
Which of the following is not a two dimensional figure? [1 Mark, June 2009]
(a) Line Diagram
(b) Pie Diagram
(c) Square Diagram
(d) Rectangle Diagram
Solution:
(a) Line Diagram
It has only length.
Question 30.
Less than type and more than type Ogives meet at a point known as: [1 Mark, June 2009]
(a) Mean
(b) Median
(c) Mode
(d) None
Solution:
(b) Median
Question 31.
Arrange the dimensions of Bar diagram, Cube diagram, Pie diagram in sequence. [1 Mark, Dec. 2009 ; June 2011]
(a) 1, 2, 3
(b) 2, 1, 3
(c) 2, 3, 2
(d) 3, 2, 1
Solution:
(c) 2, 3, 2
Bar diagram : – has length and breadth, so two dimensional.
Cube diagram: – has length, breadth and height and hence it is three-dimensional.
Pie-diagram : Its area can be obtained. Hence two-dimensional
Therefore,if we arrange it in sequence we get Pie-diagram; Bar, diagram and Cube-diagram i.e. 2,3,2.
Question 32.
Nationality of a person is: [1 Mark, Dec. 2009]
(a) Discrete variable
(b) An attribution
(c) Continuous variable
(d) None
Solution:
(b) An attribution
![]()
Question 33.
If we plot less than and more than type cumulative frequency distribution then the graph plotted is- [1 Mark, Dec. 2009]
(a) Histogram
(b) Frequency curve
(c) Ogive
(d) None of these
Solution:
(c) Ogive
Question 34.
The primary rules that should be observed in classification [1 Mark, June 2010]
(i) As far as possible the class should be of equal width
(ii) The classes should be exhaustive
(iii) The classes should be unambiguously defined
Then which of the following is correct:
(a) Only, (i) and (ii)
(b) Only (ii) and (iii)
(c) Only (i) and (iii)
(d) all (i),(ii) and (iii)
Solution:
(b) Only (ii) and (iii)
Question 35.
Using Ogive curve, we can determine: [1 Mark, June 2010]
(a) Median
(b) Quartile
(c) Both(a) and (b)
(d) None
Solution:
(c) Both(a) and (b)
Question 36.
With the help of Histogram one can find:
(a) Mean
(b) Median
(c) Mode
(d) First quartile
Solution:
(c) Mode
Histogram is used to find Mode.
Question 37.
Mode can be obtained from [1 Mark, Dec. 2010]
(a) Frequency polygon
(b) Histogram
(c) Ogive
(d) All of the above
Solution:
(b) Histogram
Mode can be obtained from Histogram
Question 38.
The most appropriate diagram to represent the data relating to the monthly expenditure on different items by a family is [1 Mark, Dec. 2010]
(a) Histogram
(b) Pie-diagram
(c) Frequency polygon
(d) Line graph
Solution:
(b) Pie diagram
Question 39.
The data obtained by the internet are [1 Mark, Dec. 2010]
(a) Primary data
(b) Secondary data
(c) Both (a) and (b)
(d) None of these
Solution:
(b) Secondary data
Question 40.
The Statistical measure computed from the sample observations alone have been termed as [1 Mark, Dec. 2010]
(a) estimate
(b) Parameter
(c) Statistic
(d) Attribute
Solution:
(c) Statistic
Question 41.
When the two curves of Ogive intersect the point of intersection provides: [1 Mark, June 2011]
(a) First Quartile
(b) Second Quartile
(c) Third Quartile
(d) Mode
Solution:
(b) Second Quartile
![]()
Question 42.
Frequency Density can be framed as: [1 Mark, June 2011]
(a) Class frequency to the cumulative frequency
(b) Class frequency to the total frequency
(c) Class frequency to the class length
(d) Class length to the class frequency
Solution:
(c) Class frequency to the class length
Frequency Density (F.D) = Class frequency/Class Length
Question 43.
The Chronological classification of data are classified on the basis of : [1 Mark, June 2011]
(a) Attributes
(b) Area
(c) Time
(d) Class Interval
Solution:
(c) Time
Question 44.
Arrange the following dimension wise : Pie-diagram, bar-digram and cubic diagram. [1 Mark, June 2011]
(a) 1, 2, 3
(b) 3, 1, 2
(c) 3, 2, 1
(d) 2, 2, 3
Solution:
(d) 2, 2, 3
Question 45.
The frequency of class 20-30 in the following data is [1 Mark, Dec. 2011]
| Class | 0-10 | 10-20 | 20-30 | 30-40 | 40-50 |
| Cumulative Frequency | 5 | 13 | 28 | 34 | 38 |
(a) 5
(b) 28
(c) 15
(d) 13
Solution:
(c) 15
Frequency of class interval 20 – 30 = c.f. of 20 – 30 – c.f. of 10 – 20
= 28 – 13 = 15
Here the frequency of class “ 20 – 30 ” = 15
Question 46.
The Graphical representation by which median is calculated is called [1 Mark, Dec. 2011]
(a) Ogive Curve
(b) Frequency Curve
(c) Line diagram
(d) Histogram
Solution:
(a) Ogive Curve
The median is calculated by Ogive Curve
Question 47.
Which of the following is not a two dimensional diagram? [1 Mark, Dec. 2011]
(a) Square diagram
(b) Line diagram
(c) Rectangular diagram
(d) Pie-chart
Solution:
(b) Line diagram
Line diagram is not two dimensional diagram because it has only length.
Question 48.
From which graphical representation, we can calculate partition values ? [1 Mark, Dec. 2012]
(a) Lorenz curve
(b) Ogive curve
(c) Histogram
(d) None of the above
Solution:
(b) Ogive curve
We can calculate Partition values with the help of Ogive Curve.
Question 49.
The data given below refers to the marks gained by a group of students: [1 Mark, June 2012]
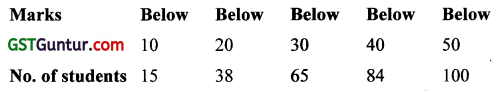
Then the No. of students getting marks more than 30 would be _____.
(a) 50
(b) 53
(c) 35
(d) 62
Solution:
(c) 35
It is cumulative frequency data.
The No. of students getting marks more than 30 = 100 – 65 = 35
![]()
Question 50.
Cost of sugar in a month under the heads raw materials, labour, direct production and others were 12,20,35 & 23 units respectively. The difference between their central angles for the largest & smallest components of the cost of Sugar is [1 Mark, June 2012]
(a) 92°
(b) 72°
(c) 48°
(d) 56°
Solution:
(a) 92°
Total = 90
Angle difference = \(\frac{35-12}{90}\) × 360° = 92°
Question 51.
What is a exclusive series ? [1 Mark, Dec. 2012]
(a) In which both upper and lower limit are not included in class frequency.
(b) In which lower limit is not included in class frequency.
(c) In which upper limit is not included in class frequency
(d) None of the above
Solution:
(c) In which upper limit is not included in class frequency
In exclusive series,upper limit is not included in class frequency.
Question 52.
A pie diagram used to represent the following data _____
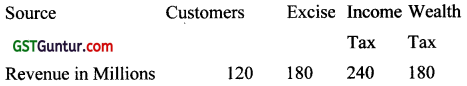
The central angles corresponding to Income Tax and Wealth Tax are
(a) 90°, 120°
(b) 120°, 90°
(c) 60°, 120°
(d) 90°, 60°
Solution:
(b) 120°, 90°
(b) is correct Total Revenue = 720
Central Angle for Income-tax = \(\frac{240}{720}\) × 360° = 120°
Central Angle for Wealth Tax = \(\frac{180}{720}\) × 360 °= 90°
Question 53.
The pair of averages whose value can be determined graphically? [1 Mark, Dec. 2013]
(a) Mean & Median
(b) Mode & Mean
(c) Mode & Median
(d) None of the above
Solution:
(c) Mode & Median
(c) is correct.
Question 54.
The difference between upper limit and lower limit of a class is called: [1 Mark, Dec. 2013]
(a) Class Interval
(b) Class Boundaries
(c) Mid-value
(d) Frequency
Solution:
(a) Class Interval
Length of class- Interval
Question 55.
If the class intervals are 10 – 14, 15 – 19, 20 – 24, Then the first class boundaries are:
(a) 9.5 – 14.5
(b) 10 – 15
(c) 9 – 15
(d) 10.5 – 15.5
Solution:
(a) 9.5 – 14.5
(a) is correct
Since, D = 1 ∴ LCB = l1 – \(\frac{D}{2}\) = 10 – \(\frac{1}{2}\) = 9.5 ; UCB = l2 + \(\frac{D}{2}\) = 14 + \(\frac{1}{2}\) = 14.5
![]()
Question 56.
The following data related to the marks of group of students
| Marks | No. of students |
| More than 70% | 7 |
| More than 60% | 18 |
| More than 50% | 40 |
| More than 40% | 60 |
| More than 30% | 75 |
| More than 20% | 100 |
How many students have got marks less than 50%? [1 Mark, June 2014]
(a) 60
(b) 82
(e) 40
(d) 53
Solution:
(a) 60
(a) is correct.
No .of students scoring marks less than 50% = 100 – No. of students scoring more than 50%
= 100 – 40 = 60
Question 57.
To draw Histogram the frequency distribution should be [1 Mark, June 2014]
(a) Inclusive type
(b) Exclusive type
(c) Inclusive and Exclusive type
(d) None
Solution:
(b) Exclusive type
(b) is correct
Question 58.
“The Less than Ogive” is a: (1 Mark, June 2014)
(a) U-shaped curve
(b) i-shaped curve
(c) S- shaped curve
(d) Bell-shaped curve
Solution:
(b) i-shaped curve
(b) is correct.
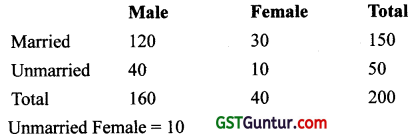
Question 59.
There were 200 employees in an office in which 150 were married. Total male employees were 160 out of which 120 were married. What was the number of female unmarried employees? [1 Mark, June 2014]
(a) 30
(b) 10
(c) 40
(d) 50
Solution:
(b) 10
(b) is correct.
Question 60.
The most appropriate diagram to represent 5 year plan outlay of India in different economic sectors is [1 Mark, Dec. 2014]
(a) Pie diagram
(b) Histogram
(c) Line diagram
(d) Frequency polygon
Solution:
(a) Pie diagram
(a) is correct
Question 61.
For construction of Histogram the class intervals of frequency distribution is [1 Mark, Dec. 2014]
(a) Equal
(b) Unequal
(c) Either Equal or Unequal
(d) None
Solution:
(a) Equal
(a) is correct
Question 62.
100 persons are divided into number of male/female and employed/unemployed it refers to [1 Mark, Dec. 2014]
(a) Cardinal Data
(b) Ordinal Data
(c) Spatial Data
(d) Temporal Data
Solution:
(b) Ordinal Data
(b) is correct
![]()
Question 63.
The number of observations between 150 and 200 based on the following data is: [1 Mark, June 2015]
(a) 46
(b) 35
(c) 28
(d) 23
Solution:
(b) 35
(b) is correct
No. of observation b/w 150 and 200 = 63 – 28 = 35.
Question 64.
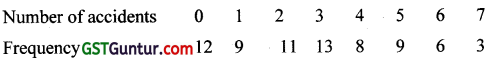
In how many cases 4 or more accidents occur ? [1 Mark, June 2015]
(a) 32
(b) 41
(c) 26
(d) 18
Solution:
(c) 26
(c) is correct
No. of 4 or more accidents = 8 + 9 + 6 + 3 = 26
Question 65.
The curve obtained by joining the points,whose X-coordinates are the upper limits of the class-intervals and Y-coordinates are the corresponding cumulative frequencies is called [1 Mark, June 2015]
(a) Ogive
(b) Histogram
(c) Frequency Polygon
(d) Frequency Curve
Solution:
(a) Ogive
Question 66.
Histogram is used for the presentation of the following type of series: [1 Mark, June 2015]
(a) Time series
(b) Continuous frequency series
(c) Discrete series
(d) Individual series
Solution:
(b) Continuous frequency series
Question 67.
The perpendicular line drawn from the intersection of two Ogives which touches at ____ point in X-axis. [1 Mark, June 2015]
(a) Median
(b) Mode
(c) Third quartile
(d) First quartile
Solution:
(a) Median
Question 68.
Which is most common diagrammatic representation for grouped frequency distribution. [1 Mark, June 2015]
(a) Histogram
(b) Ogive
(c) Both (a) & (b)
(d) None of these
Solution:
(a) Histogram
(a) is correct.
Question 69.
Classification is of ____ kinds: [1 Mark, June 2015]
(a) One
(b) two
(c) three
(d) Four
Solution:
(d) Four
(d) is correct.
![]()
Question 70.
Quartiles can be found through which graph? [1 Mark, June 2015]
(a) Ogive
(b) Histogram
(c) Frequency polygon
(d) Frequency curve
Solution:
(a) Ogive
(a) is correct.
Question 71.
The chart that user Logarithm of the variable is known as: [1 Mark, June 2015]
(a) Line chart
(b) Ratio chart
(c) Multiple line chart
(d) Component line chart
Solution:
(b) Ratio chart
(b) is correct.
Question 72.
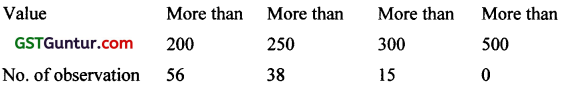
Find the number of observations between 250 and 300 from the following data: [1 Mark, June 2015]
| Value | More than 200 | More than 250 | More than 300 | More than 350 |
| No. of obs. | 56 | 38 | 15 | 0 |
(a) 56
(b) 23
(c) 15
(d) 8
Solution:
(b) 23
(b) is correct.
No. of observations = 38 – 15 = 23
Question 73.
Data collected on religion from the census reports are [1 Mark, June 2016]
(a) Primary data
(b) Secondary data
(c) Sample data
(d) (a) or (b)
Solution:
(b) Secondary data
Question 74.
Different modes of presentations of data are [1 Mark, Dec. 2016]
(a) Textual
(b) Tabular
(c) Both (a) & (b)
(d) None
Solution:
(c) Both (a) & (b)
(c) is correct
Question 75.
For construction of Histogram the class intervals of frequency distribution is [1 Mark, Dec. 2016]
(a) Equal
(b) Unequal
(c) Either Equal or Unequal
(d) None
Solution:
(a) Equal
(a) is correct.
Question 76.
In ____ method(s) information can be gathered by the researcher himself by contacting the interviewee [1 Mark, Dec. 2016]
(a) Personal Interview
(b) Telephone Interview
(c) Both (a) & (b)
(d) Indirect oral
Solution:
(c) Both (a) & (b)
(c) is correct.
Question 77.
Profits made by XYZ Bank in different years refers to _____ [1 Mark, Dec. 2016]
(a) Attribute
(b) Discrete variable
(c) Continuous variable
(d) None
Solution:
(c) Continuous variable
(c) is correct because Blue Chips company’s profit always increases.
Question 78.
The intersection of point of less than Ogive and more than Ogive gives [1 Mark, June 2017]
(a) Mean
(b) Mode
(c) Median
(d) None
Solution:
(c) Median
![]()
Question 79.
Which of the following diagram is appropriate to represent the various heads in total cost ? [1 Mark, June 2017]
(a) Bar graph
(b) Pie chart
(c) Multiple line chart
(d) Scatter plot
Solution:
(b) Pie chart
Question 80.
Frequency density corresponding to a class interval is the ratio of [1 Mark, June 2017]
(a) Class frequency to the class length
(b) Class frequency to the total frequency
(c) Class length to the class frequency
(d) Class frequency to the cumulative frequency
Solution:
(a) Class frequency to the class length
Question 81.
Stub of a table is the : [1 Mark, Dec. 2017]
(a) Right part of the table describing the columns
(b) Left part to the table describing the columns
(c) Right part of the table describing the row
(d) Left part of the table describing the rows
Solution:
(d) Left part of the table describing the rows
Question 82.
Pie diagram is used for : [1 Mark, June 2018]
(a) Comparing different components and their relation to the total
(b) Representing quantitative data in circle
(c) Representing qualitative data in a circle
(d) Either (b) or (c)
Solution:
(a) Comparing different components and their relation to the total
Question 83.
Find the number of observation between 250-300 from the following data: [1 Mark, June 2018]
(a) 38
(b) 23
(c) 15
(d) None of these
Solution:
(b) 23
No. of obs. = 38 – 15 = 23
Question 84.
The graphical representation of median can be found by using : [1 Mark, June 2018]
(a) Frequency polygon
(b) Histogram
(c) Ogives
(d) Frequency curve
Solution:
(c) Ogives
Question 85.
Frequency density is used in the construction of [1 Mark, May 2018]
(а) Histogram
(b) Ogive
(c) Frequency polygon
(d) None when the classes are of unequal width
Solution:
(а) Histogram
![]()
Question 86.
Divided Bar Chart is considered for [1 Mark, May 2018]
(a) Comparing different components of a variable
(b) The relation of different components to the table
(c) (a) or (b)
(d) (a) and (b)
Solution:
(d) (a) and (b)
Question 87.
The following frequency distribution
| X: | 12 | 17 | 24 | 36 | 45 |
| Y: | 2 | 5 | 3 | 8 | 9 |
is classified as: [1 Mark, Nov. 2018]
(a) Discrete distribution
(b) Continuous distribution
(c) Cumulative frequency distribution
(d) None of the above
Solution:
(a) Discrete distribution
Question 88.
Histogram is useful to determine graphically the value of [1 Mark, Nov. 2018]
(a) Arithmetic mean
(b) Mode
(c) Median
(d) None
Solution:
(b) Mode
Question 89.
Data are said to be ____ if the investigator himself is responsible for the collection of the data. [1 Mark, Nov. 2018]
(a) Primary data
(b) Secondary Data
(c) Mixed of primary and secondary data
(d) None
Solution:
(a) Primary data
Question 90.
A suitable graph for representing the portioning of total into sub parts in Statistics is [1 Mark, Nov. 2018]
(a) A pictograph
(b) A Pie Chart
(c) An Ogive
(d) Histogram
Solution:
(b) A Pie Chart
Question 91.
The number of times a particular items occurs in a class interval is called its [1 Mark, Nov. 2018]
(a) Mean
(b) Cumulative frequency
(c) Frequency
(d) None of the above
Solution:
(c) Frequency
Question 92.
An Ogive is a graphical representation of [1 Mark, Nov. 2018]
(a) Cumulative frequency distribution of
(b) Ungrouped data
(c) A frequency distribution
(d) None of the above
Solution:
(a) Cumulative frequency distribution of
Question 93.
| Class | 0-10 | 10-20 | 20-30 | 30-40 | 40-50 |
| Frequency | 4 | 6 | 20 | 8 | 3 |
For the class 20-30, cumulative frequency is
(a) 26
(b) 10
(c) 41
(d) 30
Solution:
(d) 30
∵ cf = 4 + 6 + 20 = 30
![]()
Question 94.
Which of the following graph is suitable for cumulative frequency distribution? [1 Mark, June 2019]
(a) ‘O’give
(b) Histogram
(c) G.M
(d) A.M
Solution:
(a) ‘O’give
Question 95.
Histogram can be shown as
(a) Ellipse
(b) Rectangle
(c) Hyperbola
(d) Circle
Solution:
(b) Rectangle
Question 96.
____ Series is continuous
(a) Open ended
(b) Exlusive
(c) Close ended
(d) Unequal call intervals
Solution:
(b) Exlusive
Question 97.
Ogive graph is used for finding
(a) Mean
(b) Mode
(c) Median
(d) None
Solution:
(c) Median
Question 98.
Histogram is used for finding
(a) Mode
(b) Mean
(c) First quartile
(d) None
Solution:
(a) Mode