Financial Analysis and Planning-Ratio Analysis – CA Inter FM Notes is designed strictly as per the latest syllabus and exam pattern.
Financial Analysis and Planning-Ratio Analysis – CA Inter FM Notes
1. Financial/Account Ratio:
A ratio is defined as “the indicated quotient of two mathematical expressions and as the relationship between two or more things.” Here ratio means financial ratio or accounting ratio which is a mathematical expression of the relationship between accounting figures.
2. Ratio Analysis:
Ratio analysis is a relationship expressed in mathematical terms between two individual figures or group of figures connected with each other in some logical manner and are selected from financial statements of the concern to draw conclusions about the performance (past, present and future), strengths & weaknesses of a firm and can take decisions in relation to the firm.
![]()
3. Types of Ratios:
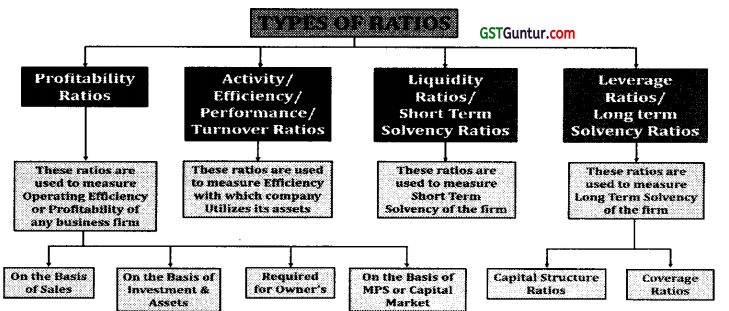
4. Profitability Ratios:
The profitability ratios measure the profitability or the operational efficiency of the firm. Profitability ratios are broadly classified in four categories:
- Profitability Ratios related to Sales.
- Profitability Ratios related to overall Return on Investment/Assets.
- Profitability Ratios required for Analysis from Owner’s Point of View.
- Profitability Ratios related to Market/Valuation/Investors.
(A) Profitability Ratios Related to Sales:
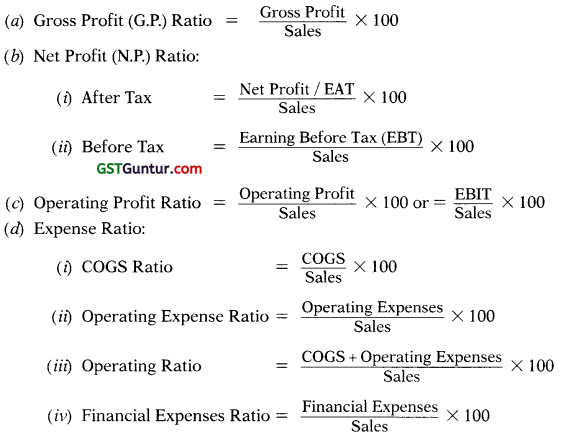
Note:
- Operating Expenses = Administration Expenses + Selling Expenses
- Sales must be excluding indirect tax (GST if any) and net of sales return.
![]()
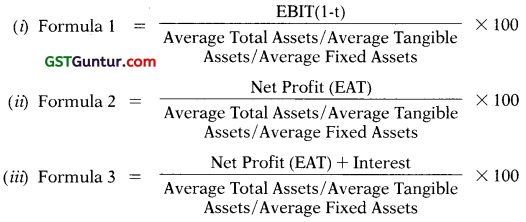
(B) Profitability Ratios Related to Overall Return on Investment or Assets:
(a) Return on Assets (RUA):
(b) Return on Capital Employed (ROCE):
- Pre Tax (Before Tax) = \(\frac{\text { EBIT }}{\text { Average Capital Employed }}\) × 100
- Post Tax (After Tax) = \(\frac{\text { EBIT }(1-t)}{\text { Average Capital Employed }}\) × 100
(c) Return on Equity (ROE) = \(\frac{\text { EAT }- \text { Preference Dividend }}{\text { Equity Shareholders’ Fund }}\) × 100
Note:
- Equity Share Holders Fund or Net Worth: Equity Share Capital + Reserve and Surplus – Fictitious Assets.
- Shareholders Fund or Owners Fund or Proprietors Fund: Equity Share Holders’ Fund + Preference Share Capital.
- Capital Employed:
Alternative 1: Liability Route: Shareholders Fund + Long Term Debt – Non Trade Investments – Capital WIP.
Alternative 2: Assets Route: Fixed Assets + Long Term trade Investments + Working Capital. - Total Assets must be excluding fictitious assets.
- If one figure is opted from P/L and another from Balance Sheet then average of Balance Sheet figure shall be taken if possible.
![]()
(C) Profitability Ratios Required For Analysis From Owner’s Point of View:
(a) Earnings Per Share (EPS) = \(\frac{\text { EAT }- \text { Preference Dividend }}{\text { No. of Equity Shares Outstanding }}\)
(b) Dividend Per Share (DPS) = \(\frac{\text { Equity Dividend }}{\text { No. of Equity Shares Outstanding }}\)
(c) Dividend Payout Ratio (DP) = \(\frac{\mathrm{DPS}}{\mathrm{EPS}}\) X 100
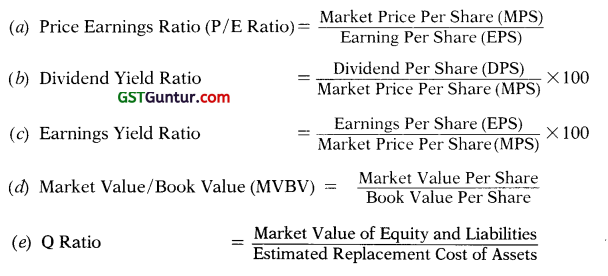
(D) Profitability Ratios Related to Market/Valuation/Investors:
5. Return on Equity (ROE) as per DuPont Model:
Return on Equity (ROE) = Net Profit Margin × Asset Turnover × Equity Multiplier
![]()
6. Activity/Efficiency/Performance/Turnover Ratios: These ratios are employed to evaluate the efficiency with which the firm manages and utilises its assets.
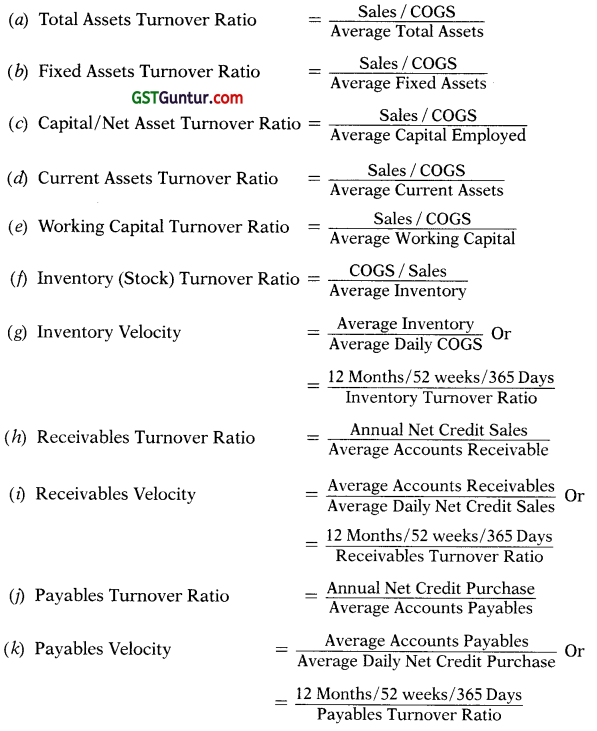
Note:
- Sales must be excluding indirect tax (GST if any) and net of sales return.
- Total Assets must be excluding fictitious assets.
- If one figure is opted from P/L and another from Balance Sheet then average of Balance Sheet figure shall be taken if possible.
- In case of Stock Turnover Ratio = COGS is preferred
- In case of Receivable turnover ratio:
- Credit Sales net of Return including GST is used
- Debtors before Bad debt or Provision for Doubtful debt is used
![]()
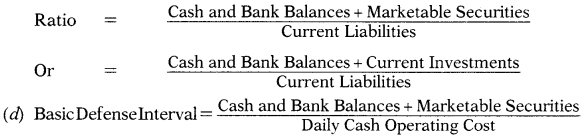
7. Liquidity/Short Term Solvency Ratios: These ratios are used to measure short term solvency of the firm.
(a) Current Ratio = \(\frac{\text { Current Assets }}{\text { Current Liabilities }}\)
(b) Quick / Acid test / Liquid Ratio = \(\frac{\text { Quick / Liquid Assets }}{\text { Current Liabilities }}\)
Quick Assets or Liquid Assets = Current Assets – Stock (All) – Prepaid
(c) Cash Ratio/Absolute Liquidity
(e) Net Working Capital Ratio = Current Assets – Current Liabilities (Excluding short term bank borrowing)
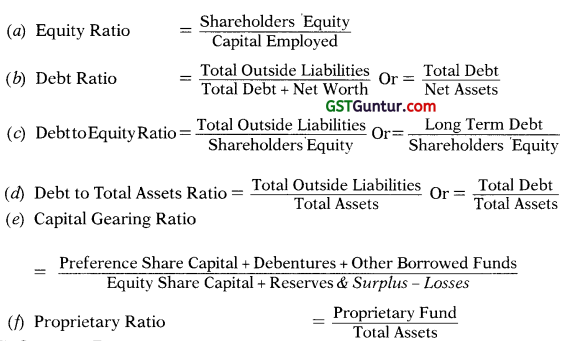
8. Long Term Solvency Ratios/Leverage Ratios: These ratios are used to measure long term solvency (stability) and structure of the firm.
(A) Capital Structure Ratios:
![]()
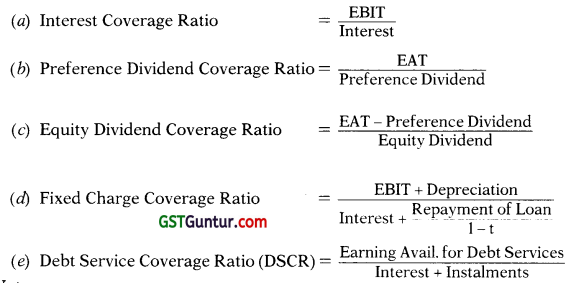
(B) Coverage Ratios:
Note:
- Equity Share Holders Fund or Net Worth: Equity Share Capital + Reserve and Surplus – Fictitious Assets.
- Shareholders’ Equity or Shareholders Fund or Owners Fund or Proprietary Fund: Equity Share Holders’ Fund + Preference Share Capital.
- Total Debt or Total Outside Liabilities includes Short and Long term borrowings.
- Total Assets must be excluding fictitious assets.