Cost Management Techniques – CA Final SCMPE Question Bank is designed strictly as per the latest syllabus and exam pattern.
Cost Management Techniques – CA Final SCMPE Question Bank
Question 1.
Distinguish between Cost Reduction and Cost Control. (June 2015, 7 marks) (CMAFG III]
Answer:
Difference between Co Reduction and Cost Control:
| Particulars | Cost Reduction | Cost Control |
| 1. Permanence | Permanent, Real and reflects genuine savings in cost. | Represents efforts made towards achievement of predetermined target or goal. |
| 2. Nature of function | It is a corrective function. It can operate along with an efficient cost control system. This concept Believes that there is always a scope for further reduction in costs. | It is a preventive function, where costs are optimized before these are incurred. |
| 3. Nature of process | It presumes the existence of concerned potential savings in norms or standards and therefore it is a corrective process. | It does not focus on costs independent of revenue nor considers product attributes as given. It is a holistic control process. |
| 4. Performance evaluation | It is not concerned with maintenance of performance according to standards. | The process involves setting up a target, investigating variances and taking remedial measures to correct them. |
| 5. Nature of Standards | Continuous process of critical examination includes analysis and challenge of standards. It assumes the existence of potential savings in the standards and aims at improving them by bringing out more savings. | It accepts the standards, once they have been fixed. In other words, standards shall remain, as it is. |
| 6. Dynamism | Fully a dynamic approach. | It is a routine exercise and lacks dynamic approach. |
| 7. Coverage | Universally applicable to all areas of business. Does not depend upon standards, though target amounts may be set. | Limited applicability to those items of cost for which standards can be set. |
| 8. Basic approach | It is not concerned with maintenance of performance according to standards. It challenges the very standards set. | It involves setting up a target, ascertaining the actual performance and doing the variance analysis, followed by remedial actions. |
![]()
Question 2.
Explain the essential features of Life-cycle costing. (May 2009, 5 marks)
Answer:
Life-cycle Costing
Meaning: Life cycle costing estimates, tracks and accumulates the costs over a product’s entire life cycle from its inception to abandonment or from the initial R & D stage till the final customer servicing and support of the product. It aims at tracing of costs and revenues on product by product basis over several calendar periods throughout their life cycle.
Costs are incurred along the product’s life cycle starting from product’s design, development, manufacture, marketing, servicing and final disposal. The objective is to accumulate all the costs over a product life cycle to determine whether the profits earned during the manufacturing phase will cover the costs incurred during the pre and post manufacturing stages of product life cycle.
Features:
- Product life cycle costing involves tracing of costs and revenues of each product over the several calender periods throughout their entire life cycle.
- Product life cycle costing traces research and design and development costs and total magnitude of these costs for each individual product and compared with product revenue.
- Report generation for costs and revenues.
Benefits:
- The product life cycle costing results in earlier actions to generate revenue or to lower cost than otherwise might be considered.
- Better decision should follow from a more accurate and. realistic assessment of revenues and costs, at least within a particular life cycle stage.
- Product life cycle thinking can promote long-term rewarding in contrast to short – terms profitability rewarding.
- It provides an overall framework for considering total incremental costs over the life span of a product.
![]()
Question 3.
Answer the following:
Briefly explain the phases in the life cycle of a product. (Nov 2011, 4 marks)
Answer:
Phases in Life Cycle of a Product
| Phase | Characteristics |
| Introduction | Product is launched. Profits are almost non existent. Competition is almost negligible. |
| Growth | Sales/Profits rise rapidly. Competition enters. At phase end, profits begin to decline. |
| Maturity | Sales increases but at a declining rate. Some firms extend their product lines with new models. |
| Saturation and decline | Drop in sales” volume, need for product demand disappears. Better and cheaper substitutes are available in the market. |
![]()
Question 4.
Classify the following items under the more appropriate category: (May 2012, 4 Marks)
Category (CC)Cost Control Or Category (CR)- Cost Reduction.
(i) Costs exceeding budgets or standards are investigated.
(ii) Preventive function
(iii) Corrective function
(iv) Measures to standardize for increasing productivity
(v) Provision of proper storage facilities for materials.
(vi) Continuous comparison of actual with the standards set.
(vii) Challenges the standards set
(viii) Value analysis (4 marks)
Answer:
Classification of items under cost reduction/cost control
| Item | Category Cost Control (CC) Cost Reduction (CR) |
| (i) Costs exceeding budgets or standards are investigated | CC |
| (ii) Preventive function | CC |
| (iii) Corrective function | CR |
| (iv) Measures to standardize for increasing productivity | CR |
| (v) Provision of proper storage facilities for materials | CC |
| (vi) Continuous comparison of actual with the standards set | CC |
| (vii) Challenges the standards set | CR |
| (viii) Value analysis | CR |
![]()
Question 5.
Answer the following in brief:
What do you understand by the term “Life Cycle Cost? (June 2012, 5 marks) [MAFG III]
Answer:
It focuses on total cost (Capital cost + revenue cost) over the products life including design. CIMA defines life cycle costing as the practice of obtaining over life time, the best use of physical asset at the lowest cost of entity.
“The term “Life Cycle Cost” has been defined as follows, “It includes the cost associated with acquiring, using, caring for and disposing of physical asset including the feasibility studies, research, design, development, Production, maintenance, replacement and disposal as well as support, training and operating cost, generated by the acquisition use, maintenance and replacement of permanent physical assets.”
1. Life cycle costing estimates and accumulates costs over a product’s entire life cycle.
2. The objective is to determine whether costs incurred at different stages of development, (planning, designing and testing) manufacturing (conversion activities) and marketing (advertising distribution, and designing, and testing) manufacturing (conversion activities) and marketing (advertising distribution, warranty) of the product will be recovered by revenue to be generated by the product over its life cycle.
3. Life cycle costing provides an insight, useful for understanding and managing costs over the life cycle of the product.
4. In particular it helps to evaluate the viability of the product, decides on pricing of the product at different stage of product life cycle and often helps to estimate the value of the product to its user.
5. When used in conjunction with target costing, life cycle costing becomes an important tool for cost management.
6. Life cycle costing estimates and accumulates costs over a product’s entire life cycle in order to determine whether the profits earned during the manufacturing phase will cover the costs incurred during the pre-and post manufacturing stages.
![]()
7. Identifying the costs incurred during the different stages of product’s life cycle provides an insight into understanding and managing the costs incurred throughout its life cycle. In particular, Life cycle costing helps management to understand the cost consequences of developing and making a product and to identify areas in which cost reduction efforts are likely to be most effective.
8. Most accounting system report on a period-by-pdriod basis, and products are not monitored over their life cycles. In contrast product life cycle reporting involves tracing costs and revenue on a product-by-product basis over several calendar periods throughout their life cycle.
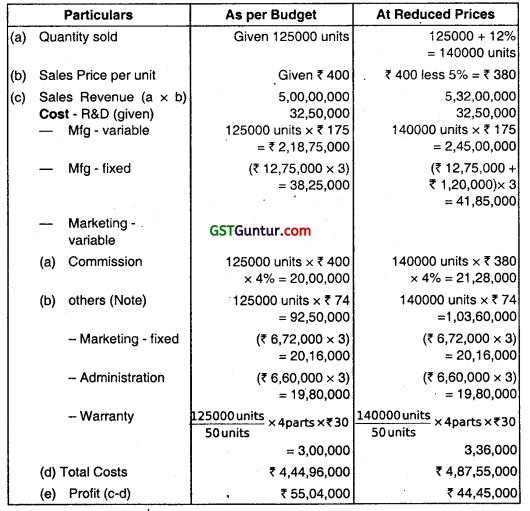
9. A Typical pattern of cost commitment and cost incurrence during the three stages of a product’s life cycle-the planning and design stage, the manufacturing stage and the service and abandonment stage.
10. Committed or locked in cost that have not been incurred but that will be incurred in the future on the basis of decisions that have already been made. Costs are incurred when resource is used or sacrificed.
11. Costing system record costs-only when they been incurred. It is difficult to significantly alter costs after they have been committed. For example the product design specifications determine a product’s material and labour inputs and the production process. At this stage costs become committed and broadly determine the future costs that will be incurred at the manufacturing stage.
12. That approximately 80% of a product’s costs are committed during the planning and design stage. At this stage product designers determine the product’s design and the production process. In contrast, the majority of costs are incurred at the manufacturing stage, but they have already become locked in at the planning and design stage and are difficult to alter.
![]()
Question 6.
Answer the following:
What is target costing? It is said that target costing fosters team work within the organisation. Explain how target costing creates an environment in which team work fosters. (Nov 2012, 4 marks)
Answer:
- Target cost is the difference between the estimated selling price of a proposed product with specified functionality and quality and target margin.
- This is a cost management technique that aims to produce and sell products that will ensure the target margin.
- It is an integral part of the product design. While designing the product the company allocates value and cost to different attributes and quality. Therefore, they use the technique of value engineering and value analysis.
- The target cost is achieved by assigning cost reduction targets to different operations that are involved in the production process.
- Eventually, all operations do not achieve the cost reduction targets, but the overall cost reduction target is achieved through team work. Therefore, it is said that target costing fosters team work.
![]()
Question 7.
Answer the following:
Briefly explain the phases in the life cycle of a product. (Nov 2014, 4 marks)
Answer:
Phases of the product life cycle : A project consist of sequential phases. These phases are extremely useful in planning a project since they provide a framework for budgeting, manpower and resource allocation and for scheduling project milestones and project reviews, the method of division of a project into phases may differ somewhat from industry to industry and product to product.
There are four phases of product life cycle :
- Introduction/Initialisation
- Growth
- Maturity
- Saturation and Decline
Phases in Life Cycle of a Product:
| Phase | Characteristics |
| Introduction | Product is launched. Profits are almost non-existent. Competition is almost negligible. |
| Growth | Sales/Profits rise rapidly. Competition enters. |
| Maturity | Sales increases but at a declining rate. Some firms extend their product lines with new models. |
| Saturation and Decline | Drop in sales volume, need for product demand disappears. Better and cheaper substitutes are available in the market. |
![]()
Question 8.
Answer the following:
State whether and why the following statements are valid or not valid: (Statements need not be copied into answer book.)
(i) Target costing is not applicable to a monopoly market.
(ii) Target costing ignores non-value added activities. (Nov 2015, 4 marks)
Answer:
(i) Statement is valid.
Reason: Target costing has been described as a process, that occurs in a competitive environment. It means in competitive environment, target costing is applicable, in monopoly market, target costing is not applicable.
(ii) Statement is valid.
Reason: The aim of target costing is to confine the total cost to set target and in order to achieve this figure, non value added activities are eliminated and hence ignored.
![]()
Question 9.
What are the criteria to be maintained by the companies which want to get maximum benefit from ‘target costing’? (Dec 2015, 4 marks) [CMAFG III]
Answer:
The following criteria are to be maintained by the companies who want to get maximum benefit from ‘target costing’:
- Assembly-oriented industries, as opposed to repetitive-process industries that produce homogeneous products.
- Industries involved heavily with the diversification of the product lines.
- Used technologies of factory automation, including computer-aided design, flexible manufacturing systems, office automation, computer-aided manufacturing etc.
- Have experienced shorter product life cycles where the pay-back for factor automation typically must be achieved in short-term period (less than eight years).
- Must develop the system for reducing costs during the planning, design and development stages of a PLC.
- Able for implementing management methods, such as Just-in-time. Value engineering and Total Quality Control.
![]()
Question 10.
State the business situations in which you recommend to apply Pareto Analysis. (May 2019, 5 marks)
Answer:
The Pareto Analysis is generally applicable to the following business situations:
1. Price of a Product:
In the case of a firm dealing with multi products, it would not be possible for it to analyse cost profit – price- volume relationships for all of them, fn practice, in case of such firm approximately 20% of products may account for about 80% of total sales revenue. Pareto Analysis is used for analysing the firm estimated sales revenues from various products and it might indicate that approximately 80% of its total sales revenue is earned from about 20% of its products.
Such analysis helps the top management to delegate the pricing decision for approximately 80% of its products to the lower levels of management, thus freeing themselves to concentrate on the pricing decisions for products approximately 20% which are essential for the company’s survival.
Thus, a firm can adopt more sophisticated pricing methods for small proportion of products that jointly accounts for approximately 80% of total sales revenue. For the remaining 80% of the products which account for 20% of total sales revenue the firm may use cost based pricing method.
2. Customer Profitability Analysis:
- Instead of analysing products, customers can be analysed for their relative profitability to the organisation.
- Again, it is often found that approximately 20% of customers generate 80% of the profit. There will always be some customers who are less profitable than others, just as some products are less profitable than others.
- Such an analysis is useful tool for evaluation of the portfolio of customer profile and decision making such as whether to continue serving a same customer group, what is the extent of promotion expenses to be incurred.
![]()
3. ABC Analysis – Stock control:
Another application of Pare to Analysis is in stock control where it may be found that only a few of the goods in stock make up most of the value. In practice, approximately 20% of the total quantity of stock may account for about 80% of its value. The outcome of such analysis is that by concentrating on small proportion of stock items that jointly accounts for 80% of the total value, a firm may well be able to control most of monetary investment in stocks.
4. Application is Activity Based Costing:
In Activity Based Costing it is often said that 20% of an organisation Cost Drivers are responsible for 80% of the total cost. By analysing, monitoring and controlling those cost drivers that cause most cost, a better control and understanding of overheads will be obtained.
5. Quality Control:
Pareto Analysis seeks to discover from an analysis of defect report or customer complaints which “vital few” causes are responsible for most of the reported problems.
Often, 80% of reported problems can usually be traced to 20% of the various underlying causes. By concentrating one’s efforts on rectifying the vital 20% , one can have the greatest immediate impact on product quality.
The Pareto Analysis indicates how frequently each type of failure (defect) occurs. The purpose of the analysis is to direct management attention to the area where the best returns can be achieved by solving most of quality problems, perhaps just with a single action.
![]()
Question 11.
UK Ltd. prepared a draft budget for the next year as follows: (May 2016, 5 Marks)
Quantity – 10,000 units
Selling price per unit – ₹ 60
Variable cost per unit
- Direct materials – 16
- Direct labour (2 hours × 6) – 12
- Variable overheads (2 hrs * ₹ 1) – 2
Contribution per unit – 30
Total budgeted contribution – 3,00,000
Total budgeted fixed overheads – 2,80,000
Total budgeted profit – 20,000
The board of directors are not satisfied with this draft budget and suggested the following changes for the better profit:
(i) The budgeted profit is ₹ 50,000,
(ii) The company should spend ₹ 57,000 on advertisement and the target sales price up to ₹ 64 per unit.
(iii) It is expected that the sales volume will also rise, inspite of the price rise, to 12,000 units.
In order to achieve the extra production capacity, however, the work force must be able to reduce the time taken to make each unit of the product. It is proposed to offer a pay and productivity deal in which the wages rate per hour is increased to ₹ 8. The hourly rate for variable overheads will be unaffected. You are required to calculate the target labour time require to achieve the target profit.
Answer:
Statement Showing ‘Target Cost of Direct Labour & Variable Overheads’
| Particulars | Amount (₹) |
| Expected Sales (₹ 64 × 12,000 units) | 7,68,000 |
| Less: Direct Material (₹ 16 × 12,000 units) | 1,92,000 |
| Advertisement Expenses | 57,000 |
| Fixed Overheads | 2,80,000 |
| Target Profit | 50,000 |
| Target Cost of Direct Labour and Variable Overheads | 1,89,000 |
Target Labour Time Required to achieve Target Profit
= \(\frac{\text { Target Cost of DirectLabour and Variable Overheads }}{\text { Wages Rate + Variable OverheadRate }}\)
= \(\frac{₹ 1,89,000}{₹ 8+₹ 1}\)
= 21,000 hrs.
![]()
Question 12.
A toy company T expects to successfully launch Toy Z based on a film character. T must pay 15% royalty on the selling price to the film company. T’s targets a selling price of ₹ 100 per toy and profit of 25% selling price. (May 2017, 4 Marks)
The following are the cost data forecast:
In addition, each toy requires 0.6 kg of other materials, which are supplied at a cost of ₹ 16 per kg with a normal 4% substandard quality which is not usable in the manufacture.
You are required to determine if the above cost structure is within the target cost. If not, what should be the extent of cost reduction?
Answer:
Statement Showing Target Cost “Z”
| ₹/ Toy | |
| Target Selling Price | 100.00 |
| Less: Royalty @ 15% | 15.00 |
| Less: Profit @ 25% | 25.00 |
| Target Cost | 60.00 |
![]()
Statement Showing Cost Structure “Z”
| ₹/ Toy | |
| Component A | 8.50 |
| Component B | 7.00 |
| Labour (0.40 hr. × ₹ 60 per hr.) | 24.00 |
| Product Specific Overheads | 13.50 |
| Other Material (0.6 kg./96% × ₹ 16) | 10.00 |
| Total Cost of Manufacturing | 63.00 |
Total cost of Manufacturing is ₹ 63 while Target Cost is ₹ 60. Company ‘T should make efforts to reduce its manufacturing cost by ₹ 3 to achieve Target Selling Price of ₹ 100.
![]()
Question 13.
SRM Ltd. has developed a new product ‘Kent’ which is about to be launched into the market and anticipates to sell 80,000 of these units at a sale pnce of ₹ 300 over the product’s life cycle of four years. Data pertaining to product ‘Kent’ are as follows: (June 2017, 8 marks) (CMAFG III)
| Costs of Design and Development of Moulding Dies and Other tools | ₹ 10,25,000 |
| Manufacturing costs | ₹ 125 per unit |
| Selling costs | ₹ 12,500 per year + ₹ 100 per unit |
| Administration costs | ₹ 50,000 per year |
| Warranty expenses | 5 replacement parts per 25 units at ₹ 10 per part, 1 visit per 500 units (cost ₹ 500 per visit) |
Required:
(i) Compute the product Kent’s Life Cycle Cost.
(ii) Suppose SRM Ltd. can increase sales volume by 25% through 15% decrease in selling price, should SRM Ltd. choose the lower price?
Answer:
Statement showing ‘Kent’s Life Cycle Cost (80,000 Units)
| Particulars | Amount (₹) |
| Costs of Design and Development of Moulds, Dies and other tools | 10,25,000 |
| Manufacturing Costs (₹ 125 × 80,000 units) | 1,00,00,000 |
| Selling Costs (₹100 × 80,000 units + ₹ 12,500 × 4) | 80,50,000 |
| Administration Costs (₹ 50,000 × 4) | 2,00,000 |
| Warranty: (80,000 units / 25 units × 5 parts × ₹ 10) (80,000 units / 500 units × 1 visit × ₹ 500) |
1,60,000 80,000 |
| Total cost | 1,95,15,000 |
![]()
Statement showing’Kent’s Life Cycle Cost (1,00,000 Units)
| Particulars | Amount (₹) |
| Costs of Design and Development of Moulds, Dies and other tools | 10,25,000 |
| Manufacturing Costs (₹125 × 1,00,000 units) | 1,25,00,000 |
| Selling Costs (₹ 100 × 1,00,000 units + ₹ 12,500 × 4) | 1,00,50,000 |
| Administration Costs (₹ 50,000 × 4) | 2,00,000 |
| Warranty: | |
| (1,00,000 units / 25 units × 5 parts × ₹10) | 2,00,000 |
| (1,00,000 units / 500 units × 1 visit × ₹ 500) | 1,00,000 |
| Total cost | 2,40,75,000 |
Statement showing “Kents Life Time Profit”
| Particulars | Amount (₹) 80,000 units | Amount (₹) 1,00,000 units |
| Sales | (80,000 × ₹ 300) 2,40,00,000 | (1,00,000 × ₹ 255) 2,55,00,000 |
| Less: Total Cost | 1,95,15,000 | 2,40,75,000 |
| Profit | 44,85,000 | 14,25,000 |
Decision: Reducing the, price by 15% will decrease profit by ₹ 30,60,000. Therefore, SRM Ltd. should not cut the price.
![]()
Question 14.
BCG Manufacturers sell their product at ₹ 1,000 per unit. Their competitors are likely to reduce the price by 15%. BCG Manufacturers want to respond aggressively by cutting price by 20% and expect that the present volume of 150000 units per annum will increase to 200000 units. BCGM want to earn a 10% target profit on sales. Based on a detailed value engineering, the comparative position is given below: (June 2017, 4 + 4 = 8 marks) [CMAFG III]
| Particulars | Existing (₹) | Target (₹) |
| Direct Material Cost per unit | 400 | 385 |
| Direct Labour Cost per unit | 55 | 50 |
| Direct machinery costs per unit | 70 | 60 |
| Direct Manufacturing expenses per unit | 525 | 495 |
| Manufacturing Overheads | ||
| No. of orders (₹ 80 per order) | 22,500 | 21,250 |
| Testing hours (₹ 2 per hour) | 45,00,000 | 30,00,000 |
| Units reworked (₹ 100 per unit) | 12,000 | 13,000 |
Manufacturing overheads are allocated using relevant cost drivers. Other operating costs per unit for the expected volume are estimated as follows:
![]()
Required:
(i) Calculate target costs per unit and target costs for the proposed volume showing break up of different elements.
(ii) Prepare target product profitability statement.
Answer:
Part 1:
Target Selling Price: ₹ 1000 less 20% – ₹ 800
Less: Target Profit Margin (10% of ₹ 800) – ₹ 80
Target Cost per unit ₹ 720
The breakup of the target cost per unit of ₹ 720 per unit is as follows:
| Direct Materials | 385 | |
| Direct Labour | 50 | |
| Direct Machinery costs | 60 | |
| Direct Manufacturing costs | 495 | |
| Add: Manufacturing Overheads: | ||
| Ordering and receiving (21,250 × ₹ 80)/2,00,000 | 8.50 | |
| Testing and Inspection (30,00,000 × ₹ 2)/2,00,000 | 30.00 | |
| Rework (13,000 × ₹ 100)/2,00,000 | 6.50 | 45 |
| Other Operating Costs: | ||
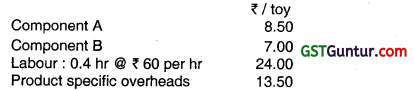
| Research and Design | 50 | |
| Marketing and Customer Service | 130 | 180 |
| Full Product Costs | 720 |
![]()
Part 2:
Target Product Profitability
| Particulars | Per Unit (₹) | Total for 200000 units (₹) |
| 1. Sales | 800 | 16,00,00,000 |
| 2. Cost of Goods Sold: | ||
| Direct Materials | 385 | 7,70,00,000 |
| Direct Labour | 50 | 1,00,00,000 |
| Direct Manufacturing Costs | 60 | 1,20,00,000 |
| 495 | 9,90,00,000 | |
| Manufacturing Overheads | 45 | 90,00,000 |
| 540 | 10,80,00,000 | |
| 3. Gross Margin (1-2) | 260 | 5,20, 00,000 |
| 4. Operating Costs: | ||
| Research and Design | 50 | 1,00,00,000 |
| Marketing and Customer Service | 130 | 2,60,00,000 |
| 180 | 3,60,00,000 | |
| 5. Operating Profit (3 – 4) | 80 | 1,60,00,000 |
![]()
Question 15.
MK international Ltd. has developed a new product ‘RIO’ which is to be launched soon. The company anticipates to sell 1,25,000 of these units at a sale price of ₹ 400 per unit over the product life cycle of three years. The other data pertaining to Product RIO are as under: (Nov 2017, 6 Marks)
| Research and development cost | ₹ 32,50,000 |
| Manufacturing cost per unit | ₹ 175 |
| Fixed manufacturing cost per year | ₹ 12,75,000 |
| Marketing cost per unit (including 4% commission on sales) | ₹ 90 |
| Fixed marketing cost per year | ₹ 6,72,000 |
| Administration cost | ₹ 6,60,000 per year |
| Warranty expenses | 4 replacement parts per 50 units at t 30 per part |
Calculate:
- The life cycle cost of the product ‘RIO’
- The revised life cycle cost if the MK international Ltd. increases sales by 12% through 5% reduction in sale price along with increase in fixed manufacturing cost by ₹ 1 ,20,000 per year.
- Should the company go for reduction in sale price?
Answer:
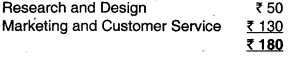
Calculation of Income Statement
Note: Marketing Cost per unit (given) is ₹ 90, of which commission as per Budget is 400 × 4% = 16.
Hence, other variable Marketing cost = 90 – 16 = 74 per unit, which will remain constant at reduced prices also.
Observation: Price Reduction decreases Profit by 55,04,000 – 44,45,000
= ₹ 10,59,000, and is hence not desirable.
![]()
Question 16.
MNP Co. Ltd. makes digital watches. The company is preparing a product life cycle budget for a new watch. Development on the new watch is to start shortly. Estimates for new watch are as under: (May 2018)
| Life Cycle units manufactured and sold | 2,40,000 |
| Selling Price Per Watch | (₹) 500 |
| Life Cycle Costs: | |
| R & D and design cost | (₹) 80 Lakh |
| Manufacturing: | |
| Variable Cost Per Watch | (₹) 120 |
| Variable Cost Per Batch | (₹) 4,000 |
| Watches Per Batch | 300 |
| Fixed Costs | (₹) 112 Lakh |
| Marketing: | |
| Variable Cost Per Batch | (₹) 24 |
| Fixed Costs | (₹) 8 Lakh |
| Distribution: | |
| Variable Cost Per Watch | (₹) 240 |
| Watches Per Batch | 96 |
| Fixed Costs | (₹) 45 Lakh |
| Customer service cost per Watch | (₹)10 |
![]()
Required:
(i) Calculate the budgeted life cycle operating income for the new watch. (5 marks)
OR
Suggest the strategies to be adopted by the MNP Co. Ltd. to develop a new watch. (5 marks)
(ii) What percentage of the budgeted total product life cycle costs will be incurred by the end of the R & D and design stage? (2 marks)
(iii) An analysis reveals that 75% of the budgeted total life cycle costs of new watch will be locked in at the R & D and design stage. What are the implications for managing costs of the new watch. (3 marks)
Answer:
(i) Statement Showing Budgeted Life-Cycle Operating Income
| Particulars | (₹) |
| Revenues (₹ 500 × 2,40,000 units) | 12,00,00,000 |
| Less: R&D and Design Costs | 80,00,000 |
| Manufacturing Costs: | |
| Variable (₹ 120 × 2,40,000 units) | 2,88,00,000 |
| Batch (24,000 × \(\frac{4,000}{3,000}\) × 100) | 32,00,000 |
| Fixed | 1,12,00,000 |
| Marketing Costs: | |
| Batch (₹ 24 × 2,500* batches) ‘Assuming 1 Batch = 96 Pcs. | 60,000 |
| Fixed | 8,00,000 |
| Distribution Costs: | |
| Variable (₹ 240 × 2,40,000) | 5,76,00,000 |
| Fixed | 45,00,000 |
| Customer Service Cost (₹ 10 × 2,40,000) | 24,00,000 |
| Total Costs | 11,65,60,000 |
| Operating Income | 34,40,000 |
Or
We can see from the above figure that approximately 80% of a product’s cost are committed during the planning and design stage. At this stage product designers determine the product’s design and the production process. In contrast, the majority of costs are incurred at the manufacturing stage, but they have already become locked in at the planning and design stage and are difficult to alter.
The pattern of cost commitment and incurrence will differ based on the industry and specific product introduced. For developing a watch, MNP Co. Ltd. needs to commit around 80,00,000 for its R&D and design Cost. So, Cost Management of MNP Co. Ltd can be most effectively exercised during the planning and design stage of its new watch and not at the manufacturing stage when the product design and processes have already been determined and costs have been committed.
![]()
At this latter stage the focus is more on cost containment rather than on Cost Management. An understanding of’ life-cycle costs and how they are committed and incurred at different stages throughout a product’s life cycle of the watch will also led to the emergence of target costing, a technique that focuses on managing costs during a product’s planning and design phase.
(ii) % of Budgeted Total Product Life-Cycle Costs incurred till the R&D and Design Stages:
\(\left(\left(\frac{₹ 80,00,000}{₹ 11,65,60,000}\right) \times 100\right)\) = 6.86%
(iii) Implications:
An analysis reveals that 75% of the total product life-cycle costs of the new watch will be locked in at the end of the R&D and design stages when only 6.86% of the costs are incurred (as calculated in the above case). The implication is that it will be difficult to alter or reduce the costs of MNP digital watches once the design is finalised. To reduce and manage total costs, MNP must act to modify the design before costs get (Question states 75% hence 75% is taken).
![]()
Question 17.
JK Ltd., is following Life Cycle Costing. Its four products P4, P3, P24, and P1, are in the market respectively in Introduction, Growth, Maturity and Decline stages (phases). The Management wants to analyse the marketing challenges faced by the products to take strategical measures to stabilise the products in the market. For this purpose the Board directed the Secretary to get a product-wise report from the marketing chief of each product.
The chiefs were asked to give one characteristic possessed by the product because of which the product is being classified in the respective stage and two strategical measures to be taken to overcome the market challenges faced at that stage (phase). The Secretary received the report from all the chiefs and handed them over to the computer operator to get it printed in a tabulated form. But the operator, without understanding the significance of the products, phases, characteristics and strategies, mixed all the twelve items [(1 + 2) × 4] and got it printed as a list as given below : (Nov 2018)
(i) Over capacity in the industry.
(ii) The company can continue to offer the product to our loyal customers at a reduced price.
(iii) Few competitors produce basic version of our product.
(iv) Product features may be improved or enhanced to differentiate our product from that of the competitors.
(v) Attracting customers by raising awareness about our product through promotion activities.
(vi) High volume of business and increase in competition.
(vii) Use the present product as replacement product for launching another new product successfully in the market.
(viii) Value-based pricing strategies may be considered.
(ix) Profits start declining and at times become negative.
(x) Maintain control over product quality to assure customer satisfaction.
(xi) Strengthening or expanding channel and supply chain relationships.
(xii) Prices may have to be reduced to attract the price-sensitive customers. The items are required to be tabulated as in the format given below :
Required:
(i) Complete the table given below by entering the twelve items under appropriate category columns. You need not rewrite the items. Write the serial numbers of the items only in columns (3) and (4). (4 + 8 = 12 marks)
| Products (1) | Phases (Stages) (2) | Characteristics (3) | Strategies (4) |
| P4 | Introduction | ||
| P3 | Growth | ||
| P2 | Maturity | ||
| P1 | Decline |
(ii) List down the importance (any four) of Product Life Cycle Costing. (4 marks)
(iii) State the benefits (any four) of Product Life Cycle Costing. (4 marks)
Answer:
(i) Statement showing Product Life Cycle Characteristics and Strategies:
| Products1 | Phases (Stages) 2 | Characteristics 3 | Strategies 4 |
| P4 | Introduction | (iii) | (v), (xi) |
| P3 | Growth | (vi) | (viii), (x) |
| P2 | Maturity | (i) | (iv), (xii) |
| P1 | Decline | (ix) | (ii), (vii) |
![]()
(ii) The importance of Product Life Cycle costing are as follows :
- The product life cycle costing results in earlier actions to generate revenue or to lower costs than otherwise might be considered. There are a number of factors that need to be managed in order to maximize return on a product.
- Better decisions should follow from a more accurate and realistic assessment of revenues and costs, at least within a particular life cycle stage.
- It is an approach used to provide a long term picture of product line profitability, feedback on the effectiveness of life cycle planning and cost data to clarify the economic impact of alternatives chosen in the design, engineering phase etc.
- As the product life cycle allows the company to measure product performance against similar products launched in the past.
- As a planning tool, it characterizes the marketing challenges in each stage and poses major alternative strategies i.e. application of Kaizen.
- As a forecasting tool, it is less useful because sales histories exhibit diverse patterns and the stages vary in duration.
(iii) The benefits of Product Life Cycle costing are summarized as follows:
1. Product life cycle thinking can promote long-term rewarding in contrast to short-term profitability rewarding.
2. It provides an overall framework for considering total incremental costs over the entire life span of a product, which in turn facilitates analysis of parts of the whole where cost effectiveness might be improved.
3. It is also considered as a way to enhance the control of manufacturing costs. The thrust of product life cycle is on the distribution of costs. Among categories changes over the life of the product, as does the potential profitability of a product. Hence it is important to track and measure costs during each stage of a product’s life cycle.
4. Product life costing traces research and design and development costs etc., incurred to individual products over their entire life cycles, so that the total magnitude of these costs for each individual product can be reported and compared with product revenges generated in later periods.
![]()
Question 18.
Zen Ltd., forms a Committee consisting of its Production, Marketing and Finance Directors to prepare a budget for the next year. The Committee submits a draft budget as detailed below: (Nov 2018)
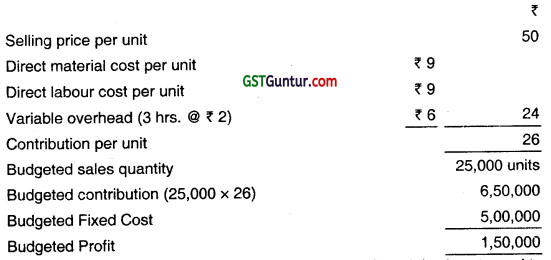
The Management is not happy with the budgeted profit as it is almost equal to the previous year’s profit. Therefore, it asks the Committee to prepare a budget to earn at least a profit of ₹ 3,00,000. To achieve the target profit, the Committee reports back with the following suggestions:
The unit selling price should be raised to ₹ 55.
The sales volume should be increased by 5000 units.
To attain the above said increase in sales, the company should spend ₹ 40,000 for advertising.
The production time per unit should be reduced.
To win the acceptance of the workers in this regard the hourly rate should be increased by ₹ 3 per unit besides an annual group bonus of ₹ 30,000.
There is no change in the amount and rates of other expenses. The company has sufficient production capacity.
As the implementation of the above proposal needs the acceptance of the work force to increase the speed of work and to reduce the production time per unit, the Board wants to know the extent of reduction in per unit production time.
Required:
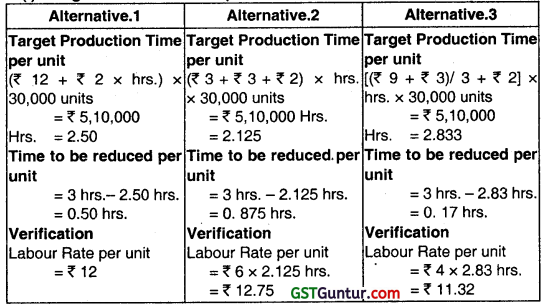
(i) Calculate the target production time per unit and the time to be reduced per unit. (14 marks)
(ii) Identify the other problems that may arise in production due to decrease in unit production time and also suggest the remedial measures to be taken. (4 marks)
(iii) State the most suitable situation for the adoption of Target Costing. (2 marks)
Answer:
(i) Target Production lime per unit and Time to be Reduced per unit:
Workings:
Statement Showing Target Cost (Direct Labour and Variable Overhead)
| Particulars | Amount (₹) |
| Target Sales (₹ 55 × 30,000 Units) | 16,50,000 |
| Less: Target Profit | 3,00,000 |
| Less: Direct Material Cost (₹ 9 × 30,000 Units) | 2,70,000 |
| Less: Budgeted Fixed Costs | 5,00,000 |
| Less: Proposed Advertising | 40,000 |
| Less: Proposed Annual Group Bonus | 30,000 |
| Target Cost (Variable Overhead and Direct Labour) for 30,000 units | 5,10,000 |
![]()
(ii) (a) Use of target costing may reduce the quality of products in trying to complete the work in quick manner to match the target time which may result in inferior quality.
(b) For every problem area outlined have the dominant solution is retaining strong control over the design terms, which calls for a good team leader. This person must have an exceptional knowledge of the design process, good interpersonal skills, and a commitment to staying within both time and cost budgets for a design product.
(c) The management accountant should work with the design team to help it understand the nature of various costs (such as cost allocations based on an activity based costing system), as well as the cost benefit trade – offs of using different design or cost operations in the new product.
(iii) Target costing is most useful in situations where the majority of product costs are locked in during the product design phase. This is the case for most manufactured products, but few services. Following companies may benefit the most:
Assembly – oriented industries, as opposed to repetitive – process industries that produce homogenous products.
Use technologies of factory automation, including computer aided design, flexible manufacturing system, office automation, and computer – aided manufacturing.
![]()
Question 19.
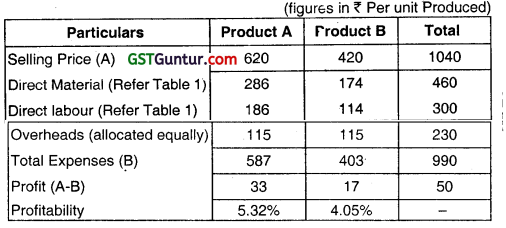
Excel Ltd. is the leading manufacturer and exporter of high quality leather products – Product A and Product B.
Selling price per unit of Product A and Product B is ₹ 620 and ₹ 420 respectively.
Both the products pass through three processes – Tanning, Dyeing and Finishing during manufacturing process. Allocation of costs per unit of leather products manufactured among the processes are given below : (May 2019)
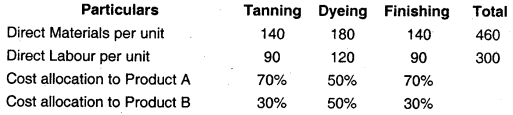
General overheads per unit of leather products manufactured are ₹ 230 which is allocated equally between Product A and Product B. Above CQst allocation is the basis for the decisions regarding pricing of the products.
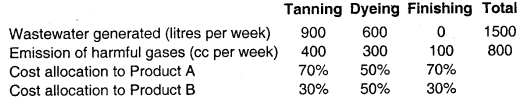
In this Industry, all the major production processes have environmental impact at all stages of the process, including generation of waste, emission of harmful gases, noise pollution, water contamination etc.
The management of the company is worried about the above environmental impact and has taken initiative to preserve the environment like – research and development activities aimed at reducing pollution level, planting trees, treatment of harmful gases and airborne emissions, wastewater treatment etc. Thamanagement of the company desires to adopt Environmental Management Accounting as a part of strategic decision making process. Pricing of products should also factor in environmental cost generated by each product.
General overheads per unit of leather products manufactured are ₹ 230 which includes:
Treatment cost of harmful gases – ₹ 80
Wastewater treatment cost – ₹ 100
Cost of planting of trees – ₹ 20
Process wise information related to generation of wastewater and harmful gases is given as below :
The remaining overheads cost and cost of planting trees can be allocated equally between Product A and Product B.
Required:
(a) Calculate the product wise profitability based on the original cost allocation. (2 marks)
(b) Recalculate the product wise profitability based on activity based costing (Environment driven costs). (5 marks)
(c) Analyze the difference in product profitability as per both the methods. (2 marks)
(d) Recommend and explain the four management accounting techniques for the identification and allocation of environmental costs. (8 marks)
(e) State why the management of environmental costs is becoming increasingly important in organizations. Give reasons. (3 marks)
Answer:
(a) Product wise Profitability based on Original Cost Allocation Method:
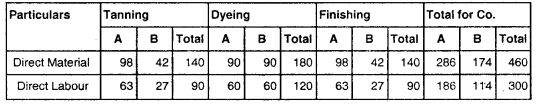
Working Note:
Table 1: Allocation of Direct Materials and Labour as Per Cost Center and Product:
![]()
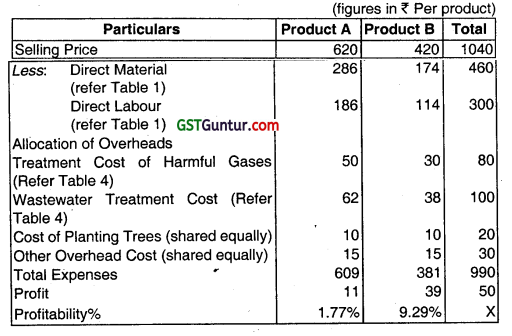
(b) Product wise Profitability (activity based costing using environmental management accounting) requires the following Step:
1. Overhead expenses ₹ 230 per product produced be first bifurcated into treatment cost of harmful gases, waste water treatment cost, cost of planting trees and other overhead costs.
2. The above 3 costs are allocated first to the cost centre. This is done based on the waste generated at each cost center. The individual cost allocated to each cost center is again allocated to products based on the wastage generated at each cost centre by each product. Refer part a of table 2 detailed calculations.
3. As mentioned in the problem, other overhead costs are allocated to each product at each cost center level equally. Refer table 2 for detailed calculations
4. The above allocations to each product at a cost centre level is then summed up to get the product wise overhead cost allocation. Refer part C of table 2 for detailed calculations.
Accordingly, the Revised Product Profitability would be as follows:
![]()
Workings:
Table 2: Breakdown of General Overheads per unit
| Overhead | Amount (₹) | Allocation basis between products |
| Treatment Cost of Harmful Gases | 80 | Emission of Harmful Gases (cc per week) |
| Wastewater Treatment Cost | 100 | Wastewater Generated (liters per week) |
| Cost of Planting Trees | 20 | Equally between Products A and B |
| Other Overheads (balancing figure) | 30 | Equally between Products A and B |
| Total General Overheads per unit | 230 |
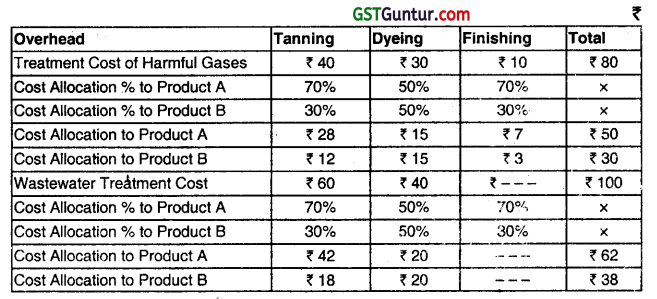
Table 3: Allocation of Treatment Cost to various process: Process Wise Information:
| Overhead | Amount (₹) | Allocation Basis Between Products | Tanning | Dyeing | Finishing | Total |
| Treatment cost of Harmful Gases | 80 | Emission of Harmful Gases (cc per week) | 400 cc | 300 cc | 100 cc | 800 cc |
| Wastewater Treatment Cost | 100 | Wastewater Generated (ltr. per week) | 900 lt | 600 lt. | — | 1,500 lt |
![]()
Cost Allocation to Process :
| Overhead | Amount (₹) | Allocation Basis Between Products | Tanning (₹) | Dyeing (₹) | Finishing (₹) | Total (₹) |
| Treatment cost of Harmful Gases | 80 | Emission of Harmful Gases (cc per week) | 40 | 30 | 10 | 80 |
| Wastewater Treatment Cost | 100 | Wastewater Generated (Itr. per week) | 60 | 40 | 0 | 100 |
Table 4: Allocation of Treatment Cost to Product A and B:
(c) Analysis of the difference in product profitability as per both the methods:
In the first method, general overhead costs are allocated to the products A and B, irrespective of the environment costs that each product incurs. General overhead costs are to each product equally. The resultant product profitability shows that Product A yields 5:32% and Product B yields 4.05% profitability. Therefore, the Excel Ltd. would conclude that Product A is more profitable.
In the next method, general overhead costs are bifurcated to identify “hidden” environment costs that are incurred on account of manufacturing these products. Environment costs are first traced to the process that generates harmful gases and wastewater, for which treatment is done. It can be seen that Tanning process, followed by Dyeing and Finishing process generates the maximum amount of waste.
Therefore, by proportioning the cost based on the waste generated, more cost is allocated to Tanning the process. Similarly, Dyeing and Finishing are allocated lesser cost since they do not generate as much waste. It is further given that 70% of the cost of Talnning relates to Product A. This is much higher than the 50% that was allocated to the Product as per the first method.
Accordingly, the revised workings show that Product A yields 1.77% and Product B yields 9.29% profitability. The reason being, Product A generates more environment driven costs as compared to Product B. Excel Ltd. would therefore increase the selling price of Product A if it wants to maintain profitability as per the original method. However, the more sustainable approach would be find out ways of reducing wastewater and harmful gases the manufacturing process produces. This would in turn result in reduction of environment driven costs such as wastewater treatment and treatment of harmful gases. This would sustain profits in the long run.
![]()
(d) The company can draw a number of conclusions from this analysis of overhead costs as per environmental management accounting. This analysis has helped the company reach the conclusion that Product A produces more waste.
In 2003, the UNDSD identified four management accounting technique for the identification and allocation of Environment Costs:
- Input-Output Analysis
- Flow Cost Accounting
- Life Cycle Costing
- Activity Based Costing.
The above techniques are explained as below :
1. Input – Output Analysis :
The technique records material inflows and balances this with outflows on the basis that, what comes in, must go out, So, if 100 kg of materials have been bought and only 80 kg. of materials have been produced, for example, then the 20 kg difference must be accounted for in some way. By accounting for outputs in this way, both in terms of physical quantities and at the end of the process, in monetary terms too, businesses are focused to focus on environmental costs.
2. Flow Cost Accounting:
This technique uses not only material flows but also the organizational structure. Classic material flows are recorded as well as material losses incurred at various stages of production. Flow cost accounting makes materials flows transparent by using various data, which are quantities (physical data), costs (monetary data) and values (quantities x costs) The material flows are divided into three categories, material, system and delivery and disposal.
The material values and costs apply to the materials which are involved in the various processes. The system values and costs are the in-house handling costs, which are incurred inside the company for the purpose of maintaining and Supporting material throughout, e.g. Personnel Costs or depreciation,” (UNDSD, 2003).
The delivery and disposal values and costs refer to the costs of flows leaving the company, for example transport costs or cost of disposing waste. EMA can benefit from flow cost accounting because it aims to reduce the quantities of materials, which leads to increased ecological efficiency (UNDSD, 2003).
![]()
3. Life Cycle Costing :
Life Cycle costing considers the costs and revenues of a product over its whole life rather than one accounting period.
Therefore, the full environmental cost of producing a product will be taken into account. In order to reduce life cycle costs an organization may adopt a TQM approach.
It is arguable that TQM and environmental management accounting are inextricably linked in so far as good environmental management is increasingly recognised as an essential component of TQM. Such organizations pursue objectives that may include zero compliants, zero spills, zero pollution, zero waste and zero accidents. Information Systems need to be able to support such environmental objectives via the provision of feedback – on the success or otherwise – of the organizational efforts in achieving such objectives.
4. Activity Based Costing (ABC):
ABC allocates internal costs to cost centres and cost drivers on the basis of the activities that given rise to the costs. In an environmental accounting context, it distinguishes between environmental related costs, which can be attributed to joint cost centres, and environmental, driven costs, which trend to be hidden on general overheads.
The environment – driven costs are removed from general overheads and traced to products or services. The cost drivers are determined based on environment impact that activities have and costs are charged accordingly. This should give a good attribution of environmental costs to individual products and should result in better control of costs.
Schaltegger and Muller (1998) stated ‘ the choice of an adequate allocation key is crucial for obtaining correct information’.
The four main allocation keys are:
- Volume of emissions or waste
- Toxicity of emission and waste treated.
- Environmental impact added (Volume x input per unit of volume) Volume of the emissions treated and.
- The relative costs of treating different kinds of emissions.
![]()
(e) There are three main reasons why the management of environmental costs is becoming increasingly important in organizations.
1. First, a ‘carbon footprint’ (as defined by the Carbon Trust) measures the total greenhouse gas emissions caused directly and indirectly by a person, organization, event or product. People are now becoming aware about the ‘carbon footprint’ and recycling. Several companies have initiated CSR Committees as they feel that portraying themselves as environmentally responsible makes them popular among consumers.
2. Second, environmental costs are becoming huge for some companies, particularly those operating in highly industrialized sectors such as oil production. In some cases these costs can amount to more than 20% of operating costs. Such significant costs need to be managed.
3. Third, regulation is increasing worldwide at a rapid pace. Penalisation for non- compliance also increasing accordingly. In the largest ever seizure related to an environmental conviction in the UK, a plant hire firm, John Craxford Plant Hire Ltd., had to not only pay ₹ 85,000 in costs and fines but also got ₹ 1.2 m of its assets seized. This company had illegally buried waste and breached its waste and pollution permits. And it’s not just the companies that need to worry, every person found guilty of breaching environmental regulations knowingly are liable to criminal prosecution as per the regulatory laws.
![]()
Question 20.
The information given below pertains to ABC Enterprises, a specialized car garage door installation company. ABC Enterprises use to get multiple service calls from the customers with variety of requirements. Jhey may have to Install, Replace, Adjust or Lubricate some part or other to make the door functional. They work with 5 parts as given in the table, namely Door, Motor, Track, Trimmer and T-Lock. (May 2019)
| Parts | Type of Service | Total | ||||
| Install | Replace | Adjust | Lube | |||
| 1 | Door | 2 | 5 | 1 | 0 | 8 |
| 2 | Motor | 3 | 2 | 16 | 9 | 30 |
| 3 | Track | 5 | 0 | 6 | 6 | 17 |
| 4 | Trimmer | 14 | 6 | 0 | 0 | 20 |
| 5 | T-Lock | 5 | 0 | 1 | 0 | 6 |
| 6 | Miscellaneous | 0 | 2 | 1 | 1 | 4 |
| 7 | Total | 29 | 15 | 25 | 16 | 85 |
Required :
(i) Using the above data, carry out a Pareto Analysis (80/20 rule) of Total Parts. (3 marks)
(ii) Using the same data carry out the second level Pareto Analysis on the type of services with respect to Motors only. (2 marks)
(iii) Give your recommendations on the basis of your calculations in (i) and (ii) above. (5 marks)
(Do calculations to two decimals only)
Answer:
(i) Statement Showing Pareto Analysis of Total Parts:
| Parts | Total | Cumulative | Percentage | |
| 2 | Motor | 30 | 30 | 35.29 |
| 4 | Trimmer | 20 | 50 | 58.82 |
| 3 | Track | 17 | 67 | 78.82 |
| 1 | Door | 8 | 75 | 88.23 |
| 5 | T- Lock | 6 | 81 | 95.29 |
| 6 | Miscellaneous | 4 | 85 | 100 |
In 80% of the rule consists of Motor, Trimmer and Track. Arid i.n 20% of the rule Consists of Door, T – lock and Misceflaneous.
![]()
(ii) Statement showing Pareto Analysis for Car only:
| Motor Type | Total | Cumulative | Percentage | |
| 1 | Adjust | 16 | 16 | 53.33% |
| 2 | Lube | 9 | 25 | 83.33% |
| 3 | Install | 3 | 28 | 93.33% |
| 4 | Replace | 2 | 30 | 100 |
(iii) Pareto Analysis is a rule that recommends focus on most important aspects of the decision making in order to simplify the process of decision making. The very purpose of this analysis is to direct attention and efforts of management to the product area where best returns can be achieved by taking appropriate actions.
Pareto analysis is based on the 80/20 rule which implies that 20% of the products account for 80% of the revenue but this is not the fixed percentage rule; in general business sense, it means that a few of the products, goods or services or customers may make up most of the value for the firm.
In this case for part (i), Motor, Trimmer and Track account for 80% of total parts and Door, T- lock and Miscellaneous account for 20% of total parts.
In Case of (ii) only adjust is account for 80% while lube, Install and Replace account for 20% of the total as per pareto rule (80/20).
![]()
Question 21.
A chemical company produces two chemicals SX and ZX. Environmental activities and costs associated with the two chemicals are as follows: (Nov 2019)
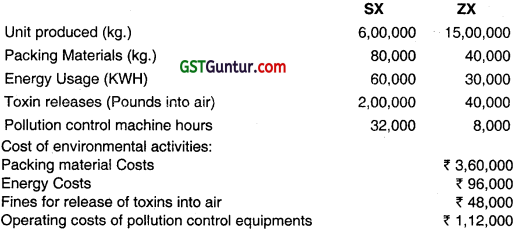
Required:
Calculate the environmental cost per kilogram for each chemical produced by the company. (5 marks)
Answer:
Apportionment Cost between Sx and Zx
1. Packing Material Costs = ₹ 3,60,000
Sx = ₹ 3,60,000 × \(\frac{80}{120}\) = ₹ 2,40,000
Zx = ₹ 3,60,000 × \(\frac{40}{120}\) = ₹ 1,20,000
2. Energy Cost = ₹ 96,000
On the basis of Energy usage (KWH)
Sx = ₹ 96,000 × \(\frac{60}{90}\) = ₹ 64,000
Zx = ₹ 96,000 × \(\frac{30}{90}\) = ₹ 32,000
3. Fines for release of Toxins into Air = ₹ 48,000
Based on Toxin Release (Pounds)
Sx = ₹ 48,000 × \(\frac{200}{240}\) = ₹ 40,000
Zx = ₹ 48,000 × \(\frac{40}{240}\) = ₹ 8,000
4. Operating Costs of Pollution Control eq. = ₹ 1,12,000
Based on Pollution Control Machine Hrs
Sx = ₹ 1,12,000 × \(\frac{32}{40}\) = ₹ 89,600
Zx = ₹ 1,12,000 × \(\frac{8}{40}\) = ₹ 22,400
![]()
Calculation of Environmental cost per kg. for each chemical
| Costs | Sx (6,00,000) | Zx (15,00,000) | ||
| Total (₹) | Per kg (₹) | Total (₹) | Per kg (₹) | |
| Packing Material cost Energy Cost | 2,40,000
64,000 |
0.4
0.107 |
1,20,000
32,000 |
0.08
0.021 |
| Fine for toxin | 40,000 | 0.067 | 8,000 | 0.005 |
| Operating Cost for Pollution Control equipment | 89,600 | 0.149 | 22,400 | 0.015 |
| Total | 4,33,600 | 0.723 | 1,82,400 | 0.122 |
![]()
Question 22.
NEC Furniture Ltd. is a leading manufacturer and supplier of furniture for students of pre-primary classes. The full cost of one set (comprising one Table and one chair) is ₹ 900 per set. The company has fixed its selling price so as to earn 30% return on investment of ₹ 45,00,000. The company produces and sells 6,000 sets per annum. Relevant cost data per annum are as follows: (Nov 2020)
| Cost Component | Budget | Actual | Actual Cost P.a. (₹) |
| Direct Material | 90,000 sq. ft. | 1,00,000 sq. ft. | 16,50,000 |
| Direct Labour | 35,000 hrs. | 40,000 hrs. | 10,32,000 |
| Mechanical Assembly | 60,000 hrs. | 60,000 hrs, | 12,00,000 |
| Machine Setup | 5,000 hrs. | 5,000 hrs. | 1,68,000 |
It has been revealed that the actual and budgeted operating levels are the same. Actual and standard rates of material purchase and labour rate per hour are also the same. Any variance in cost is solely on account of difference in the material usage and hours required to complete the production. A competitor has introduced a product very similar to product of the company at an aggressive price of ₹ 820 per set which has resulted in downtrend in the sales volume the company. The management has called urgent meeting of the marketing team. After the meeting, following recommendations of the marketing team are approved by the management:
(a) To maintain the company’s existing sales volume and amount of present return on investment, reduce the selling price by 10%.
(b) To make slight improvement in design to have edge over the competitors which will also reduce the direct material cost by ₹ 30 per set.
(c) To make the table and chair more attractive, print picture of Disney character on them, which will cost ₹ 5 per set.
Required:
(i) Calculate the present selling price and profit per unit from the above. Also calculate the mark-up % on the full cost per unit. (4 marks)
(ii) Identify the non-value-added activities in the production process. (2 marks)
(iii) (a) Calculate the new target cost per unit and new revised cost per unit after implementation of above recommendations. (2 marks)
(b) How much reduction in cost is required to achieve the new target cost? (2 marks)
(iv) Recommend what strategy the company should adopt to attain the target cost calculated above. (10 marks)
![]()
Question 23.
(a) AMKP International has developed ultra-modern smart LED TV with latest features. It has been developed after extensive research and is ready for manufacturing. The firm has incurred ₹ 6,50,000 as development cost on this LED TV. The firm is deciding on plant capacity, which could cost ₹ 40,00,000 for manufacturing of 600 units. With additional outlay of 40%, plant capacity can be increased by 50%. The relevant data pertaining to the life cycle of the LED TV at different capacity levels is as under: (Nov 2020)
| Expected Sales | 600 Units | 900 Units |
| Selling Price | ₹ 45,000 per unit | ₹ 41,400 per unit |
| Variable Selling Costs | 12% of the Selling price | 12% of the selling price |
| Salvage Value of the plant | 20% of the total plant cost | 20% of the total plant cost |
| Profit Volume Ratio | 30% | |
Required:
Advise AMKP International regarding the ‘Optimal Plant Capacity’ to install. The LED TVs life cycle is two years. (Note: Ignore the time value of money.) (10 marks)
Question 24.
The newly appointed Finance Director Mr. Preveen, in the month of September wants to make the billing pattern simple and proposed to change the price quoting methodology of the organization. The details of his proposal are listed below :- (Jan 2021)
The target cost for each research work is fixed in consultation with the client and the ABC Ltd. receives a bonus for completing the work below target cost. For a particular research conducted for Mr. Mohan, ABC Ltd has agreed upon a target cost of ₹ 20,00,000 and a target fee of ₹ 1,40,000. If the ABC Ltd completes the research at a lower cost than ₹ 20,00,000 then it will receive an additional profit upto a maximum profit of ₹ 1,80,000. If ABC Ltd completes the work for more than the target cost then it will receive less profit but atleast ₹ 40,000.
If the work is performed below the target cost, the client keeps 80% of the savings and leaves 20% of the surplus to ABC Ltd as an extra profit upto a maximum of ₹ 1,80,000. If the cost of research work exceeds the target cost, the client would bear 80% of the excess costs over and above the target cost and ABC Ltd. would bear 20%, which is subtracted from the target profit as long as the profit is not less than ₹ 40,000.
If the actual work performed amounted to ₹ 19,00,000.
![]()
Calculate the following:
(i) Cost saving for the project,
(ii) ABC Ltd.’s share in surplus
(iii) ABC Ltd.’s total profit,
(iv) Total cost to Mr. Mohan for market research work. (1 × 4 = 4 marks)
Now assume the ABC Ltd. spent ₹ 24,00,000 for performing the work to ascertain.
(v) Cost overrun
(vi) Mohan’s burden
(vii) ABC’s burden
(viii) Total Cost to Mr. Mohan for market research work. (1 × 4 = 4 marks)