Budget and Budgetary Control – CA Inter Costing Study Material
Budget and Budgetary Control – CA Inter Cost and Management Accounting Study Material is designed strictly as per the latest syllabus and exam pattern.
Budget and Budgetary Control – CA Inter Costing Study Material
1. Budgetary Control: It is the system of management control and accounting in which all the operations are forecasted and planned in advance to the: extent possible and the actual results compared with the forecasted and planned results.
2. Types of Budget:
- Capacity wise – Fixed Budget, Flexible Budget,
- Functions wise – Sales Budget, Production Budget, Plant Utilisation Budget, Direct Material Usage Budget, Direct Material Purchase Budget/etc.,
- Master Budget,
- Period wise – Long Term Budgets, Short Term Budgets, Current Budgets.
![]()
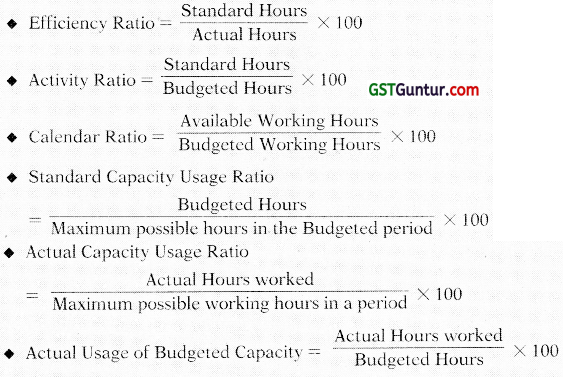
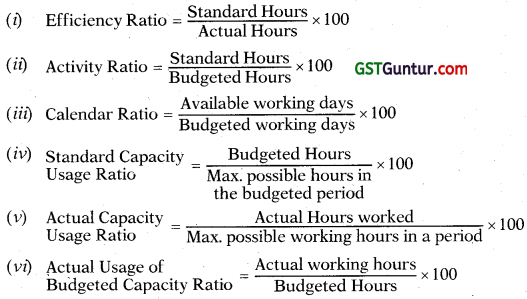
3. Budget Ratios: It provide information about the performance level, i.e., the extent of deviation of actual performance from budgeted performance: and whether the actual performance is favourable or unfavourable.
Ratio is 100% or more – Favourable performance
Ratio is less than 100% – Unfavourable performance
Theory Questions
Question 1.
What are the essential characteristics of budget [CA Inter Nov. 2011, 2 Marks]
Answer:
Essential characteristics of budget:
- It is concerned for a definite future period.
- It is a detailed plan of all economic activities of a business.
- It is a mean to achieve business objectives and it is not an end in itself.
- It helps in planning, co-ordination and control.
- It acts as a business barometer.
- It is usually prepared in the light of past experiences.
Question 2.
What are the objectives of Budgetary Control System? [ICAI Module]
Answer:
- Portraying with precision the overall aims of the business and determining targets of performance for each section or department of the business.
- Providing a basis for the comparison of actual performance with the predetermined targets and investigation of deviation, if any, of actual performance and expenses from the budgeted figures.
- Ensuring optimum use of available resources to maximise profit or production, subject to the limiting factors.
- Co-ordinating various activities of the business, and centralising control and yet enabling management to decentralise responsibility and delegate authority in the overall interest of the business.
- Providing a basis for revision of current and future policies.
- Drawing up long range plans with a fair measure of accuracy.
Question 3.
Describe the steps involved in establishing good budgeting control system [CA Inter Nov. 2013, 4 Marks]
Answer:
The following steps are necessary for establishing a good budgetary control system:
- Determining the objectives to be achieved, over the budget period, and the policy or policies that might be adopted for the achievement of these objectives.
- Determining the activities that should be undertaken for the achievement of objectives.
- Drawing up a plan or a scheme of operation in respect of each class of activity, in quantitative as well as monetary terms for the budget period.
- Laying out a system of comparison of actual performance by each person, or department with the relevant budget and determination of causes for the variation, if any.
- Ensuring that corrective action will be taken where the plan has not been achieved and, if that is not possible, for the revision of the plan.
Question 4.
What are the advantages of Budgetary Control System? [ICAI Module]
Answer:
| Points | Description |
| 1. Efficiency | The use of budgetary control system enables the management to conduct its business activities in an efficient manner. |
| 2. Control on expenditure | It is a powerful instrument used by business entity for the control of their expenditure. It provides a yardstick for measuring and evaluating the performance of individuals and their departments. |
| 3. Finding deviations | Budget reveals the deviations of the actual from the budgeted figures after making a comparison and communicating the deviation to management. |
| 4. Effective utilisation of resources | Effective utilisation of various resources like men, material, machinery and money, is made possible, as the production is planned after taking these into account. |
| 5. Revision of plans | Budget helps in the review of current trends and framing of future policies. |
| 6. Cost Consciousness | Budgetary control system encourages cost consciousness and maximum utilisation of available resources. |
![]()
Question 5.
What is ‘Budgetary Control System’ and discuss the components of the same. [CA Inter Dec. 2021, May 2009, 5 Marks]
Answer:
It is the system of management control and accounting in which all the operations are forecasted and planned in advance to the extent possible and the actual results compared with the forecasted and planned results.
Components of Budgetary Control System:
The policy of a business for a defined period is represented by the master budget, the detailed components of which are given, in a number of individual budgets called functional budgets. These functional budgets are broadly grouped under the following heads:
1. Physical budgets: Those budgets which contain information in quantitative terms such as the physical units of sales, production etc. This may include quantity of sales, quantity of production, inventories, and manpower budgets are physical budgets.
2. Cost budgets: Budgets which provides cost information in respect of , manufacturing, administration, selling and distribution, etc. for example, manufacturing costs, selling costs, administration cost, and research and development cost budgets are cost budgets.
3. Profit budgets: A budget which enables the ascertainment of profit. For example, sales budget, profit and loss budget, etc.
4. Financial budgets: A budget which facilitates in ascertaining the financial position of a concern, for example, cash budgets, capital expenditure budget, budgeted balance sheet etc.
Question 6.
State the limitations of Budgetary Control System. [CA Inter January 2021, 5 Marks]
Answer:
Limitations of Budgetary Control System
| Points | Description |
| 1. Based on Estimates | Budgets are based on a series of estimates, which are based on the conditions prevalent or expected at the time budget is established. It requires revision in plan if conditions change. |
| 2. Time factor | Budgets cannot be executed automatically. Some preliminary steps are required to be accomplished before budgets are implemented. It requires proper attention and time of management. Management must not expect too much during the initial development period. |
| 3. Co-operation Required | Staff co-operation is usually not available during the initial budgetary control exercise. In a decentralized organisation, each unit has its own objective and these units enjoy some degree of discretion. In this type of organisation structure, coordination among different units is required. The success of the budgetary control depends upon willing co-operation and teamwork. |
| 4. Expensive | The implementation of budget is somewhat expensive. For successful implementation of the budgetary control, proper organisation structure with responsibility is prerequisite. Budgeting process start from the collection of information to for preparing the budget and performance analysis. It consumes valuable resources (in terms of qualified manpower, equipment, etc.) for this purpose; hence, it is an expensive process. |
| 5. Not a substitute for management. | Budget is only a managerial tool and must be intelligently applied for management to get benefited. Budgets are not a substitute for good management. |
| 6. Rigid document | Budgets are sometime considered as rigid documents. But in reality, an organisation is exposed to various uncertain internal and external factors. Budget should be flexible enough to incorporate ongoing developments in the internal and external factors affecting the very purpose of the budget. |
Question 7.
Describe the salient features of budget manual. [CA Inter RTP May 2021]
Answer:
Following are the salient features of Budget Manual:
- It contains much information which is required for effective budgetary planning.
- It is a collection of documents that contains key information for those involved in the planning process.
- It includes introductory explanation of the budgetary planning and control process, statement of the budgetary objective and desired results.
- It contains a form of organisation chart to show who is responsible for the preparation of each functional budget and the way in which the budgets are interrelated.
- In contains a timetable for the preparation of each budget.
- Copies of all forms to be completed by those responsible for preparing budgets, with explanations concerning their completion is included in Budget Manual.
![]()
Question 8.
Explain briefly the concept of ‘flexible budget’. [CA inter Nov. 2019, Nov. 2017, Nov. 2008, 2 Marks]
Answer:
Flexible Budget: A flexible budget is defined as “a budget which, by recognizing the difference between fixed, semi-variable and variable cost is designed to change in relation to the level of activity attained”. A fixed budget, on the other hand is a budget which is designed to remain unchanged irrespective of the level of activity actually attained. In a fixed budgetary control, budgets are prepared for one level of activity whereas in a flexibility budgetary control system, a series of budgets are prepared one for the each of a number of alternative production levels or volumes. Flexible budgets represent the amount of expense that is reasonably necessary to achieve each level of output specified. In other words, the allowances given under flexibility budgetary control system serve as standards of what costs should be at each level of output.
Question 9.
What are the cases when a flexible budget is found suitable? [CA Inter May 2019, 5 Marks]
Answer:
Flexible budgeting may be resorted to under following situations:
- In the case of new business venture due to its typical nature it may be difficult to forecast the demand of a product accurately.
- Where the business is dependent upon the mercy of nature e.g., a per-son dealing in wool trade may have enough market if temperature goes below the freezing point.
- In the case of labour-intensive industry where the production of the concern is dependent upon the availability of labour.
Suitability for flexible budget:
- Seasonal fluctuations in sales and/or production, for example in soft drinks industry.
- A company which keeps on introducing new products or makes changes in the design of its products frequently.
- Industries engaged in make-to-order business like ship building.
- An industry which is influenced by changes in fashion; and
- General changes in sales.
Question 10.
Distinguish between ‘Fixed and flexible budget’. [CA Inter Nov. 2011, May 2016, 4 Marks]
Answer:
Difference between fixed and flexible budgets
| Fixed Budget | Flexible Budget |
| 1. It does not change with actual volume of activity achieved. Thus it is rigid. | It can be recasted on the basis of activity level to be achieved. Thus it is not rigid. |
| 2. It operates on one level of activity and under one set of conditions. | It consists of various budgets for different level of activity. |
| 3. If the budgeted and actual activity levels differ significantly, then cost ascertainment and price fixation do not give a correct picture. | It facilitates the cost ascertainment and price fixation at different levels of activity. |
| 4. Comparisons of actual and budgeted targets are meaningless particularly when there is difference between two levels. | It provided meaningful basis of comparison of actual and budgeted targets. |
Question 11.
List the eight functional budgets prepared by a business. [CA Inter Nov. 2009, 3 Marks]
Answer:
The various commonly used Functional budgets are:
- Sales Budget
- Production Budget
- Plant Utilisation Budget
- Direct Material Usage Budget
- Direct Material Purchase Budget
- Direct Labour (Personnel) Budget
- Factory Overhead Budget
- Production Cost Budget.
Question 12.
State the considerations on which capital expenditure budget is prepared. [CA Inter Nov. 2012, 4 Marks]
Answer:
The preparation of Capital Expenditure Budget is based on the following considerations:
- Overhead on production facilities of certain departments as indicated by the plant utilisation budget.
- Future development plans to increase output by expansion of plant facilities.
- Replacement requests from the concerned departments.
- Factors like sales potential to absorb the increased output, possibility of price reductions, increased costs of advertising and sales promotion to absorb.increased output, etc.
![]()
Question 13.
Write a short note on ‘Zero Base Budgeting as an approach towards Productive improvement. [CA Inter Nov. 2005, 4 Marks]
Answer:
Zero Base Budgeting approach plays key role in productivity improvement.
It is beneficial in this regard in the following manner:
- ZBB ensures that the various functions adopted by the organisation are important and critical for the achievement of its objectives and are being performed in the best possible way.
- ZBB gives an opportunity to the management to allocate resources for different activities only after proper cost benefit analysis.
- In this approach, ‘chances of arbitrary cuts and enhancement are thus avoided.
- Department budgets are closely linked with corporate objectives.
- It provides a systematic approach for the evaluation of different activities and rank them in order of preference for the allocation of scarce resources.
- Wasteful expenditures can be easily identified and eliminated.
Question 14.
Why is ‘Zero Base Budgeting’ (ZBB) considered superior to ‘Traditional Budgeting’? Explain. [CA Inter May 2018, 5 Marks]
Answer:
Zero based budgeting is superior to traditional budgeting: Zero based budgeting is superior to traditional budgeting in the following manner:
- It provides a systematic approach for evaluation of different activities.
- It ensures that the function undertaken is critical for the achievement of the objectives.
- It provides an opportunity for management to allocate resources to various activities after a thorough – cost benefit analysis.
- It helps in the identification of wasteful expenditure and then their elimination. It facilitates the close linkage of departmental budgets with corporate objectives.
- It helps in the introduction of a system of Management by Objectives.
Question 15.
What are the advantages and limitations of zero base budgeting? [CA Final Nov. 2004, 4 Marks]
Answer:
Advantages of ZBB:
- It provides a systematic approach for the evaluation of different activities and rank them in order of preference for the allocation of scarce resources.
- It ensures that the various functions undertaken by the organization are critical for the achievement of its objectives and are being performed in the best possible way.
- It provides an opportunity to the management to allocate resources for various activities only after having a thorough cost-benefit-analysis. The chances of arbitrary cuts and enhancement are thus avoided.
- The areas of wasteful expenditure can be easily identified and eliminated.
- Departmental budgets are closely linked with corporation objectives.
- The technique can also be used for the introduction and implementation of the system of ‘management by objective.’ Thus, it cannot only be used for fulfilment of the objectives of traditional budgeting but it can also be used for a variety of other purposes.
Limitations of ZBB:
- The work involves in the creation of decision-making and their subsequent ranking has to be made on the basis of new data. This process is very tedious to management.
- The activities selected for the purpose of ZBB are on the basis of the traditional functional departments. So the consideration scheme may not be implemented properly.
Question 16.
Define Zero Base Budgeting and mention its various stages. [CA Inter Nov. 2019, 5 Marks]
Answer:
Zero-based Budgeting: (ZBB) is an emergent form of budgeting which arises to overcome the limitations of incremental (traditional) budgeting system. Zero- based Budgeting (ZBB) is defined as a method of budgeting which requires each cost element to be specifically justified, although the activities to which the budget relates are being undertaken for the first time, without approval, the budget allowance is zero’.
ZBB is an activity based budgeting system where budgets are prepared for each activities rather than functional department. Justification in the form of cost benefits for the activity is required to be given. The activities are then evaluated and prioritized by the management on the basis of factors like synchronisation with organisational objectives, availability of funds, regulatory requirement etc.
ZBB is suitable for both corporate and non-corporate entities. In case of non-corporate entities like Government department, local bodies, not for profit organisations, where these entities need to justify the benefits of expenditures on social programmes like mid-day meal, installation of street lights, provision of drinking water etc.
ZBB involves the following stages:
- Identification and description of Decision packages
- Evaluation of Decision packages
- Ranking (Prioritisation) of the Decision packages
- Allocation of resources
![]()
Question 17.
What are the important points an organization should consider if it wants to adopt Performance Budgeting? [CA Inter Nov. 2020, 5 Marks]
Answer:
For an enterprise that wants to adopt Performance Budgeting, it is thus imperative that:
- The objectives of the enterprise are spelt out in concrete terms.
- The objectives are then translated into specific functions, programmes, activities and tasks for different levels of management within the realities of fiscal constraints.
- Realistic and acceptable norms, yardsticks or standards and performance indicators should be evolved and expressed in quantifiable physical units.
- A style of management based upon decentralised responsibility structure should be adopted, and
- An accounting and reporting system should be developed to facilities monitoring, analysis and review of actual performance in relation to budgets.
Question 18.
Write short note on Budget Ratio. [ICAI Module]
Answer:
Budget ratios provide information about the performance level, i.e., the extent of deviation of actual performance from the budgeted performance and whether the actual performance is favourable or unfavorable. If the ratio is 100% or more, the performance is considered as favourable and if ratio is less than 100% the performance is considered as unfavourable.
The following ratios are usually used by the management to measure development from budget.
Practical Questions
Flexible Budget
Question 1.
G Ltd. manufactures a single product for which market demand exists for additional quantity. Present sales of ₹ 6,00,000 utilises only 60% capacity of the plant. The following data are available:
(1) Selling price : ₹ 100 per unit
(2) Variable cost : ₹ 30 per unit
(3) Semi-variable expenses : ₹ 60,000 fixed + ₹ 5 per unit
(4) Fixed expenses : ₹ 1,00,000at present level, estimated to increase by 25% at and above 80% capacity.
You are required to prepare a flexible budget so as to arrive at the operating profit at 60%, 80% and 100% levels. [ CA Inter Nov. 2020, 5 Marks]
Answer:
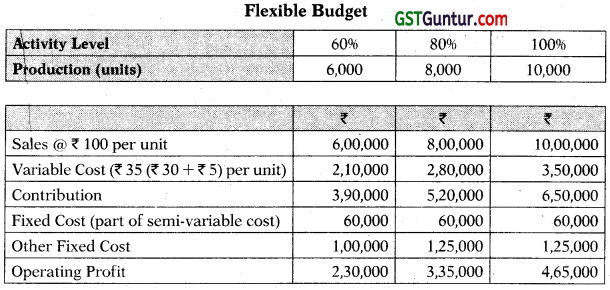
Note:
60% level of activity = 6,000 units (given)
80% level or activity = \(\frac{6,000 \text { units } \times 80 \%}{60 \%}\) = 8,000 units
100% level of activity = \(\frac{6,000 \text { units } \times 100 \%}{60 \%}\) = 10,000 units
![]()
Question 2.
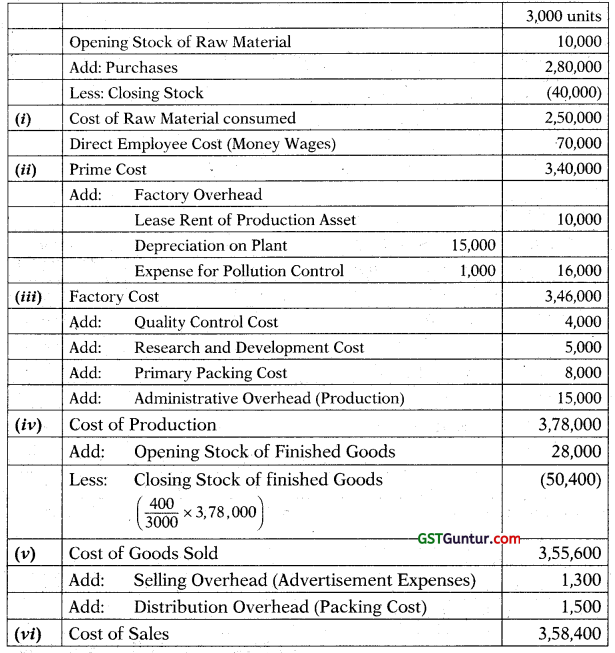
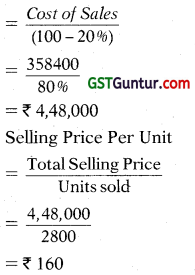
The Cost Sheet of a company based on a budgeted volume of Sales of 3,00,000 units per quarter is as under:
| ₹ per unit | |
| Direct Materials | 5.00 |
| Direct Wages | 2.00 |
| Factory overheads (50% fixed) | 6.00 |
| S/A dm, overheads (1/3 variable) | 3.00 |
| Selling price | 18.00 |
When the budget was discussed it was felt that the company would be able to achieve only a volume of 2,50,000 units of production and sales per quarter. The company therefore decided that an aggressive sales promotion campaign should be launched to achieve the following improved operations:
Proposal I:
- Sell 4,00,000 units per quarter by spending 2,00,000 on special advertising.
- The factory fixed costs will increase by 4,00,000 per quarter.
Proposal II:
- 5,00,000 units per quarter subject to the following conditions.
- An overall price reduction of 2 per unit is allowed on all sales.
- Variable Selling and Administration Costs will increase by 5%.
- Direct Material Costs will be reduced by 1% due to purchase price discounts.
- The fixed factory Costs will increase by 2,00,000 more.
You are required to prepare a Flexible Budget at 2,50,000, 4,00,000 and 5,00,000 units of output per quarter and calculate the Profit at each of the above levels of output. [CA Final May 2002, 9 Marks]
Answer:
Statement of flexible budget and profit per quarter at 2,50,000; 4,00,000 and 5,00,000 units of output levels per quarter
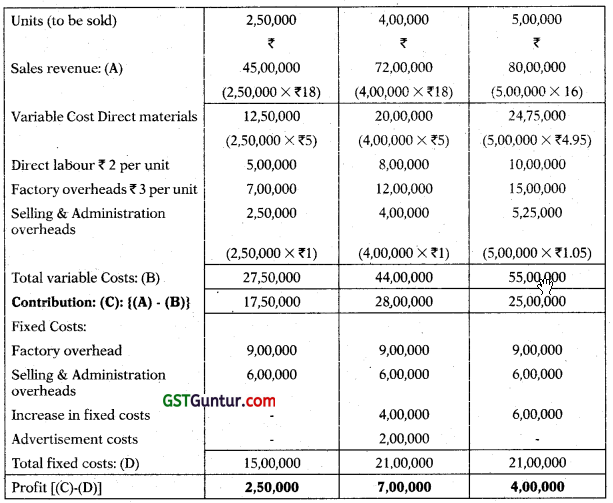
Under proposal II the factory costs were increased by 2,00,000 more over proposal I.
Question 3.
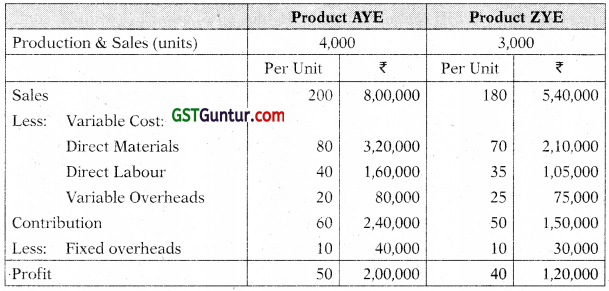
The Accountant of KPMR Ltd, has prepared the following budget for the coining year 2022 for its two products ‘AYE’ and ‘ZYF’:
| Particulars | Product ‘AYE’ | Product ‘ZYE’ |
| Production and Sales (in Units) | 4,000 | 3,000 |
| Amount (in ₹) | Amount (in ₹) | |
| Selling Price per unit | 200 | 180 |
| Direct Material per unit | 80 | 70 |
| Direct Labour per unit | 40 | 35 |
| Variable Overhead per unit | 20 | 25 |
| Fixed Overhead per unit | 10 | 10 |
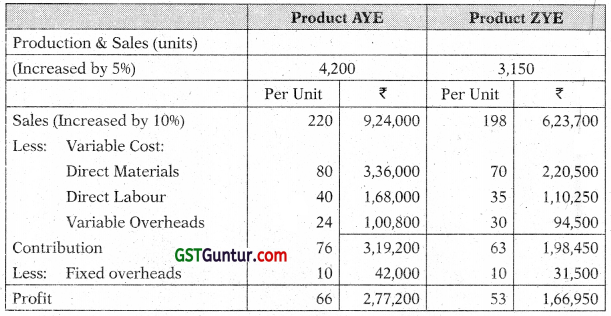
After reviewing the above budget, the management has called the marketing team for suggesting some measures for increasing the sales. The marketing team has suggested that by promoting the products on social media, the sales quantity of both the products can be increased by 5%. Also, the selling price per unit will go up by 10%. But this will result in increase in expenditure on variable overhead and fixed overhead by 20% and 5% respectively for both the products.
You are required to prepare flexible budget for both the products:
(i) Before promotion on social media.
(ii) After promotion on social media. [CA Inter Dec. 2021, 5 Mar ks]
Answer:
(i) Flexible budget (before promotion)
![]()
(ii) Flexible budget (after promotion)
Question 4.
Tricon Co. furnishes the following information for the month of September, 2020.
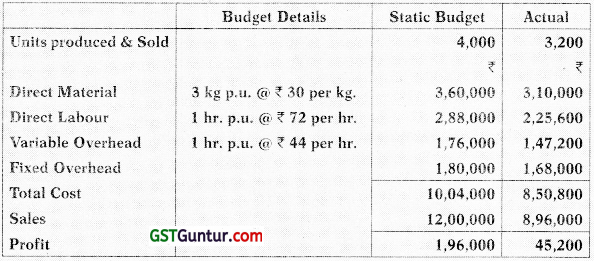
During the month 10,000 kg. of materials and 3.100 direct labour hours were utilized.
Required:
(i) Prepare a flexible budge! for the month.
(ii) Deter the material usage variance and the direct labour rate variance for the actual vs the flexible budget. [CA Inter MTP]
Answer:
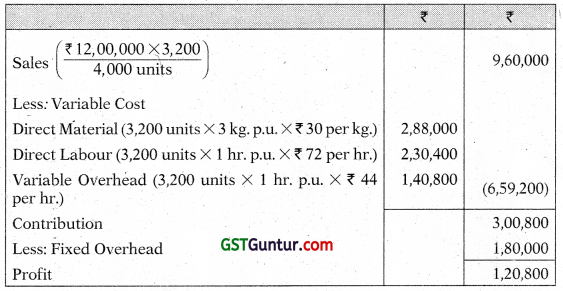
(i) Statement Showing “Flexible Budget for 3,200 units Activity Level”
(ii) Computation of Variances
Material Usage Variance = Standard Cost of Standard Quantity for Actual Production – Standard Cost of Actual Quantity
= (SQ – AQ) × SP
= [(3,200 units × 3 kg.) – 10,000 kg.] × ₹ 30.00
= ₹ 12,000 (A)
Labour Rate Variance = Standard Cost of Actual Time – Actual Cost
= (SR – AR) × AH
= [₹ 72 – \(\left(\frac{₹ 2,25,000}{3,100}\right)\)] × 3,100
= ₹ 2,400(A)
Question 5.
You are given the following data of a manufacturing concern:
| ₹ | |
| Variable Expenses (at 50% capacity): | |
| -Materials | 48,00,000 |
| -Labour | 51,20,000 |
| -Others | 7,60,000 |
| Semi variable expenses (at 50% capacity): | |
| -Maintenance and Repairs | 5,00,000 |
| -Indirect Labour | 19,80,000 |
| -Sales-Dept. Salaries | 5,80,000 |
| -Sundry Administrative Expenses | 5,20,000 |
| Fixed Expenses: | |
| -Wages & Salaries | 16,80,000 |
| -Rent, Rates and Taxes | 11,20,000 |
| -Depreciation | 14,00,000 |
| -Sundry Administrative Exp. | 17,80,000 |
The fixed expenses remain constant for ail levels of production. Semi variable expenses remain constant between 45% and 65% of capacity whereas it increases by 10% between 65% and 80% capacity of 20% between 80% and 100% capacity.
Sales at various levels are as under:
| Capacity | Sales (₹) |
| 75% | 2,40,00,000 |
| 100% | 3,20,00,000 |
Prepare flexible budget at 75% and 100% capacity. [CA Inter May 2017, 8 Marks]
Answer:
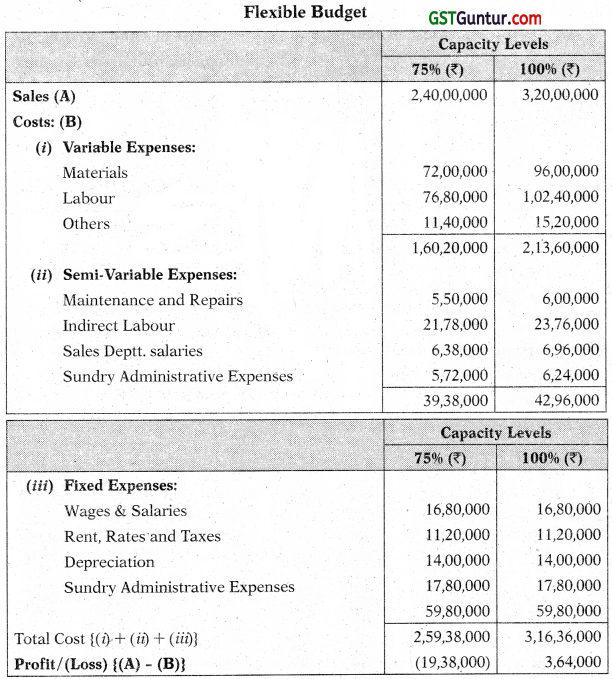
At 75% and 100% capacity level, the semi-variable costs increased by 10% and 20% respectively.
![]()
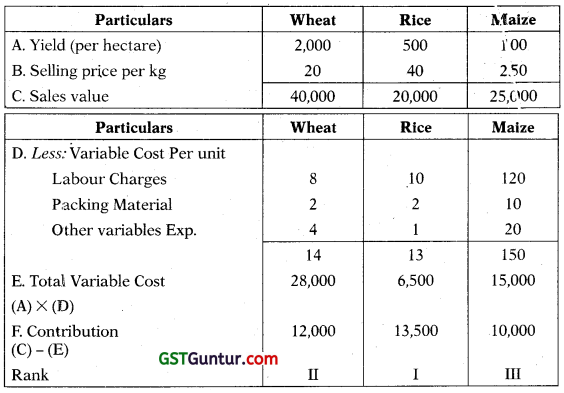
Question 6.
Maharatna Ltd., a public sector undertaking (PSU), produces product A. The company is in process of preparing its revenue budget for the year 2022. The company has the following information which can be useful in preparing the budget:
(i) It has anticipated 12% growth in sales volume from the year 2021 of 4,20,000 tonnes.
(ii) The sales price of ₹ 23,000 per tonne will be increased by 10% provided Wholesale Price Index (WPI) increases by 5%.
(iii) To produce one tonne of product A, 2.3 tonnes of raw material are required. The raw material cost is ₹ 4,500 per tonne. The price of raw material will also increase by 10% if WPI increase by 5%.
(iv) The projected increase in WPI for 2022 is 4%.
(v) A total of 6,000 employees works for the company. The company works 26 days in a month.
(vi) 85% of employees of the company are permanent and getting salary as per 5- year wage agreement. The earnings per manshift (means an employee cost for a shift of 8 hours) is ₹ 3,000 (excluding terminal benefits). The new wage agreement will be implemented from 1st July 2022 and it is expected that a 15% increase in pay will be given.
(vii) The casual employees are getting a daily wage of ₹ 850. The wages in linked to Consumer Price Index (CPI). The present CPI is 165.17 points and it is expected to be 173.59 points in year 2022.
(viii)Power cost for the year 2021 is ₹ 42,00,000 for 7,00,000 units (1 unit = 1 Kwh). 60% of power is used for production purpose (directly related to production volume) and remaining are for employee quarters and administrative offices.
(ix) During the year 2021, the company has paid ₹ 60,00,000 for safety and maintenance works. The amount will increase in proportion to the volume of production.
(x) During the year 2021, the company has paid ₹ 1,20,000 for the purchase of diesel to be used in car hired for administrative purposes. The cost of diesel will increase by 15% in year 2022.
(xi) During the year 2021, the company has paid ₹ 6,00,000 for car hire charges (excluding fuel cost). In year 2022, the company has decided to reimburse the diesel cost to the car rental company. Doing this will attract 5% GST on Reverse Charge Mechanism (RCM) basis on which the company will not get GST input credit.
(xii) Depreciation on fixed assets for the year 2021 is ₹ 80,40,00,000 and it will be 15% lower in 2022.
Required:
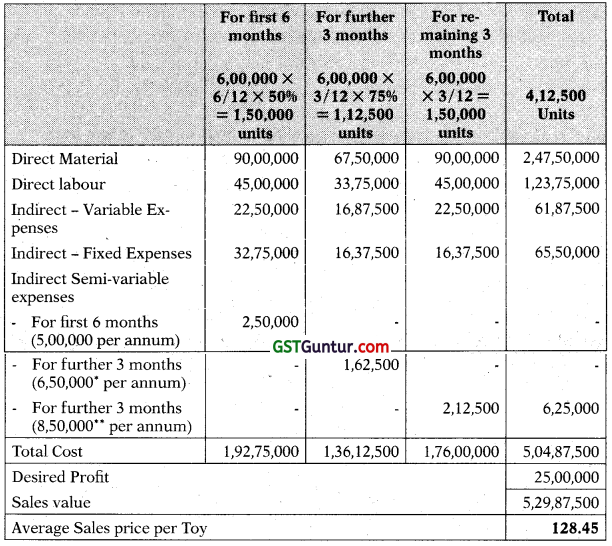
From the above information prepare Revenue (Flexible) budget for the year 2022 and also show the budgeted profit/loss for the year. [CA Inter RTP May 2022]
Answer:
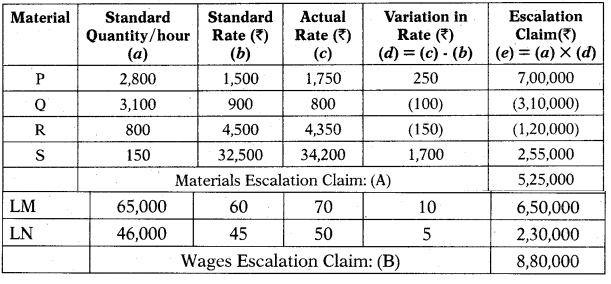
Revenue Budget (Flexible Budget) of Maharatna Ltd. for the Year 2022
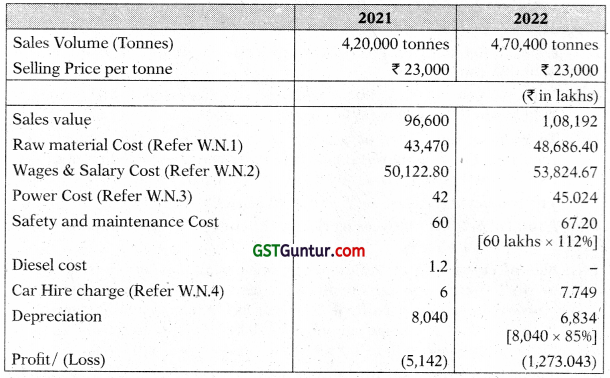
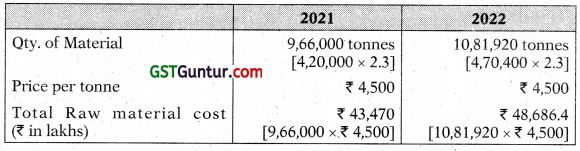
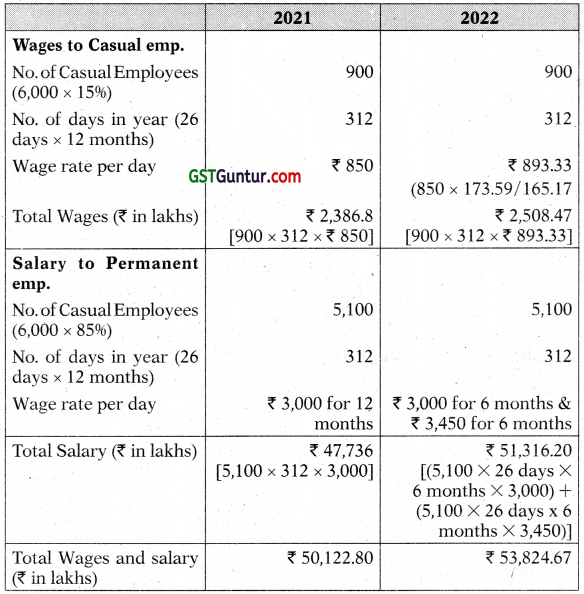
Working Notes:
1. Calculation of Raw Material Cost:
2. Calculation of Wages and Salary Cost:
3. Calculation of Power Cost:
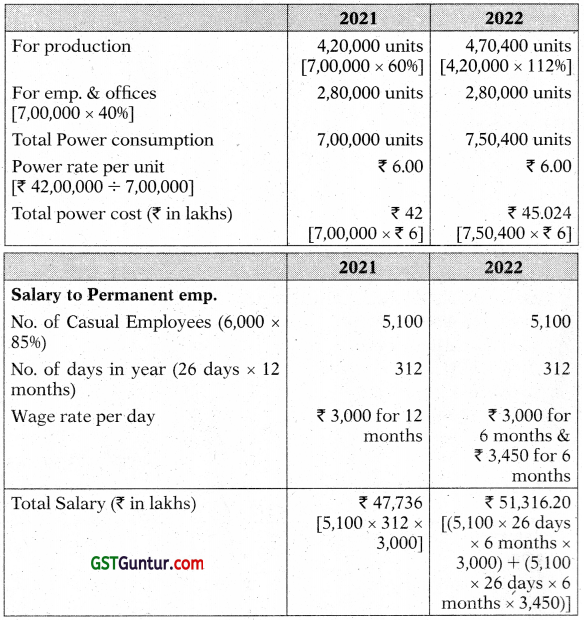
4. Calculation of Car Hire Charges:
![]()
Expense Budget
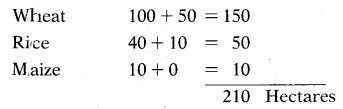
Question 7.
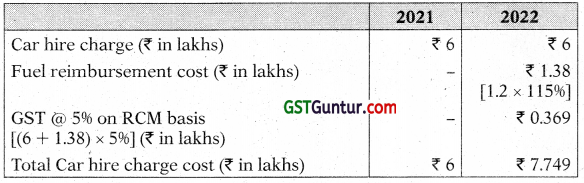
KLM Limited has prepared its expense budget for 50,000 unIts in its factory for the year 2020-2 1 as detailed below:
| ₹ per unit | |
| Direct Materials | 125 |
| Direct Labour | 50 |
| Variable Overhead | 40 |
| Direct Expenses | 15 |
| Selling Expenses (20% fixed) | 25 |
| Factory Expenses (100% fixed) | 15 |
| Administration expenses (100% fixed) | 8 |
| Distribution expenses (85% variable) | 20 |
| Total | 298 |
Prepare an expense budget for the production of 35,000 units and 70,000 units. [CA Inter May 2013, Nov 2019, RTP]
Answer:
Expense Budget of KLM Ltd.
| Selling Expenses: | Fixed cost per unit | = ₹ 25 × 20% = ₹ 5 |
| Fixed Cost | = ₹ 5 × 50,000 units | = ₹ 2,50,000 |
| Variable Cost Per unit | = ₹ 25 – ₹ 5 | = ₹ 20 |
| Distribution Expenses: | Fixed cost per unit | = ₹ 20 × 15% = ₹ 3 |
| Fixed Cost | = ₹ 3 × 50,000 units | = ₹ 1,50,000 |
| Variable cost per unit | = ₹ 20 – ₹ 3 | = ₹ 17 |
![]()
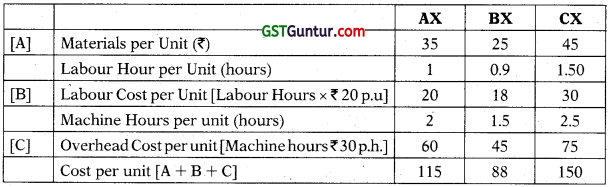
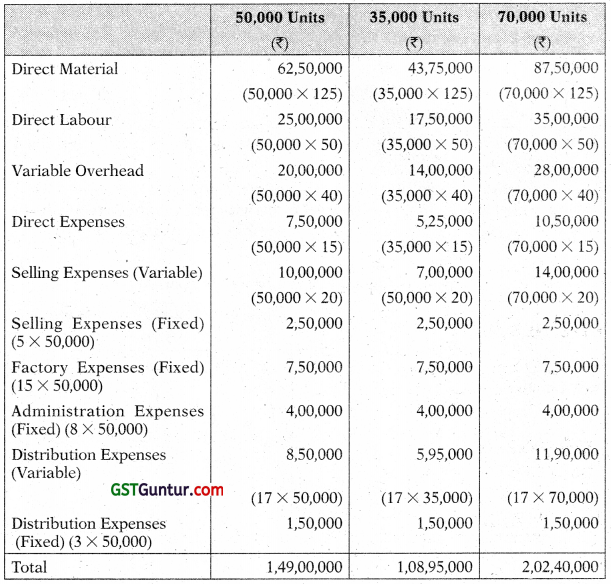
Question 8.
RST Limited is presently operating at 50% capacity and producing 30,000 units. The entire output is sold at a price of ₹ 200 per unit. The cost structure at the 50% level of activity is as under:
| ₹ | |
| Direct Material | 75 per unit |
| Direct Wages | 25 per unit |
| Variable Overheads | 25 per unit |
| Direct Expenses | 15 per unit |
| Factory Expenses (25% fixed) | 20 per unit |
| Selling and Distribution Exp. (80% variable) | 10 per unit |
| Office and Administrative Exp. (100% fixed) | 5 per unit |
The company anticipates that the variable costs will go up by 10% and fixed costs will go up by 15%.
You are required to prepare an Expense budget, on the basis of marginal cost for the company at 50% and 60% level of activity and find out the profits at respective levels. [CA Inter Nov. 2014, 8 Marks]
Answer:
Note:
50% level of activity = 30,000 units (given)
60% level of activity = \(\frac{30,000 \text { units } \times 60 \%}{50 \%}\) = 36,000 units
Functional Budget
Question 9.
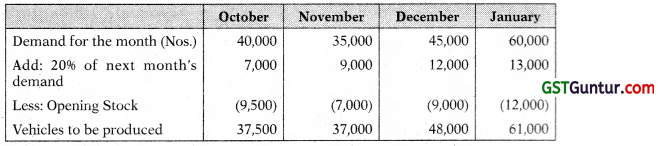
A Vehicle manufacturer has prepared sales budget for the next few months, and the following draft figures are available:
| Month | No. of vehicles |
| October | 40,000 |
| November | 35,000 |
| December | 45,000 |
| January | 60,000 |
| February | 65,000 |
To manufacture a vehicle a standard cost of ₹ 11,42,800 is incurred and sold through dealers at a uniform selling price of ₹ 17,14,200 to customers. Dealers are paid 15% commission on selling price on sale of a vehicle.
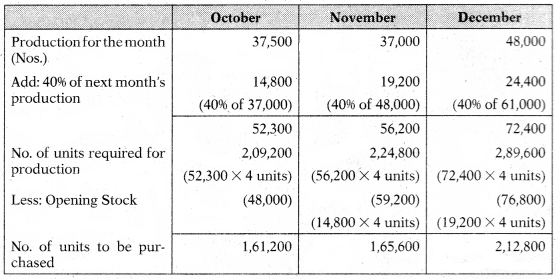
Apart from other materials, four units of Part-X are required to manufacture a vehicle. It is a policy of the company to hold stocks of Part-X at the end of each month to cover 40% of next month’s production. 48,000 units of Part-X are in stock as on 1st October.
There are 9,500 Nos. of completed vehicles in stock as on 1st October and it is policy to have stocks at the end of each month to cover 20% of the next month’s sales.
You are required to
(i) Prepare Production budget (in Nos.) for the month of October, November, December and January.
(ii) Prepare a Purchase budget for Part-X (in units) for the months of October, November and December.
(iii) Calculate the budgeted gross profit for the quartet October to December. [CA Inter May 2020 RTP]
Answer:
(i) Preparation of Production Budget (in units)
(ii) Preparation of Purchase budget for Part-X
(iii) Budgeted Gross Profit for the Quarter October to December
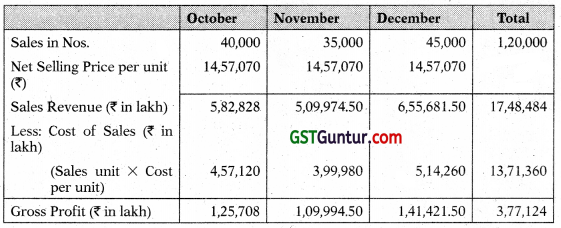
Net Selling Price per unit = ₹ 17,14,200 – (15% commission on ₹ 17,14,200) = ₹ 14,57,070
![]()
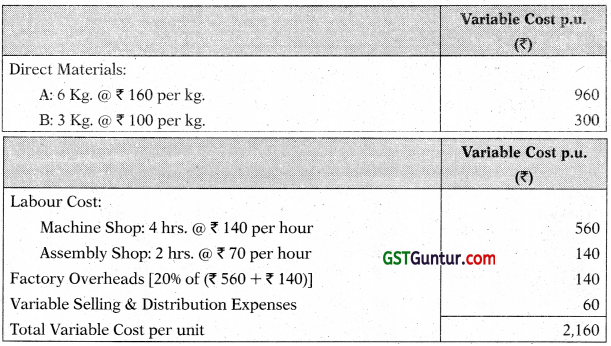
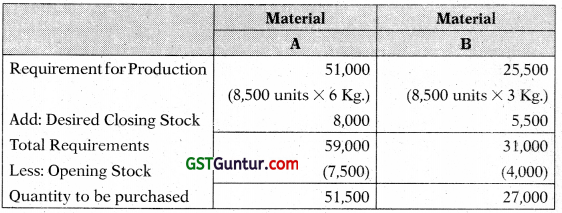
Question 10.
RS Ltd. manufactures and sells a single product and has estimated sale;; revenue of ₹ 302.4 lakh during the year based on 20% profit on selling price. Each unit of product requires 6 kg of material A and 3 kg of material B and processing time of 4 hours in machine shop and 2 hours in assembly shop Factory overheads are absorbed at a blanket rate of 20% of direct labour. Variable selling & distribution overheads are ₹ 60 per unit sold and fixed selling & distribution overheads are estimated to be ₹ 69,12,000.
The other relevant details are as under:
Purchase Price:
Material A ₹ 160 per kg
Material B ₹ 100 per kg
Labour Rate:
Machine Shop ₹ 140 per hour
Assembly Shop ₹ 70 per hour
| Finished Stock | Material A | Material B | |
| Opening Stock | 2,500 units | 7,500 kg | 4000 kg |
| Closing Stock | 3,000 units | 8,000 kg | 5,500kg |
Required:
(i) Calculate number of units of product proposed to be sold and selling price per unit,
(ii) Prepare Production Budget in units, and
(iii) Prepare Material Purchase Budget in units. [CA Inter May 2021 RTP]
Answer:
Statement Showing ‘Total Variable Cost for the year’
| Estimated Sales Revenue | 3,02,40,000 |
| Less: Desired Profit Margin on Sale @ 20% | 60,48,000 |
| Estimated Total Cost | 2,41,92,000 |
| Less: Fixed Selling and Distribution Overheads | 69,12,000 |
| Total Variable Cost | 1,72,80,000 |
Statement Showing ‘Variable Cost per unit’.
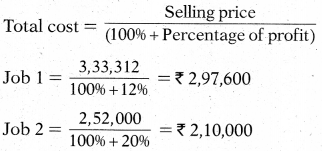
(i) Calculation of number of units of product proposed to be sold and selling price per unit ?
Number of Units Sold = Total Variable Cost/Variable Cost per unit
= ₹ 1,72,80,000/₹ 2,160
= 8,000 units
Selling Price per unit = Total Sales Value/Number of Units Sold
= ₹ 3,02,40,000/8,000 units
= ₹ 3,780
![]()
(ii) Production Budget (units)
| Units | |
| Budgeted Sales | 8,000 |
| Add: Closing Stock. | 3,000 |
| Total Requirements | 11,000 |
| Less: Opening Stock | (2,500) |
| Required Production | 8,500 |
(iii) Materials Purchase Budget (kg.)
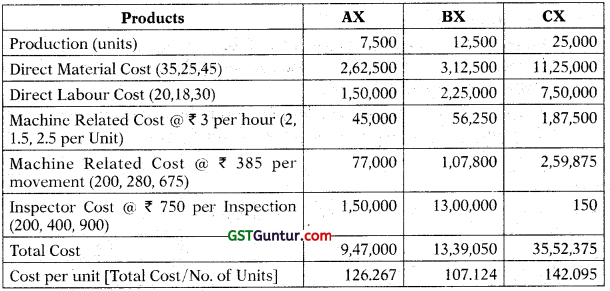
Question 11.
AK Limited produces and sells a single product. Sales budget for calendar year 2021 by a quarters is as under:

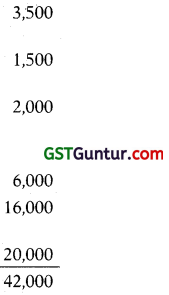
The year is expected to open with an inventory of 6,000 units of finished products and close with inventory of 8,000 units. Production is customarily scheduled to provide for 70% of the current quarter’s sales demand plus 30% of the following quarter demand. The budgeted selling price per unit is ₹ 40. The standard cost details for one unit of the product are as follows: Variable Cost ₹ 34.50 per unit.
Fixed Overheads ₹ 2 hours 30 minutes @ ₹ 2 per hour based on a budgeted production volume of 1,10,000 direct labour hours for the year. Fixed overheads are evenly distributed throughout the year.
You are required to:
(i) Prepare Quarterly Production Budget for the year.
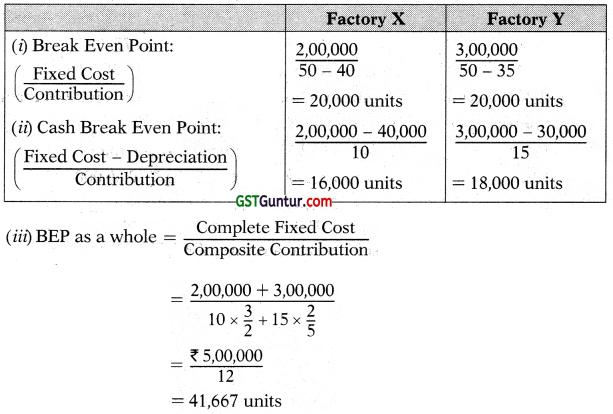
(ii) In which quarter of the year, company expected to achieve bread-even point. [CA Inter May 2012, 5 Marks]
Answer:
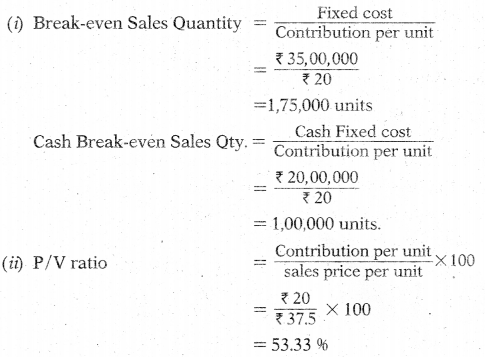
(i) Production Budget for the year 2021 by Quarters
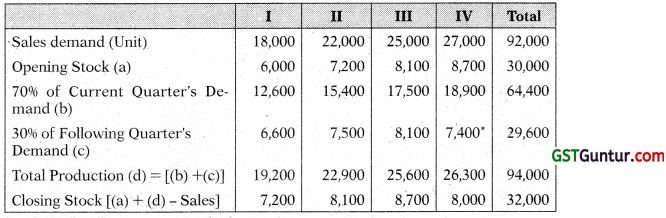
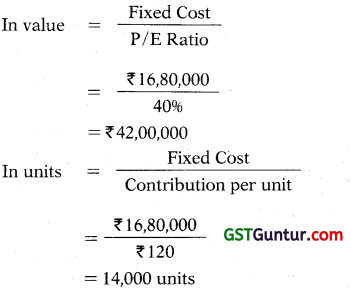
(ii) Break Even Point = Fixed Cost/ Contribution per unit
= 2,20,000/₹ 5.50 = 40,000 units
Contribution per unit = ₹ 40 – ₹ 34.50 = ₹ 5.50
Total sales in the quarter II is 40000 equal to BEP means BEP achieved in II quarter.
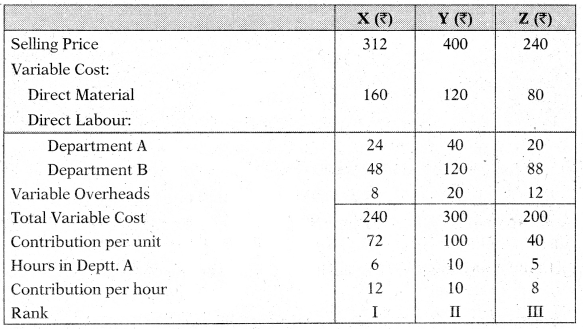
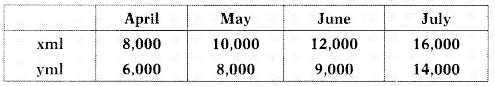
Question 12.
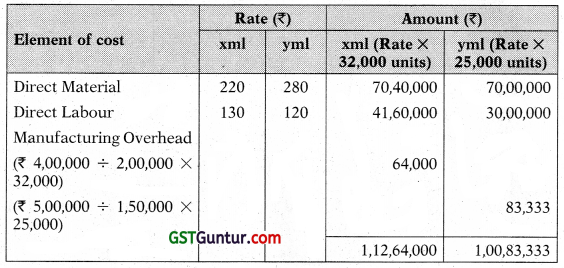
X Y Z Limited is drawing a production plan for its two products – Product ‘xml’ and ‘Product ‘yml’ for the year 2020-21. The company’s policy is to maintain closing stock of finished goods at 25% of the anticipated volume of sales of the succeeding month.
The following are the estimated data for the two products:
| xml | yml | |
| Budgeted Production (in units) | 2,00,000 | 1,50,000 |
| Direct Material (per unit) | ₹ 220 | ₹ 280 |
| Direct Labour (per unit) | ₹ 130 | ₹ 120 |
| Direct Manufacturing Expenses | ₹ 4,00,000 | ₹ 5,00,000 |
The estimated units to he sold in the first four months of the year 2020-21 are as under:
Prepare:
(i) Production Budget (Month wise)
(ii) Production cost Budget (for first quarter of the year) [CA Inter May 2015, 5 Marks]
Answer:
(i) Production Budget of Product ‘xml’ and ‘yml’ (month wise in units)
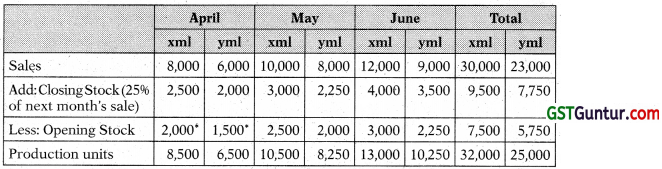
Opening stock of April is the closing stock of March, which is as per company’s policy 25% of next months sale.
(ii) Production Cost Budget (for first quarter of the year)
![]()
Question 13.
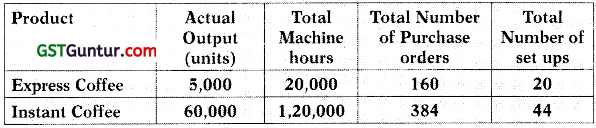
An electronic gadget manufacturer has prepared sales budget for the next few months. In this respect, following figures are available:
| Months | Electronic gadgets’ sales |
| January | 5000 units |
| February | 6000 units |
| March | 7000 units |
| April | 7500 units |
| May | 8000 units |
To manufacture an electronic gadget, a standard cost of ₹ 1,500 is incurred l and it is sold through dealers at an uniform price of ₹ 2,000 per gadget to customers. Dealers are given a discount of 15% on selling price.
Apart from other materials, two units of batteries are required to manufacture a gadget. The company wants to hold stock of batteries at the end of each month to cover 30% of next month’s production and to hold slock of manufactured gadgets to cover 25% of the next month’s sale.
3,250 units of batteries and 1,200 units of manufactured gadgets were in stock on 1st January.
Required:
(i) Prepare production budget (in units) for the month of January, February, March and April.
(ii) Prepare purchase budget for batteries (in units) for the month of January, February and March and calculate profit for the quarter ending on March. [CA Inter Nov. 2018, 10 Marks]
Answer:
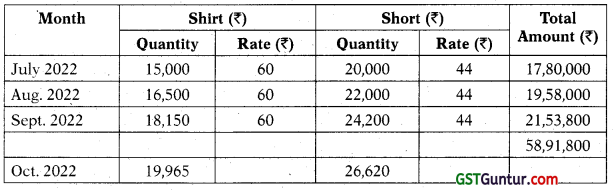
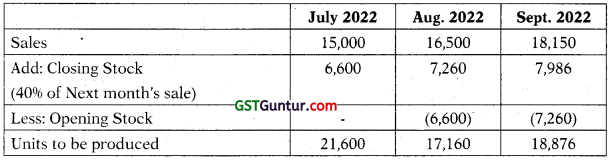
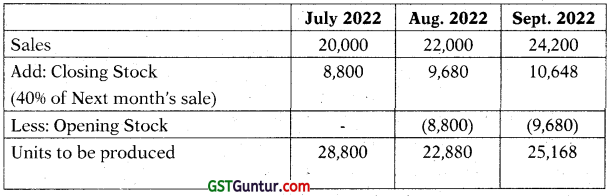
(i) Preparation of Production Budget (in Units)
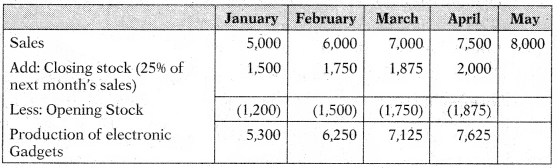
(ii) Preparation of Purchase budget
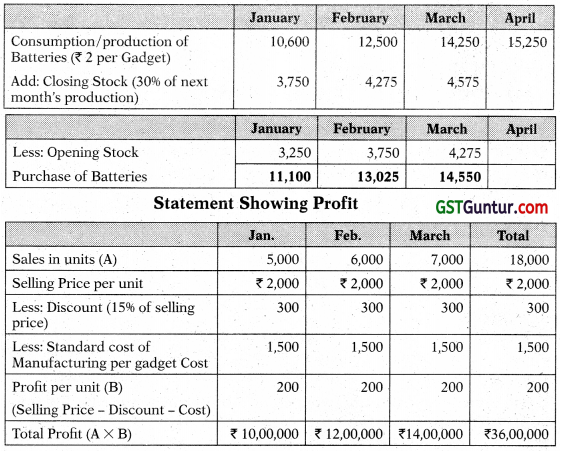
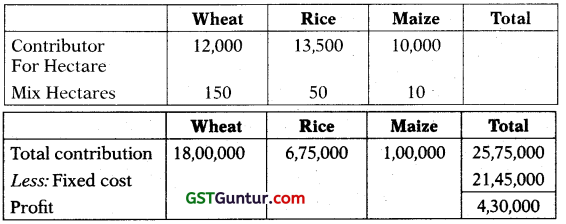
Question 14.
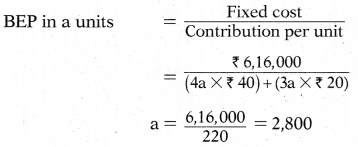
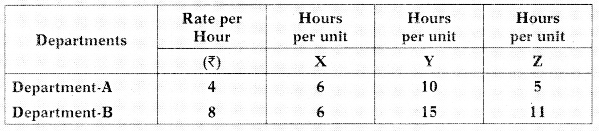
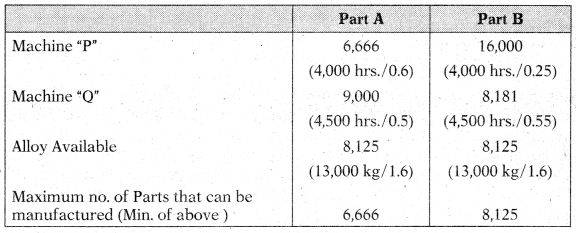
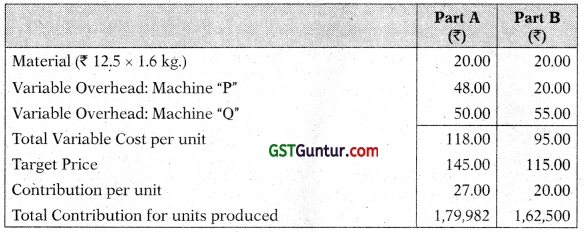
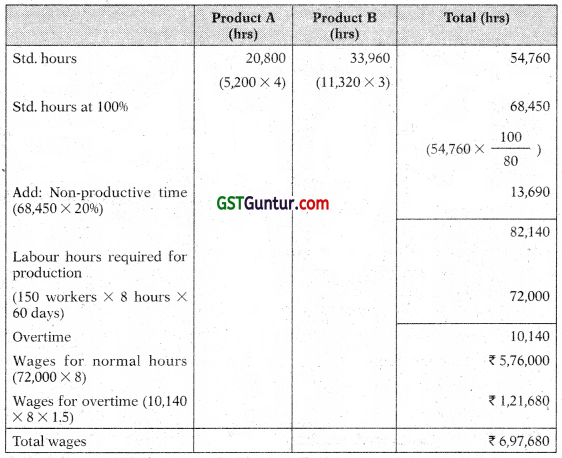
A Company manufactures two Products A and B by making use of two types of materials, viz., X and Y. Product A requires 10 units of X and 3 units of Y. Product B requires 5 units of X and 2 units of Y. The price of X is 2 per unit and that of Y is 3 per unit. Standard hours allowed per product are 4 and 3, respectively. Budgeted wages rate is 8 per hour. Overtime premium is 50% and is payable, if a worker works for more than 40 hours a week. There are 150 workers.
The Sales Manager has estimated the sales of Product A to be 5,000 units and Product B 10,000 units. The target productivity ratio (or efficiency ratio) for the productive hours worked by the direct worker in actually manufacturing the product is 80%, in addition, the non-productive downtime is budgeted at 20% of the productive hours worked. There are twelve 5-day weeks in the budget period and it is anticipated that sales and production will occur evenly throughout the whole period.
It is anticipated that stock at the beginning of the period will be:
Product A 800 units; Product B 1,680 units. The targeted closing stock ex-pressed in terms of anticipated activity during the budget period are Product A 12 days sales; Product B 18 days sales. The opening and closing stock of raw material of X and Y will be maintained according to requirement of stock position for Products A and B.
You are required to prepare the following for the next period:
(i) Material usage and Material purchase budget in terms of quantities and values.
(ii) Production budget.
(iii) Wages budget for the direct workers. [CA Final Nov. 2004, 8 Marks]
Answer:
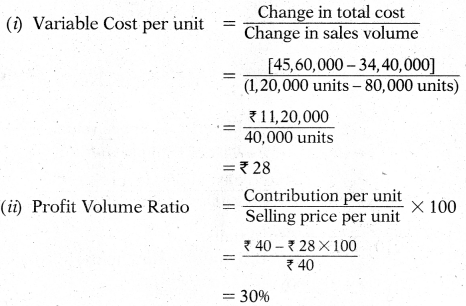
(i) Material Usage
(ii) Production Budget
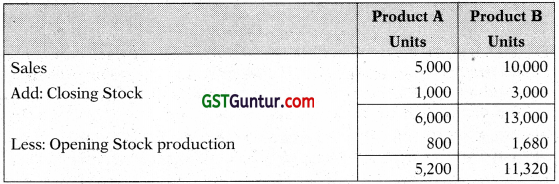
Note: Computation of closing stock
Budgeted period (12 weeks × 5) = 60 days
Budgeted closing stock:
Product A = 12 days sales = \(\frac{5,000 \times 12}{60}\) = 1,000 units
Product B = 18 days sales = \(\frac{10,000 \times 18}{60}\) = 3,000 units
![]()
(iii) Wages Budget
Question 15.
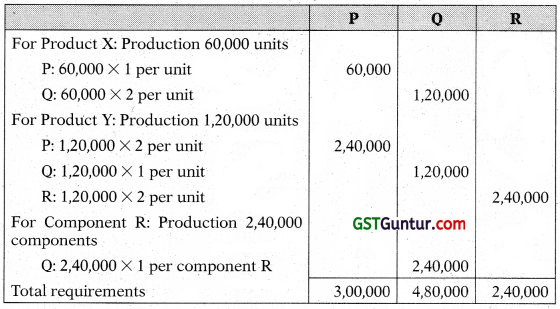
Company is engaged in manufacturing two products ‘X’ and ‘ Y’ Product X uses one unit of component *P’ and two units of component ‘Q\ Product ‘Y’ uses two units of component ‘P’, one unit of component ‘Q’ and two units of component ‘R’. Component ‘R’ which is assembled in the factory uses one unit of component ‘O’.
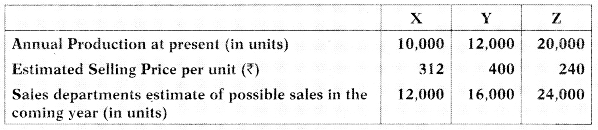
Components ‘P’ and ‘Q’ are purchased from the market. The company has prepared the following forecast of sales and inventory for the next year:
| Product ‘X’ | Product ‘Y’ | |
| Sales (in units) | 80,000 | 1,50,000 |
| At the end of the years | 10,000 | 20,000 |
| At the beginning of the year | 30,000 | 50,000 |
The production of both the products and the assembling of the component R’ will be spread out uniformly throughout the year.
The company at present orders its inventory of ‘P’ and ‘Q’ in quantities equivalent to 3 months production. The company has compiled the following data related to two components:
| P | Q | |
| Price per unit (₹) | 20 | 8 |
| Order placing cost per order (₹) | 1,500 | 1,500 |
| Carrying cost per annum | 20% | 20% |
Required:
(a) Prepare a Budget of production and requirements of components during next year.
(b) Suggest the optimal order quantity of components ‘P’ and ‘Q’. [CA Final May 2006, 11 Marks]
Answer:
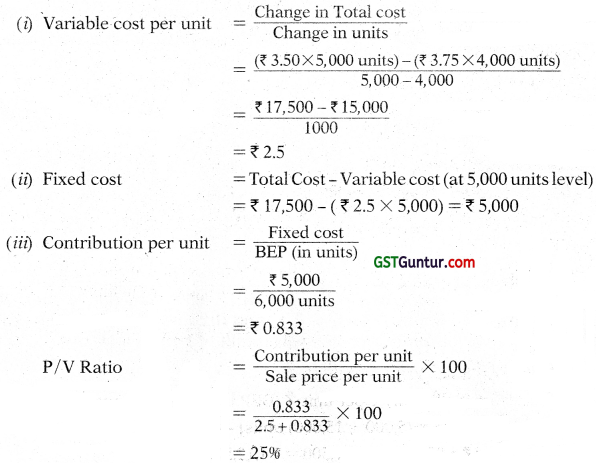
(a) Production Budget for products X and Y
| X units | Y units | |
| Inventory at the end of the year
Sales forecast Total requirements Less: Beginning inventory Production |
10,000
80,000 |
20,000
1,50,000 |
| 90,000
30,000 |
1,70,000
50,000 |
|
| 60,000 | 1,20,000 |
Budgeted requirements of components P, Q and R
(b) Optimal order quantity:
P = \(\sqrt{\frac{2 \times 3,00,000 \times 1,500}{20 \times 20 \%}}\) = 15,000 components
Q = \(\sqrt{\frac{2 \times 4,80,000 \times 1,500}{8 \times 20 \%}}\) = 30,000 components
![]()
Question 16.
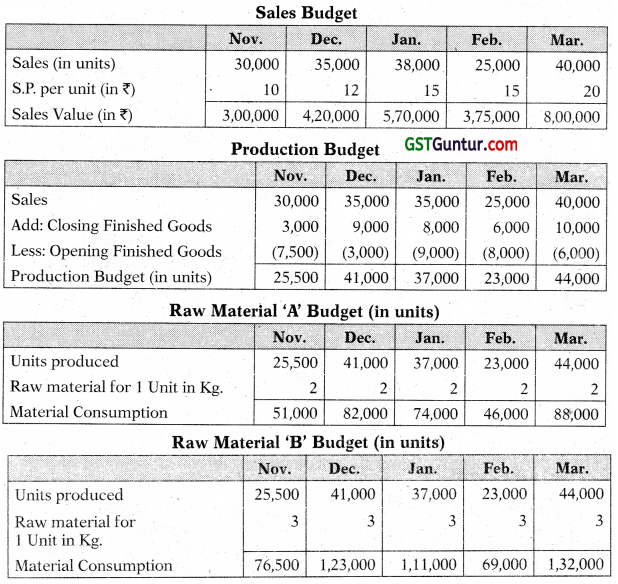
PVS Ltd. manufactures and sells a single product and estimated the following related information for the period November, 2020 to March, 2021.
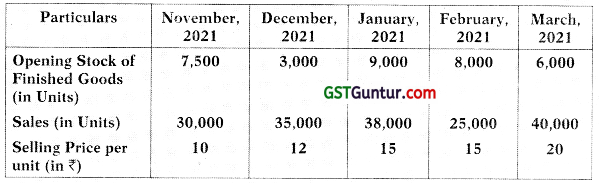
Additional information:
- Closing stock of finished goods at the end of March, 2021 is 10,000 units.
- Each unit of finished output requires 2 kg. of Raw Material ‘A’ and 3kg of Raw Material ‘B’.
You are required to prepare the following budgets for the period November, 2020 to March, 2021 on monthly basis:
(i) Sales Budget (in ₹)
(ii) Production budget (in units)
(iii) Raw materials ‘A’ and ‘B’ separately (in units) [CA Inter July 2021, 5 Marks]
Answer:
Question 17.
XY Co. Ltd. manufactures two products viz., X and Y and sells them through two divisions, East and West. For the purpose of Sales Budget to the Budget Committee, following information has been made available for the year 2019-20:
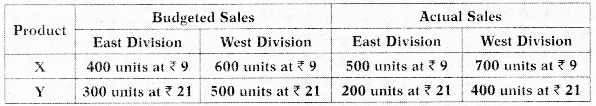
Adequate market studies reveal that product X is popular but under priced. It is expected that if the price of X is increased by ₹ 1, it will, find a ready market. On the other hand, Y is overpriced and if the price of Y is reduced by x 1 it will have more demand in the market. The company management has agreed for the aforesaid price changes. On the basis of these price changes and the reports of salesmen, following estimates have been prepared by the Divisional Managers:
Percentage increase in sales over budgeted sales
| Product | East Division | West Division |
| X | + 10% | + 5% |
| Y | + 20% | + 10% |
With the help of intensive advertisement campaign, following additional sales (over and above the abovementioned estimated sales by Divisional Managers) are possible:
| Product | East Division | West Division |
| X | 60 units | 70 units |
| Y | 40 units | 50 units |
You are required to prepare Sales Budget for 2020-21 after incorporating above estimates and also show the Budgeted Sales and Actual Sales of 201920. [CA Inter Nov. 2015, 8 Marks]
Answer:
Statement Showing Sales Budget for 2020-21
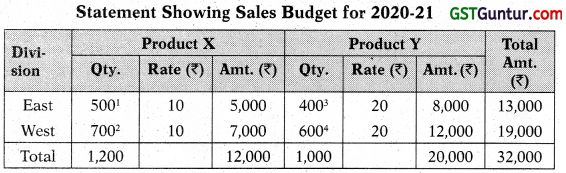
Working Notes:
1. 400 × 11096 + 60 = 500 units
2. 600 × 10596 + 70 = 700 units
3. 300 × 12096 + 40 = 400 units
4. 500 × 11096 + 50 = 600 units
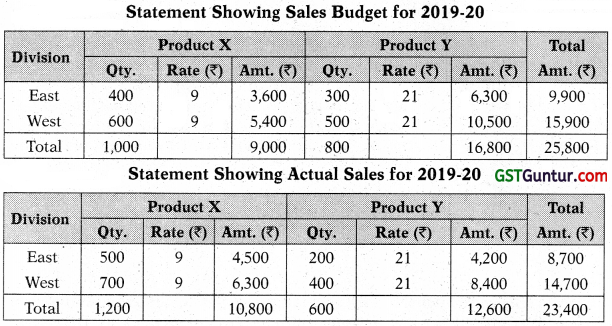
Statement Showing Sales Budget for 2019-20
![]()
Question 18.
Following is the sales budget for the first six months of the year 2021 in respect of FOR Ltd. :
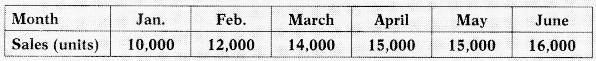
Finished goods inventory at the end of each month is expected to be 20H» of budgeted sales quantity for the following month. Finished goods inventory was 2,700 units on January 1, 2021. There would be no work-in-progress at the end of any month.
Each unit of finished product requires two types of materials as detailed below:
Material X : 4 kgs @ ₹ 10/kg
Material Y : 6 kgs @ ₹ 15/kg
Material on hand on January 1,2021 was 19,000 kgs of material X and 29,000 kgs of material Y. Monthly closing stock of material is budgeted to be equal to half of the requirements of next month’s production.
Budgeted direct labour hour per unit of finished product is 3/4 hour.
Budgeted direct labour cost for the first quarter of the year 2021 is ₹ 10,89,000.
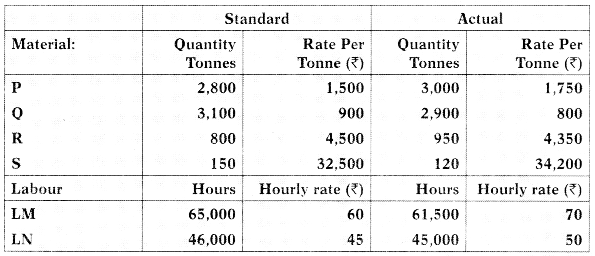
Actual data for the quarter one, ended on March 31, 2021 is as under:
Actual production quantity: 40,000 units
Direct material cost
(Purchase cost based on materials actually issued to production)
Material X : 1,65,000 kgs @ ₹ 10.20/kg
Material Y : 2,38,000 kgs @ ₹ 15.10/kg
Actual direct labour hours worked: 32,000 hours
Actual direct labour cost: ₹ 13,12,000
Required:
(a) Prepare the following budgets:
(i) Monthly production quantity for the quarter one.
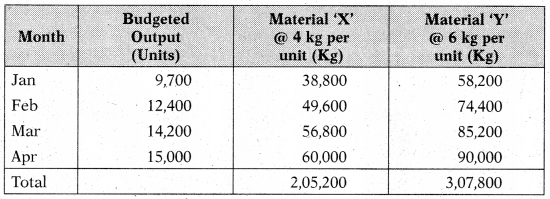
(ii) Monthly raw material consumption quantity budget from January, 2021 to April, 2021.
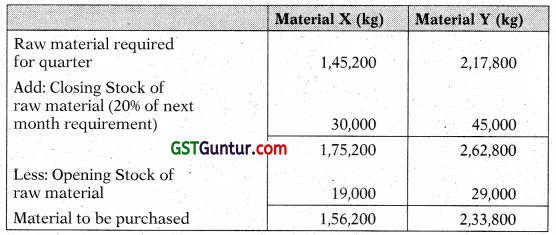
(iii) Materials purchase quantity budget for the quarter one.
(b) Compute the follow ing variances :
(i) Material cost variance
(ii) Material price variance
(iii) Material usage variance
(iv) Direct labour cost variance
(v) Direct labour rate variance
(vi) Direct labour efficiency variance [ICAI Module]
Answer:
(a) (i)
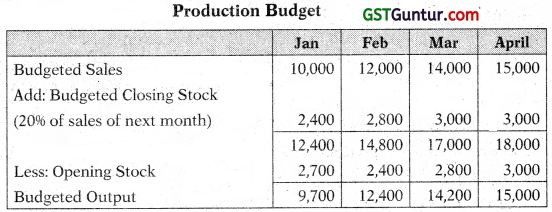
Total Budgeted Output for the Quarter ended March 31, 2009
= (9,700 + 12,400 + 14,200)
= 36,300 units.
(ii) Raw Material Consumption Budget (in quantity)
(iii) Raw Materials Purchase Budget (in quantity)
(b) Computation of variances
Material variances
Calculation of Standard Quantity (SQ):
Material X = 40,000 × 4 = 1,60,000 kgs.
Material Y = 40,000 × 6 = 2,40,000 kgs.
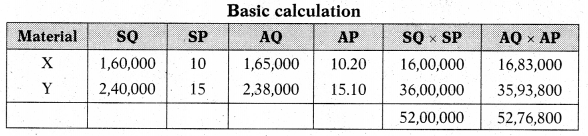
Basic calculation
Calculation of Material Variances:
(a) Material Cost Variance = (SQ × SP) – (AQ × AP)
Material X = 16,00,000 – 16,83,000 = 83,000 (A)
Material Y = 36,00,000 – 35,93,800 = 6.200 (F)

(b) Material Price Variance = AQ (SP – AP)
Material X = 1,65,000 (10 – 10.20) = 33,000 (A)
Material Y = 2,38,000 (15 – 15.10) = 23.800 (A)

(c) Material Usage Variance = SP (SQ – AQ)
Material X = 10 (1,60,000 – 1,65,000) = 50,000 (A)
Material Y = 15 (2,40,000 – 2,38,000) = 30,000 (F)

Labour Variances:
Budgeted output for the quarter = 36,300 units
Budgeted hours = 36,300 units × 3/4 = 27,225 hours
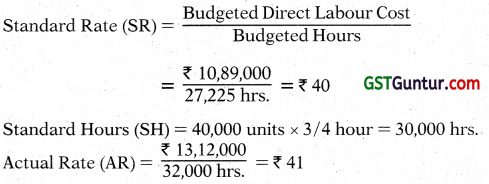
Calculation of Labour Cost Variances:
(a) Direct Labour Cost Variance = (SH × SR) – (AH × AR)
= (30,000 × 40) – (32,000 × 41)
= 1,12,000 (A)
(b) Direct Labour Rate Variance = AH (SR – AR)
= 32,000 (40 – 41)
= 32,000 (A)
(c) Direct Labour Efficiency Variance = SR (SH – AH)
Material X = 40 (30,000 – 32,000)
Material Y = 80,000 (A)
![]()
Budget Ratios
Question 19.
Calculate Efficiency and Capacity ratio from the following figures:
| Budgeted production | 80 units |
| Actual production | 60 units |
| Standard lime per unit | 8 hours |
| Actual hours worked | 500 |
[CA Inter Nov. 2007, 2 Marks]
Answer:
Standard hour for actual production = 60 units × 8 hours = 480 hours
Actual hours worked = 500 hours
Budgeted hours = 80 units × 8 hours = 640 hours
Efficiency Ratio = \(\frac{\text { Standard hours for actual production }}{\text { Actual hours worked }}\) × 100
= \(\frac{480}{500}\) × 100
= 96%
Capacity Ratio = \(\frac{\text { Actual hours worked }}{\text { Budgeted hours }}\) × 100
= \(\frac{500}{640}\) × 100
= 78.125%
Question 20.
Calculate efficiency and activity ratio from the following data:
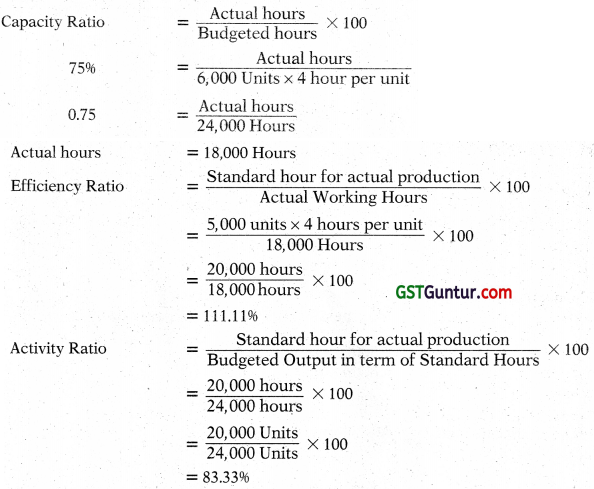
Capacity ratio = 75%
Budgeted output = 6,000 units
Actual output = 5,000 units
Standard Time per unit = 4 hours [CA Inter Nov. 2009, 2 Marks]
Answer:
Question 21.
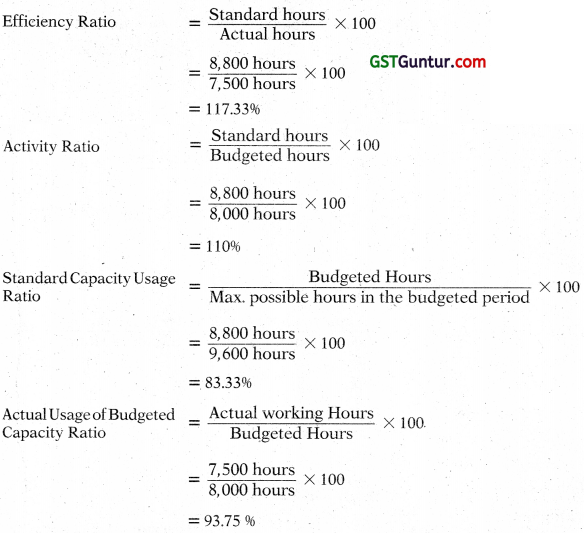
Following data is available for ABC Ltd:
| Standard working hours | 8 hours per day of 5 days per week |
| Maximum Capacity | 60 employees |
| Actual working | 50 employees |
| Actual hours expected to be worked per four week | 8,000 hours |
| Standard hours expected to be earned per hour week | 9,600 hours |
| Actual hours worked in the four week period | 7,500 hours |
| Standard hours earned in the four week period | 8,800 hours |
The related period is of four weeks. Calculate the following Ratios:
(i) Efficiency Ratio
(ii) Activity Ratio
(iii) Standard Capacity Usage Ratio
(iv) Actual Capacity Usage Ratio
(v) Actual Usage of Budgeted Capacity Ratio [CA Inter May 2019, 5 Marks]
Answer:
![]()
Miscellaneous
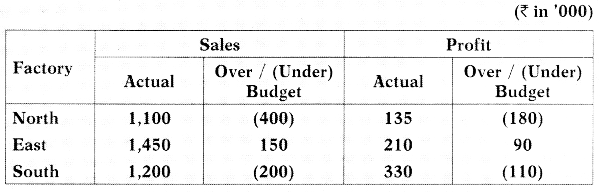
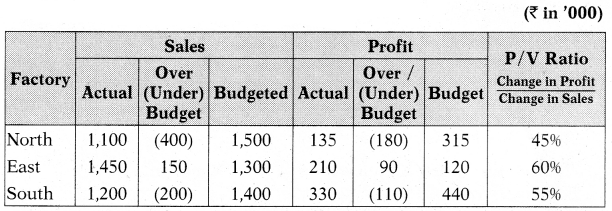
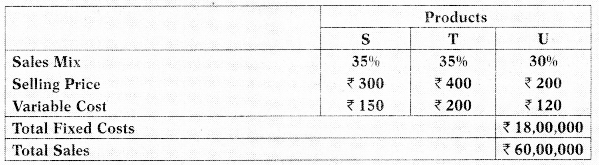
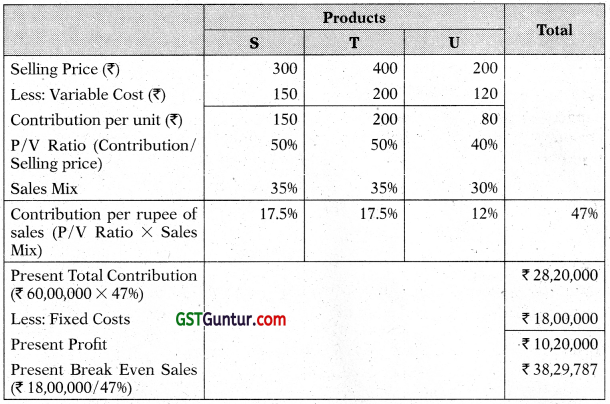
Question 22.
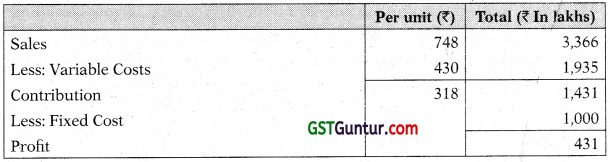
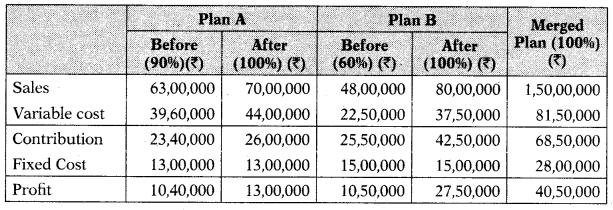
Company prepared the following budget for a year:
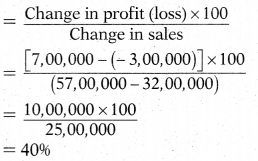
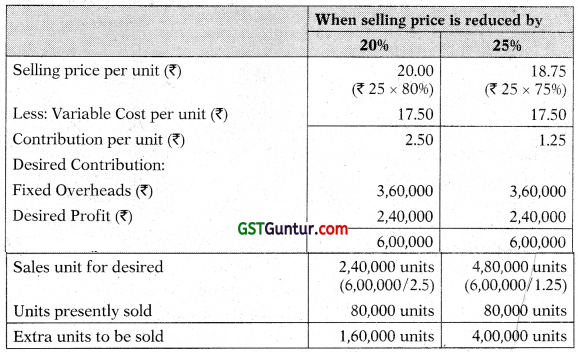
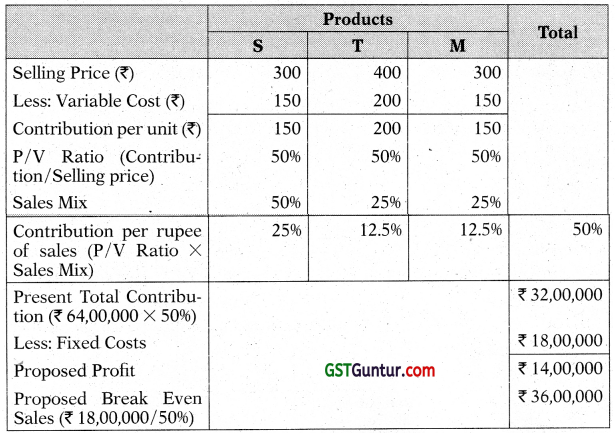
After evaluating the half-yearly performance, it was observed that the Company would be able to achieve only 80% of the original budgeted sales. The revised budgeted sale as envisaged above was estimated at 1,080 lakhs after taking into account a reduction in the selling price by 10%.
You are required to prepare a statement showing the break up of the original and revised budget for the year. [CA Final May 2000, 6 Marks]
Answer:
Statement showing the break-up of the original and revised for a year:
(₹ in lakhs)

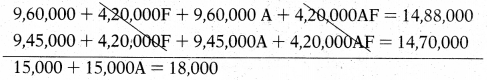
Working notes:
1. Revised budgeted sales (after taking into account 10% reduction in selling price)
If revised budgeted S.P, is ₹ 90, the original budgeted S.P. is 100
If revised budgeted S.P. is ₹ 1, the original budgeted S.P. is \(\frac{100}{90}\)
If revised budgeted sales at revised S.P. is ₹ 1080 lakhs then the revised budgeted sales at original S.P. will be \(\frac{100}{90}\) × 1080 lakhs = ₹ 1,200 lakhs
2. Original budgeted sales
If revised budgeted sales at original S.P. is ₹ 80 then the original budgeted sales at original selling price is ₹ 100.
If revised budgeted sales at original S.P. is ₹ 1 then the original sales at original selling price is \(\frac{₹ 100}{₹ 80}\).
If revised budgeted sales at original S.P. is ₹ 1,200 lakhs then the original budgeted sales at Original selling price is \(\frac{₹ 100}{₹ 80}\) × 1,200 lakhs = ₹ 1,500 Lakhs.
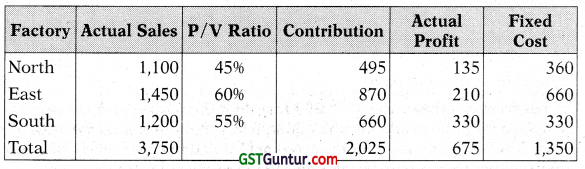
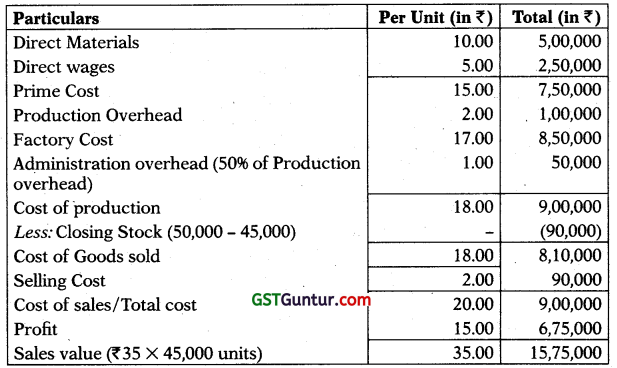
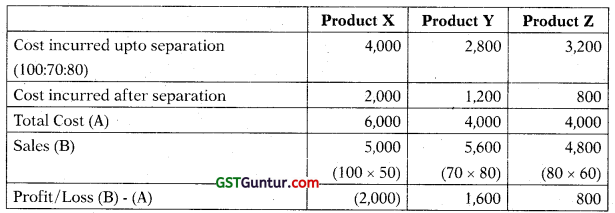
Question 23.
The information of Z Ltd. for the year ended 31st March, 2020 is as below:
| ₹ | |
| Direct materials | 17,50,000 |
| Direct wages | 12,50,000 |
| Variable factory overhead | 9,50,000 |
| Fixed factory overhead | 12,00,000 |
| Other variable costs | 6,00,000 |
| Other fixed costs | 4,00,000 |
| Profit | 8,50,000 |
| Sales | 70,00,000 |
During the year, the company manufactured two products X and Y, and the output and cost were:
| X | Y | |
| Output (units) | 8,000 | 4,000 |
| Selling price per unit (₹) | 600 | 550 |
| Direct material per unit (₹) | 140 | 157.50 |
| Direct wages per unit (₹) | 90 | 132.50 |
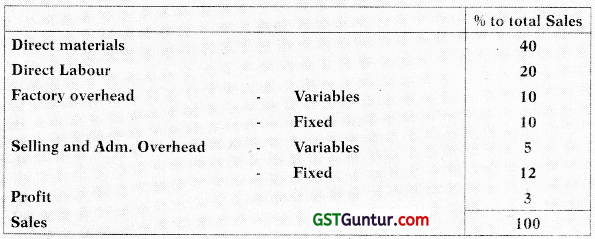
Variable factory overheads are absorbed as a percentage of direct wages and other variable costs are computed as:
Product X – ₹ 40 per unit and Product Y- ₹ 70 per unit
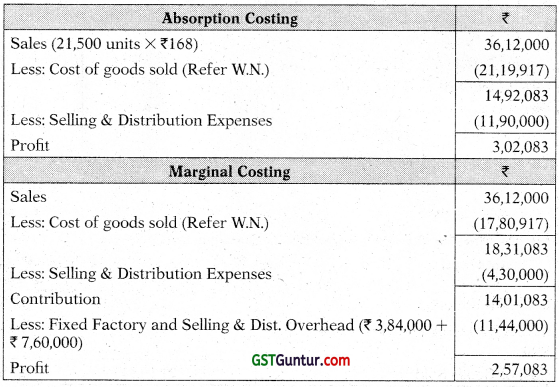
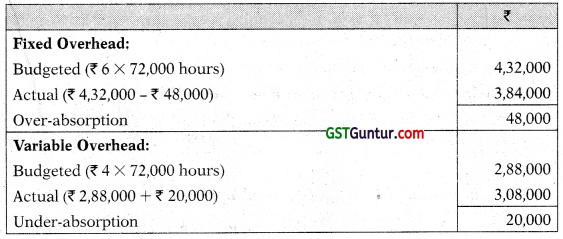
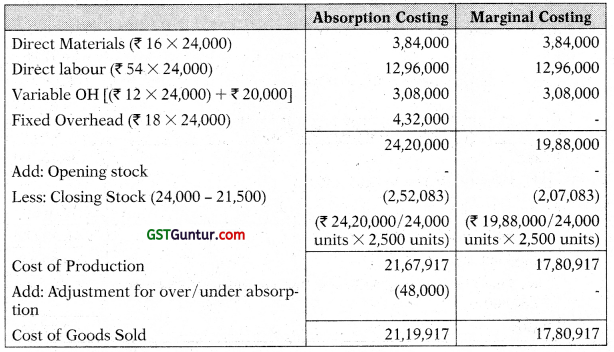
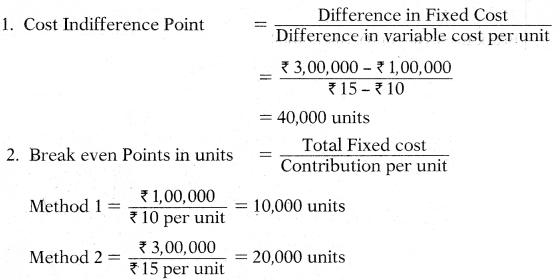
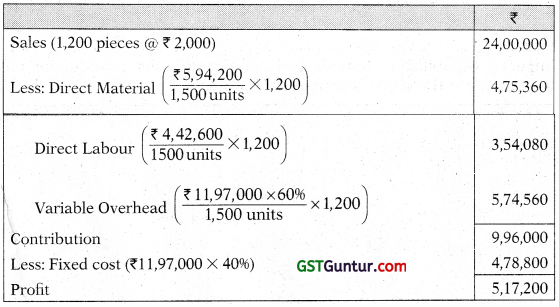
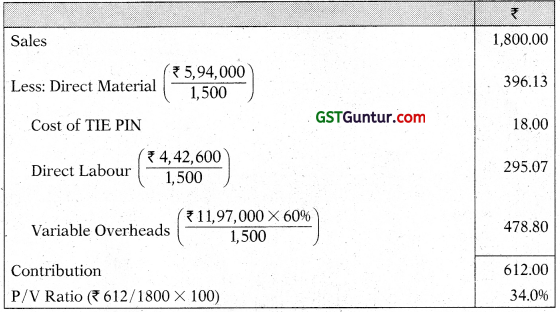
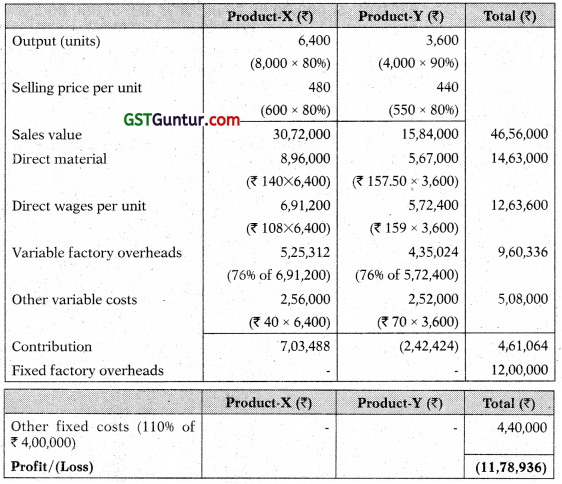
For the F,Y. 2020-21, it is expected that demand for products X and Y will fall by 20% & 10% respectively. It is also expected that direct wages cost will raise by 20% and other fixed costs by 10%. Products will be required to be sold at a discount of 20%.
You are required to:
(i) Prepare product-wise profitability statement on marginal costing method for the F.Y. 2019-20 and
(ii) Prepare a budget for the FY 2020-21. [CA Inter Nov. 2020 RTP]
Answer:
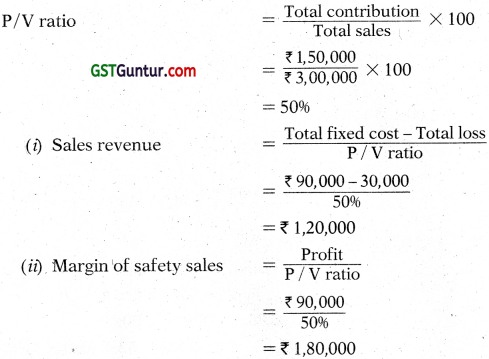
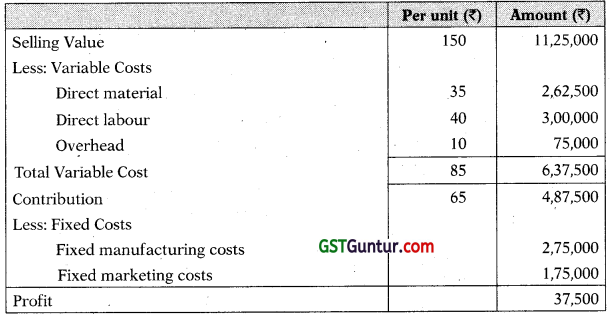
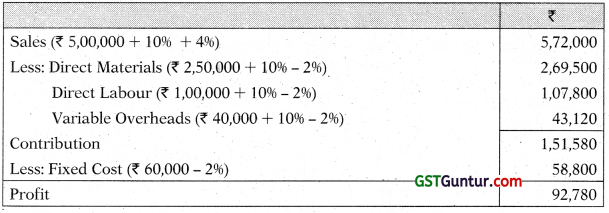
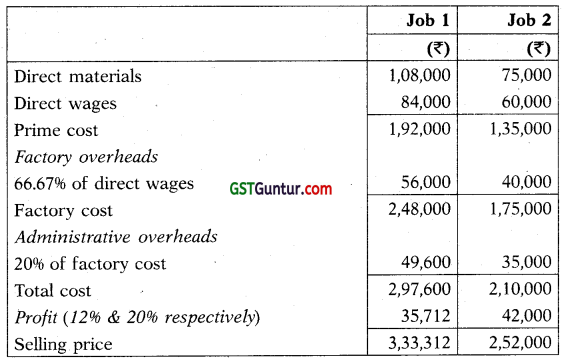
(i) Product-wise Profitability Statement for the FY 2019-20
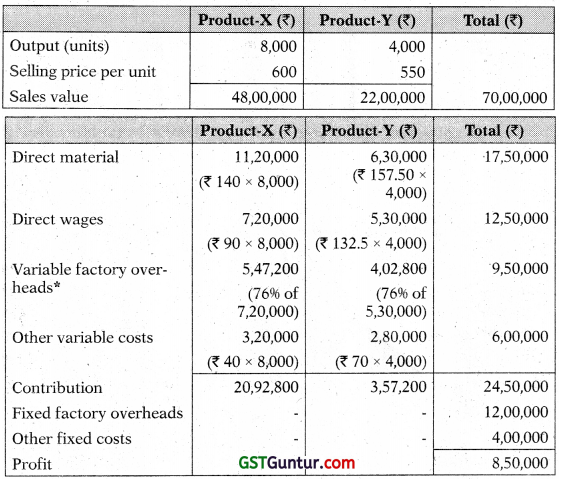
Variable factory overhead rate = \(\frac{\text { Variable factory overhead }}{\text { Direct wages }}\) × 100 = \(\frac{9,50,000}{12,50,000}\) × 100 = 76%
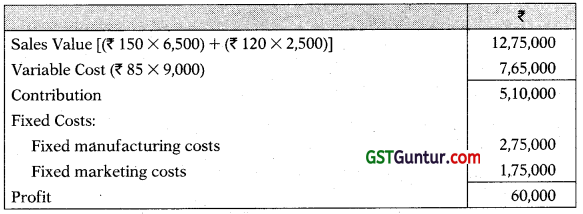
(ii) Preparation of Budget for the FY 2020-21:
![]()
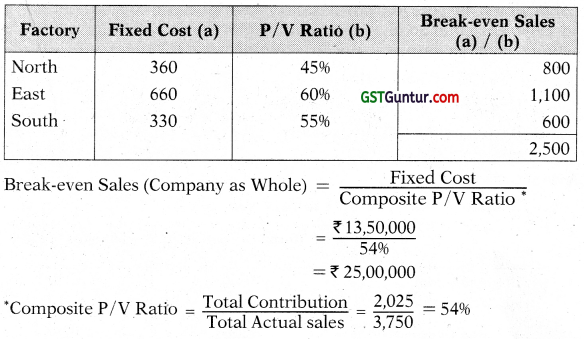
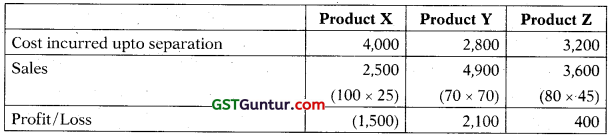
Question 24.
The accountant of manufacturing company provides you the following details for year 2019-20:
| ₹ | |
| Direct materials | 28,00,000 |
| Direct Wages | 16,00,000 |
| Fixed factory overheads | 16,00,000 |
| Variable factory overheads | 16,00,000 |
| Other variable costs | 12,80,000 |
| Other fixed costs | 12,80,000 |
| Profit | 18,40,000 |
| Sales | 1,20,00,000 |
During the year, the company manufactured two products A and B and the output and costs were:
| A | B | |
| Output (units) | 2,00,000 | 1,00,000 |
| Selling price per unit | ₹ 32.00 | ₹ 56.00 |
| Direct materials per unit | ₹ 8.00 | ₹ 12.00 |
| Direct wages per unit | ₹ 4.00 | ₹ 8.00 |
Variable factory overhead is absorbed as a percentage of direct wages. Other variable costs have been computed as:
Product A ₹ 4.00 per unit
Product B ₹ 4.80 per unit.
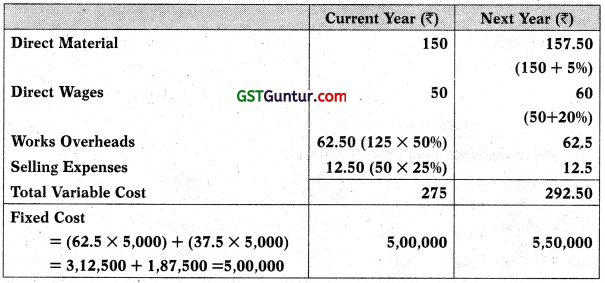
During 2020-21, it is expected that the demand for product A will fail by 25% and for B by 50%. It is decided to manufacture a new product C, the cost for which is estimated as follows:
| Product C | |
| Output (units) | 2,00,000 |
| Selling price per unit | ₹ 28.00 |
| Direct materials per unit | ₹ 6.40 |
| Direct wages per unit | ₹ 4.00 |
It is anticipated that the other variable costs per unit of Product C will be same as for product A.
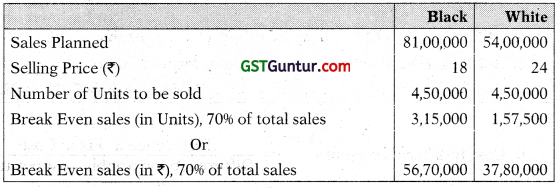
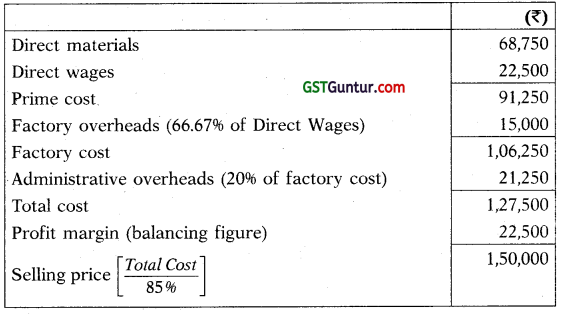
Prepare a budget to present to the management, showing the current position and the position for 2020-21. Comment on the comparative results. [CA In ter RTP Nov 2021]
Answer:
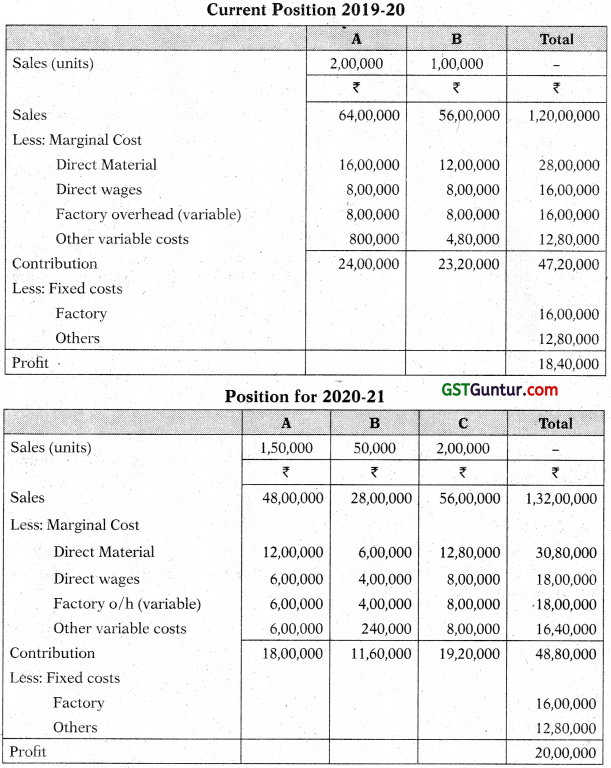
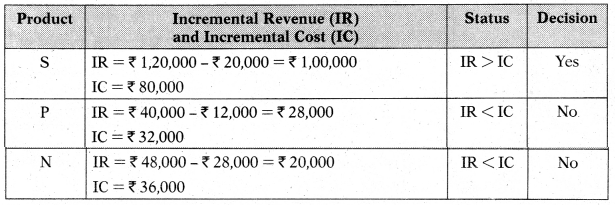
Introduction of Product C is likely to increase profit by ₹ 1,60,000 (₹ 20,00,000 – ₹ 18,40,000) in 2020-21 as compared to 2019-20 even if the demand for Products A & B falls,
Therefore, introduction of product C is recommended.