Performance Measurement and Evaluation – CA Final SCMPE Study Material is designed strictly as per the latest syllabus and exam pattern.
Performance Measurement and Evaluation – CA Final SCMPE Study Material
Question 1.
(RTP: ROI vs RI)
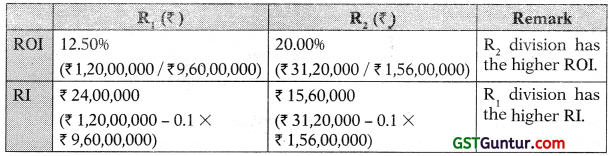
The following data pertain to two divisions. R1 and R2, of a large Shipping Company.
|
R1 (₹) |
R2 (₹) |
| Profit |
1,20,00,000 |
31,20,090 |
| Investment |
9,60.00,000 |
1,56,00,000 |
Required
INTERPRET the conflicting results based on financial performance measure and RI [May 2018 Exam]
Answer:
Residual Income is subject to a size effect but ROI is not. The larger size for the R1 Division (which is more than 6 times that of the R2 Division) overcomes its lower profitability, as measured by ROI. Thus, RI is not a good way to compare divisions that differ greatly on size.
Workings

Question 2.
(ROI Leading to Sub-Optimal Decision Making & Lack of Goal Congruence)
BYD Alloy Ltd. first opened its door in 1990 for business and now it is a major supplier of metals supporting over a dozen different industries and employs experts to support each industry. These include Wood & Panel Products Manufacturing, Hearth Products, Site Furnishings, Commercial and Residential Construction etc. It has grown through devotion to its customers, dedication to customer service and commitment to quality products. The company has two divisions: Division ‘Y’ and Division ‘D’. Each division work as an investment center separately, Salary of each divisional manager is ₹ 7,20,000 per annum with the addition of an annual performance related bonus based on divisional return on investment (ROI). A minimum ROI of 12% p.a. is expected to be achieved by each divisional manager. If a manager only achieves the 12% target, he will not be rewarded a bonus. However, for every whole 1% point above 12% which the division achieves for the year, a bonus equal to 3% of annual salary will be paid subject to a maximum bonus of 20% of annual salary. The figures belonging to the year ended 31 March 2018 are given below:
| Division‘Y’(₹ 000) |
|
Division ‘D’ (₹ 000) |
| Revenue |
29,000 |
17,400 |
Profit
Less: Head Office Cost |
5,290
(2,530) |
3,940
(1,368) |
| Net Profit |
2,760 |
2,572 |
Non-Current Assets
Cash, Inventory, and Trade Receivable
Trade Payable |
19,520
4,960
5,920 |
29,960
6,520
2,800 |
| Manager Responsible |
HAI |
FAI |
During the financial year 2017-18, FAI manager of Division ‘D’ invested ? 13.6 million in new equipment including an advanced cutting machine, which will increase productivity by 10% per annum. HAI, manager of Division ‘Y’, has made no Investment during the year, even its computer system needs updation. Division ‘Y’s manager has already delayed payments of its suppliers due limited cash & bank balance although the cash balance at Division ‘Y’ is still better than that of Division ‘D’.
Required
(i) For each division, COMPUTE, ROI for the year ending 31 March 2018, Justify the figures used in your calculation. (6 Marks)
(ii) COMPUTE bonus of each manager for the year ended 31 March 2018. (4 Marks)
(iii) DISCUSS whether ROI provides justifiable basis for computing the bonuses of managers and the problems arising from its use at BYD for the year ended 31 March 2018. (10 Marks) [Nov. 2018 RTP/Aug 2018 MTP]
Answer:
(i) ROI Division ‘Y’
Controllable Profit = ₹ 5,290K
Net Assets = ₹ 19,520k + ₹ 4,960K – ₹ 5,920K = ₹ 18,560K ROI = 28.5%
Division ‘D’
Controllable profit = ₹ 3,940K
Net Assets = ₹ 29,960K + ₹ 6,520K – ₹ 2,800K = ₹ 33,680K ROI = 11.7%
In computation of ROI of both division, controllable profit has been taken into consideration. The reason behind this is that the Head Office costs are not controllable and responsibility accounting considers that managers should only be held responsible for costs over which they have control. The assets figures being used also depend on the same principal. Figures of current assets and the current liabilities have been y taken into consideration as they are such items over which managers have complete control.
(ii) Bonus
Bonus to be paid for each percentagepoint= ₹ 7,20,000 × 396 = ₹ 21,600
Maximum Bonus = ₹ 7,20,000 × 20% = ₹ 1,44,000
Division ‘Y’
ROI = 28.5% (16 whole percentage points above minimum ROI) 16 × ₹ 21,600 = ₹ 3,45,600
Therefore, manager will be paid the bonus of ₹ 1,44,000 (max.)
Division ‘D’
ROI = 11.796 (Zero, percentage point above minimum)
Therefore Bonus = NIL
(iii) Discussion
FAI will not receive any bonus since he has not earned any point above minimum percentage. This is due to the large asset base on which the ROI figure has been computed. Total assets of Division ‘D’ are almost double the total assets of Division ‘Y’. The major reason behind this is that Division ‘D’ invested ₹ 13.6 million in new equipment during the year. If this investment were not made, net assets would have
been only ₹ 20.08 million and the ROI for Division ‘D’ would have been 19.62% resulting in payment of a bonus ₹ 1,44,000 (7 × ₹ 21,600 = ₹ 1,51,200; subject to maximum of ₹ 1,44,000) rather than the nothing. FAI is being penalized for making decisions which are in the best interests of his division. It is very surprising that he decided to invest where he knew that he would receive lesser bonus subsequently. He acted in the best interests of the BYD altogether. On the other hand, HAI has taken benefit from the fact that he has not invested anything even though it was needed for computer system updation. This is an example of sub-optimal decision making.
Further, Division ‘Y”s trade payables are over double those of Division ‘D’. In part, one would expect this due to higher sales (almost 66% more than Division ‘D’) and low cash levels at Division ‘Y’. Higher trade payable leads to reduce. The manager of division G would be most eager to accept the additional fund of Rs. 8,00,000 because of ROI of the protion in net assets figures. The fact that BYD is rewarding HAI with bonus, even though relationships with suppliers may be badly affected, is again a case of sub-optimal decision making.
If the profit margin (excluding head office cost) as percentage of sales is calculated, it comes to 18.24% for Division ‘Y’ and 22.64% for Division ‘D’. Therefore it can be seen that Division ‘D’ is performing better if < capital employed is ignored. ROI is simply making the division ‘D”s S performance worse.
FAI might feel extremely disappointed by getting nothing and in the future, he may opt to postpone the investment to increase the bonus. Non- investing in new technology and equipment will mean that the BYD will not be kept updated with industry changes and its overall future competitiveness will be affected.
Briefly, the use of ROI is resulting in sub-optimal decision making and a lack of goal congruence ie. what is good for the managers is not good for the company and vice versa. Fortunately, Division ‘D”s manager still seems to be acting for the benefit of the BYD but the other manager is not. The fact that one manager is receiving a much bigger bonus than the other is not justifiable here and may result in conflict in long run. This is disappointing for the company especially in the situation when the divisions need to work in unison.
Question 3.
(ROI & RI)
LMP Limited has three divisions. Its desired rate of return is 14%. The operating assets and income for each division are as follows:
| Divisions |
Operating Assets (Rs.) |
Operating Income (Rs.) |
| L |
19,20,000 |
3,45,600 |
| N |
10,50,000 |
1,73,250 |
| G |
12,30,000 |
1,67,280 |
| Total |
42,00,000 |
6,86,130 |
LMP limited has Rs. 8,00,000 of additional cash to invest in one of its divisions. The divisional managers have identified Investment opportunities that are expected to yield the following ROI is
| Divisions |
Expected ROIs for additional Investment |
| L |
16% |
| N |
12% |
| G |
15% |
Required
(i) CALCULATE ROIs at present for each division and STATE which division manager is currently providing the highest ROI. (3 Marks)
(ii) Based on ROI, IDENTIFY the division manager who would be the most eager to accept the additional Investment funds.
(1 Marks)
(iii) Based on ROI, IDENTIFY the division manager who would be least eager to accept the additional investment funds. (1 Marks)
(iv) STATE the division that offers the best investment opportunity for LMP limited. (1 Mark)
(v) DISCUSS the conflict between requirements (ii) and (iv) above, s (2 Marks)
(vi) ADVISE how the residual income performance measure could be used to motivate the managers to act in the best interest of the company. (2 Marks) [Oct. 2019 MTP]
Answer:
1. Present ROI of each division
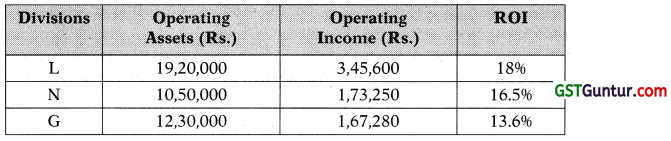
The division manager of L division is currently providing the highest ROI of 18% among the three divisions.
posed investment of Rs. 15% is more than the present ROI of 13.6% and the acceptance of the proposal would increase the division’s ROI.
3. The managers of division L and N, both would be reluctant to invest the additional fund of Rs. 8,00,000 because their return on the proposed project that is 16% and 12% respectively for division L and N are lower than their existing ROI of 18% and 16.5%. However, the manager of division N would be least likely to accept the additional investment because the gap of the present ROI and proposed ROI of the project is 4.5% than that of division L of 2%.
4. Division L offers the best investment opportunity of 16% for LMP limited.
5. The managers are forced to choose between their personal best interests and the best interests of the company as a whole. When faced with decisions such as these, many managers choose to benefit themselves at the expense of their company, a condition described as sub optimisation.
6. To avoid sub-optimisation, the divisional performance measure be based on Residual Income (RI). If RI is used to measure the performance, there is greater probability that managers will be encouraged, when acting in their own best interests, also to act in the best interests of the company. Since, the use of RI does not penalise investment in projects with lower returns than current project returns.
In general, when RI is used as a performance measure, managers are willing to invest in any projects with returns equal to or greater than the required rate of return. However, RI suffers from the disadvantages of being an absolute measure, which means that it is difficult to compare the performance of a division with that of other divisions of a different size.
Question 4.
Non- Financial Performance Measures (NOV 2020 RTP)
Welfare LLP sells wide range of household products. The firm has recently received few negative feedbacks about the product and customer services. CEO is not happy with this. As per the opinion of CEO –
“Nowadays when social media play such an important role in making decisions, itscrucial to keep an eye on the quality of customer service you provide. If you don’t care about customers1 satisfaction, don’t expect them to care about your services or products. When customer share their story, they’re not just sharing their problems. They are actually teaching you how to make your product, service, and business better.”
There has been considerable discussion at the corporate level as to improve ‘Customer Satisfaction’. Convinced with this logic, firm has invested heavily in customer satisfaction and adopted the following plan of action- providing helpline 24/7 in order to develop persona! relationship with customer;
- redesign its online platform in order to make it more customer friendly;
- rewarding loyal customers by giving them experience, they would not forget for life; and
- ease the return and refund policy, offering no questions- asked guarantee is a smart move over competitors.
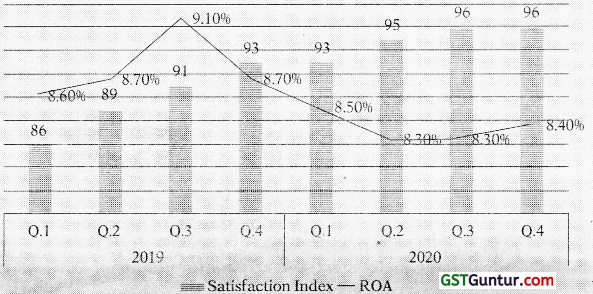
The CEO was initially delighted to see that their efforts pay off in the form of higher customer satisfaction score index, however he is anxious to see the corresponding financial results.
Required
Does the seeming lack of improvement in financial performance with customer satisfaction, Welfare LLP should stop investing a superior customer experience? DISCUSS. [Nov. 2020 RTF]
Answer:
In this case we can see that there are two considerable sides of the question one is customer satisfaction and another one is profitability. By adopting the proposed plans firm manage to get higher customer satisfaction score card and it is expected that with high customer satisfaction, the firm’s financial result will improve ie. increase ROA. However, increasing the customer satisfaction is costly. Plans which are used to increase customer satisfaction will increase the cost of the firm. This additional cost will weaken the firm’s ROA by lowing profit and increasing the asset base. The optimum level of customer satisfaction is where the incremental benefits are equal to incremental costs of increasing satisfaction.
While observing the pattern of data, the customer satisfaction has increased from 86 points to 91 points in first three quarters of 2019. At this level, the additional benefits seem to more significant than the additional cost. However, in subsequent quarters, additional cost has increased more rapidly than the additional benefits. Therefore, there is decrease in ROA as we move forward on the index. However, toward the end of 2020, we see a marginal increase in ROA. This is due to the lead-lag relation between satisfaction and ROA. Increased satisfaction might take some more time, some more quarters to result in higher ROA and the relation might not be linear. However, toward the end of 2020, the customer satisfaction score stabilizes at current levels (93-96 points).
Overall, Kristin should not stop investing in superior customer experience, the lack of apparent pattern in customer satisfaction and profitability could stem from several causes as discussed above. Instead, firm should take decision considering current satisfaction levels, the cost to increased satisfaction, and perception of the increased benefit. Moreover, the firm should also consider the current sales, otherwise it might lose its share to competitor if they do nothing.
Question 5.
(Return on Investment; Residual Income)
AKG Limited has three autonomous divisions. The divisions are evaluated on the basis of ROl, with year end bonuses given to divisional managers who have the highest ROL Operating results of Division II for the last year are given below:
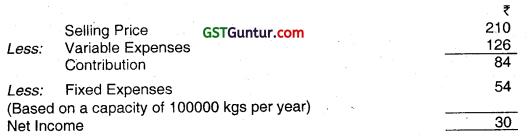
|
₹ |
| Sales |
2,10.00,000 |
| Less: Variable Expenses |
1,26,00,000 |
| Contribution margin |
84,00,000 |
| Less: Fixed Expenses |
67,20,000 |
| Net Operating Income |
16,80,000 |
| Divisional Operating Assets |
52,50,000 |
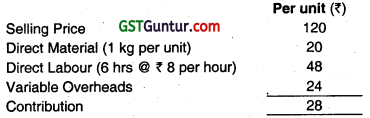
The company’s overall ROI for the last year was 18% (considering all divisions). Division II has an opportunity to add a new product line that would require an investment of ₹ 30,00,000. Other details of the new product line are as follows:
| Sales |
₹ 90,00,000 per annum |
| Variable Expenses |
65% of sales |
| Fixed Expenses |
₹ 25,20,000per annum |
| Life cycle of the product line |
5 years |
In addition to financial performance measures, the company wishes to introduce a variety of non-financial performance measures.
The company has set aggressive targets in both sales growth and ROI for the coming year. The company’s strategy for achieving these goals includes a campaign aimed at building brand recognition, customer retention, improvement in product quality, on time delivery to customers, expansion of eco-friendly product line and introduction of limited edition items.
Required:
(a) (i) CALCULATE last year’s ROI of Division II.
(ii) DISCUSS whether the manager of Division II would accept or reject the new product line, if he takes his decision based solely on divisional ROI. (2 Marks)
(iii) AD VISE how residual income approach can he used as an alternative financial measure for evaluation of managerial performance in the best interest of the company.
(b) Based on the above information and using a Strategy Map TABULATE two objectives and two measures for each perspective across the four dimensions of a balanced scorecard in the following format:
| Perspective |
Strategic Objective |
Measure |
|
|
|
[Nov. 2019]
Answer:
(a) (i) Calculation of last year ROI of Division II
= Controllable Profit/ Controllable Net Asset
= ₹ 16,80,000/1 52,50,000
= 32%
(ii) Calculation of ROI of New Product Line
| Particulars Amount |
(₹) |
| Sales |
90,00,000 |
| Less: Variable Cost |
58,50,000 |
| Controllable Contribution |
31,50,000 |
| Less: Fixed Cost |
25,20,000 |
| Controllable Profit |
6,30,000 |
| Investment Available |
30,00,000 |
| Return on the Proposed Line (ROI) |
21% |
The manager of Division II would be unwilling to invest the additional ₹ 30 lacs because this would decrease the Division II’s ROI of 32% to 28%.
[₹ 16,80,000 + ₹ 6,30,000/ (₹ 52,50,000 + ₹ 30,00,000)]
(iii) Generally, a manager who is evaluated based on ROI will reject any project whose rate of return is below the Division’s current ROI even if the rate of return of the project is above the company’s minimum reqidred rate of return. In contrast, managers who are evaluated using residual income will pursue any project whose rate of return is above the minimum required rate of return, because it will increase their residual income. So, in the best interest of the company as a whole, residual income approach can be used for evaluation of managerial performance.
Alternative
To overcome some of the dysfunctional consequences of ROI, the residual income approach can be used. For the investment decision for Division II, the residual income calculations are as follows:
| Proposed Investment |
₹ 30,00,000 |
| Controllable Profit |
₹ 6,30,000 |
| Cost of Capital (18%) |
₹ 5,40,000 |
| Residual Income (RI) |
90,000 |
Advise
This calculation indicates that the residual income of Division II will increase if manager accept the project. However, it is important to note that Residual Income does not always point to the right decision, because notional interest on accounting capital employed is not the same as IRR on cash investment. This Project has 1.65% IRR.
Overall, Residual Income is more likely than ROI to improve when managers make correct investment decisions, and so is probably a ‘safer’ basis than ROI on which to measure performance.
(b)
| Perspective |
Strategic Objective |
Measure |
| Financial |
- Improve ROI
- Increase Sales
|
- % increase in ROI
- % increase in sales
|
| Customer
Perspective |
- Improve brand recognition
- Customer retention
|
- % of target audience who recognize brand
- % of suggestions/ complaints responded
- % increase in repeat customers/Number of repeat customers
|
| Internal
Perspective |
- Improve in product quality
- Improve on time delivery to customers
- Reduction in time spent in non-value added activities
|
- % reduction in defect rate
- % of orders on time
- % increase in MCE
|
| Learning & Innovation |
- Expansion of ecofriendly product line
- Introduction of limited edition items
|
- No. of eco-friendly products developed.
- No. of limited editions introduced.
|
Other measures are also possible.
Question 6.
(Economic Value Added)
The following information is available for the division X of Xuz Ltd:
| Net operating profit before interest and taxes |
7,500 |
| Depreciation expenses |
2,500 |
| Change in net working capital |
1,250 |
| Capital expenditure |
1,000 |
| Invested capital |
12,500 |
| WACC |
8% |
| Tax Rate |
30% |
Answer:
EVA can be calculated as NOPAT minus the capital charge on invested capital. In this case, NOPAT is equal to net operating profit before interest and taxes ₹ 7,500 minus taxes ₹ 2,250 (₹ 7,500 × 30%), which is equal to ₹ 5,250. EVA is then equal to ₹ 4,250 (₹ 5,250 – ₹ 12,500 × 8%)
Question 7.
(Economic Value Added)
Boat Ltd. provides you with the following financial information as at 31st March 2018.
|
(₹ in lakhs) |
| Share Capital |
981.46 |
| Reserves and Surplus |
1,313.62 |
| Long Term Debt |
144.44 |
| Trade Payables |
20.38 |
Additional information provided is as follows:
(i) Profit before interest and tax is ₹ 2,202.84 lakhs
(ii) interest paid is ₹ 13.48 lakhs.
(iii) Tax rate is 30%
(iv) Cost of equity = 12.42% and cost of debt = 6.53%.
Required
CALCULATE Economic Value Added of Boat Ltd.
Answer:
EVA = NOPAT – WACC × Capital Employed Capital Employed
= ₹ 981.46 L + ₹ 1313.62 L + ₹ 144.44 L
= ₹ 2,439.52 L
WACC = \(\frac{(981.46+1,313.62)}{2,439.52}\) × 12.42% + \(\frac{(144.44)}{2,439.5}\) × 6.53%
= 11.68%+ 0.39%
= 12.07%
NOPAT = [PBIT- Interest – Tax] + Interest (net of tax)
|
₹ in lakhs |
| PBIT |
2,202.84 |
| Less: Interest |
(13.48) |
| PBT |
2,189.36 |
| Less: Tax @ 30% |
(656.81) |
| PAT |
1,532.55 |
| Interest (net of tax) [13.48 × (1- 0.30)] |
9.44 |
| NO PAT |
1,541.99 |
EVA = NOPAT – WACC × Capital Employed
= ₹ 1,541.99 L – 12.07% × ₹ 2,439.52 L
= ₹ 1,247.54 L
Question 8.
(Economic Value Added)
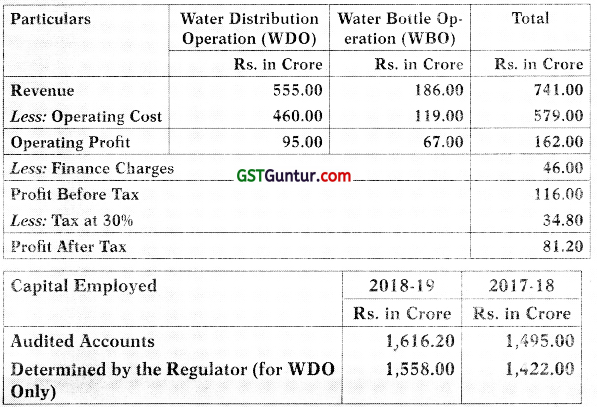
Jal Cleaning and Distribution Services Ltd. (JCDSL) was established with an aim for supply and distribution of water in Nagpur and as well as supply of water to the various local authorities for distribution to villages and other small cities adjacent to Nagpur under “MISSION PAANI”. This involved planning, operating, treating, maintaining, and distributing w ater resources in the country’s urban centres and other areas mandated by State Government. The mission statement is to provide clean and economical water for healthy life to the public”:
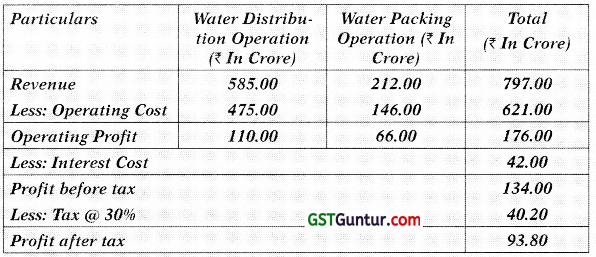
There are two operational divisions of JCDSL viz Water Distribution Operation (WDO) for distribution of water through pipes and Water Packaging Operation (WPO) for supplying water in packaged drinking winter bottles. The state government ensures that JCDSL does not take advantage of its monopoly position in the regional area by increasing prices. The government controls majority of services through its w ater regulatory body which determines an acceptable margin level (ROCE) and ensures that the pricing of JCDSL within these areas does not break this level. The other operation Le. Water Packing Operation (WPO) is not regulated by government and JCDSL is free to charge a market rate for water supply in bottles. The company is free to use water for Water Packaging Operation but the total use of water for Water Packing Operation (WPO) cannot exceed 35% of the total supply of water by the company. The company is presently using 20% of total water supply for packaging operation.
The brand name of packaged drinking water is “Swachh-Jal” which is packed in transparent plastic bottles. The water regulator calculates Return on Capital Employed (ROCE) of JCDSL based on its own valuation and assessment of the capital assets which are used in operation and profit from these services. Acceptable level of ROCE set by the regulator is 6.50%. If JCDSL breach this level, then the company would be heavily penalized. JCDSC board is making sincere efforts to improve the performance of the company for the benefit of the shareholders. The board of directors have decided to consider economic value added (EVA) as the key performance indicator, in order to meet the objective of maximizing shareholders’ wealth.
Key Financial data for the year ending 31st March, 2020 is given below :
Capital Employed for the last two years
| Particulars |
2019-20 (₹ In Crore) |
2018-19 (₹ In Crore) |
| As per Audited Accounts |
2,040.00 |
1,940.00 |
| As calculated by Water Regulator (for WDO operations only) |
1,812.00 |
1,760.00 |
The following notes are to be taken into consideration in the analysis:
1. Operating Costs include:
| Particulars |
2019-20
(₹ In Crore) |
2018-19
(₹ In Crore) |
| Depreciation |
124.00 |
118.00 |
| Provision for bad and doubtful debts |
6.00 |
2.00 |
| R&D Cost |
20.00 |
… |
| Other Non-Cash items |
22.00 |
11.00 |
2. Economic depreciation is ₹ 156.00 Crore in 2019-20. In the FY 2018-1 9, economic and accounting depreciation were assumed t0 be the same.
3. Current year’s tax paid is ₹ 23.00 Crore and deferred tax provisions of ₹ 2.00 Crore have been adjusted. There was no deferred tax balance before 2019-20.
4. The provision for doubtful debts was ₹ 12.00 Crore in the 2019-20 Balance Sheet.
5. Research and development has been non-capitalized. It belongs to a new project that will be developed over six years and is expected to be of long-term benefit to the company. 2019-20 is the first year of this project.
6. Cost of Capital:
| Equity |
15% |
| Debt (Post Tax) |
5% |
7. Gearing of JCDSL Equity:
| Equity |
30% |
| Debt (Post Tax) |
70% |
Required
(i) CALCULATE EVA of JCDSL for the year ending 31 March, 2020 based on the above information. (6 Marks)
(ii) EVALUATE the financial performance of JCDSL using EVA. (4 Marks)
(iii) ASSESS whether JCDSL comply with its acceptable ROCE level. (3 Marks)
(iv) ADVISE how JCDSL can improve its performance in terms of profitability and EVA in future. (7 Marks) [Nov 2020 Exam]
Answer:
(i) EVA of JCDSL for the year ending 31st March 2020 is negative ₹ 0.16 Crores.
Calculation of EVA
NOPAT – (WACC × Capital Employed)
= ₹ 156.40 crores – (8% × ₹ 1,957 crores)
= ₹ 156,40 crores – ₹ 156.56 crores
= – ₹ 0.16 Crores
Working Note 1 – Computation of NOPAT (Net operating profit after tax)
| Particulars |
₹ in Crore |
| Operating Profit |
176.00 |
| Add: |
| Accounting Depreciation |
124.00 |
| Provision for Bad and Doubtful Debts |
6.00 |
| Research and Development |
20.00 |
| Other Non-Cash Items |
22.00 |
| Less: |
| Economic Depreciation |
156.00 |
| Tax Paid |
23.00 |
| Tax Saving on Interest (₹ 42 crores × 30%) |
12.60 |
| NOPAT |
156.40 |
Working Note 2 – Computation of Capital Employed
| Particulars |
₹ in Crore |
| Capital Employed as on 31.03.2019 |
1,940.00 |
| Add: |
|
| Provision for Bad and Doubtful Debts as on 31.03.2019 (i.e. ₹ 12 – ₹ 6 crore) |
6.00 |
| Other Non-Cash Items (incurred in 2018-19) |
11.00 |
| Adjusted Opening Capital Employed |
1,957.00 |
Working Note 3 – Calculation of WACC
[(Ke × Ve) + (Kd × Vd)]/(Ve + Vd)]
= 1596 × 0.30 + 596 × 0.70
= 8%
(ii) Evaluation of Financial Performance
Presently, JCDSL is distorting value (negative EVA of 16 lacs) as it is not able to meet the economic cost of its own capital, hence detrimental to shareholder’s interest. The negative EVA raise the question on sustainability of business, hence perpetual succession become doubtful.
The prominent reason of negative EVA may be a higher cost of equity for JSDSL ie. 1596. Here it is worth noting that despite around 73.40% (585/797) of the revenue to JCDSL is from WDO which is regulated one and wherein demand is guaranteed in future. Hence, investing risk shall be low.
Another major reason of negative EVA may be cap on ROCE in case of WDO hence NOPAT can’t be raised beyond a level. JCDSL can focus
on WPO to increase its NOPAT (to make it enough for break-even) or it can slash its capital employed by selling unutilized or under-utilized assets.
(iii) ROCE of WDO is 6.25% (see working note below), hence JCDSL is complying with the acceptable cap limit of 6.50%.
Working Note – Computation of ROCE from WDO
ROCE = \(\left(\frac{\text { Operating Profit }}{\text { Capital Employed }}\right)\)
= (₹ 110 crores / ₹ 1,760 crores ) × 100
= 6.25%
In order to improve performance in term of EVA or profitability CDSL may apply any of the initiative either individually or in any combination operating profits can be made to grow without employing more capital in both operations, but especially in WDO i.e. greater efficiency; additional capital shall be invested in WPO where the return is more than the cost of obtaining the capital, i.e. profitable growth; capital shall be divested from those projects that do not cover the cost of capital, i.e. liquidate unproductive capital.
(iv) Advise
Operating margin from WPO is 31.13% (66.00/212.00) compared to 18.80% (110.00/585.00) of WDO. JCDSL may use the WDO activities ) as a trusted source of cash profit to reinvest in expansion of the WPO. There is scope of expansion in WPO, because the JCDSL currently using 20% of total water supply for packing operation against the upper cap of 35%. Hence, JCDSL shall expand the WPO (non-regulated businesses) to extent of 175% [(35%/20%) × 100] of current level using the cash generated by the regulated operation i.e. WDO.
Further, JCDSL may improve profitability by controlling costs within WDO activities through performance measurement. The regulatory body cannot argue that the company is overcharging its customers to increase profit margin. This is possible through strict observance of expenses and using cost savings techniques through efficiency improvements. In order to control cost within WDO, targets should be based on minimal variances and adopting cost reduction methods. It is important here to note that there is only a limited scope for increase in the operating profit of WDO due to ROCE cap. The maximum allowed operating profit can be only ₹ 114.4 crore i.e. 6.50% of ₹ 1,760 crore of capital employed.
Thus, JCDSL should go to expand its WPO as this is producing higher operating profit margins.
Question 9.
Alpha Control (AC) is a global leader in manufacturing of commercial building control systems with over 250 distributors and many thousands of installations in more than 50 countries. Control systems involve air conditioning systems, facility management, energy and water management, access control and security controls etc. At AC, manufacturing is done at a number of factory sites where some products are easy and largely produced and have a long life while other products are intricated and have a short life due to changing technologies. AC’s mission statement is to keep you ahead through control systems that improve productivity j and save energy’.
A Newly appointed chief executive officer (CEO) is anxious about declining share price of AC in the last two years. She identified that the business has grown through acquisition and senior management have focused on making corporate deals but not on making control systems. She announced that the AC’s focus must be on optimization and upgradation of its value generation rather than just getting bigger through acquisitions.
Assuming yourself as a performance management expert of AC, the CEO S? has asked you to aid her in her improvement programme. Firstly, she wants your views on the use of EVA as the key performance metric at AC. You are given the current EVA computation (Annexure 1) but there is some suspicion about whether the assistant who has done this work is sufficiently well trained about this method. So, she requires you to examine his accuracy and the assumptions forming part of the calculation.
Required
Write a report to the chief executive officer to EVALUATE the accuracy of the EVA calculation and the assumptions.
Annexure 1
NOPAT
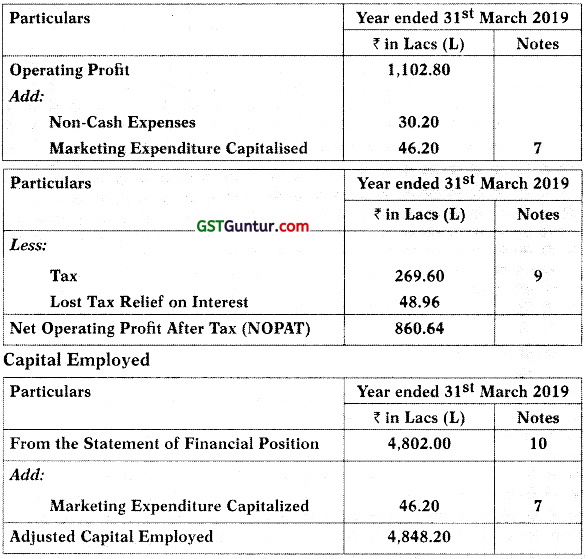
WACC = (1/2 × 15%) + (1/2 × 7.8%) .
= 11.40%
EVA = NOPAT – (WACC × Capital Employed)
= ₹ 860.64 L – ₹ 4,848.20 L × 11.40%
= ₹ 860.64 L – ₹ 552.69 L
= ₹ 307.95 L
Assumptions and Notes
- Debt/Equity 1:1
- Cost of Equity is 15.00%
- Cost of Debt (pre-tax) is 7.80%
- Tax Rate is 30.00%
- Interest charged in the period was ₹ 163.20 L.
- In current fiscal year, AC spend ₹ 80.00 L in Training and Development by leveraging the latest digital technologies including virtual classrooms to deliver highly relevant training to staff at the point of need.
- Marketing Expenditure has been ₹ 46.20 L each year for the last two years to build the long- term brand.
- The total R&D spending was ₹ 20 L during this year for in-depth study of the TCP/IP protocols. The TCP/IP based products have not been launched yet.
- AC has paid Tax of ₹ 260 L while the tax charged per the accounts was ₹ 269.60 L.
- Capital employed during the Period (from the statement of financial position):
| Opening |
4,564.00 L |
| Closing |
4,802.00 L |
[March 2019 MTP] (20 Marks)
Answer:
Report
To: CEO, Alpha Control
From: Performance Management Expert
Date: 31st May 2019
Subject: Evaluation of EVA at Alpha Control
EVA provides a link between decisions, performance measures and rewards, which focuses managers on performing better. Incentive schemes based on EVA provide better quality information and motivation in making decision which in turn maximise shareholder’s wealth. In other words, EVA links the l operating returns to the assets that were used to generate those returns. The learning which flows from EVA analyses can be perceptive and can allow the manager not only to identify areas of weakness in performance but also to easily find solutions. AC is a multiproduct company having number of factory sites. EVA can help to appraise divisional contributors to, or detractors from, overall profitability. Thus, managers may be educated through EVA and pursue such objectives that improve operating profits investing more capital.
In addition, this report deals with evaluation of the accuracy and assumptions used in the calculation of AC’s EVA. There are many errors in the present calculation of EVA. These have been discussed below and revised calculations are enclosed.
- Non-Cash Expenses have been correctly added back to the profit as these are expenses which do not affect the cash flow of a given period.
- Addition back of Marketing Expenditure is also correct as spending contributes to future value-creation. For the same reason, the prior year spending is also added in to capital employed.
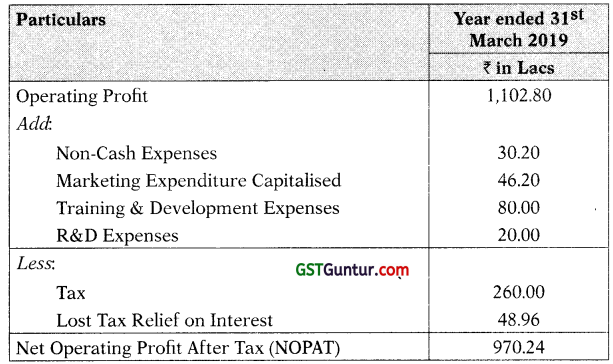
- Training and Development Expenses should be capitalised. Training and Development Expenses have been treated as an expense in the income statement, they should be added back to profit, and added to capital employed (at the end of the year).
- Research and Development (R&D) Expenses should be treated as marketing expenditure for long period.
- The tax expenses in the EVA calculation should be the tax paid with adjustment for lost tax relief on interest and not the adjusted amount of tax charged in the accounts.
- The WACC is incorrect because it should be based on post-tax cost of debt.
- Generally, a company takes, at least, a year’s time to earn a return on investment. Thus, the capital employed figure should be based on the beginning numbers.
NOPAT
Capital Employed
| Particulars |
₹ in Lacs |
| From the Statement of Financial Position (Starting) |
4,564.00 |
| Marketing Expenditure Capitalized |
46.20 |
| Adjusted Capital Employed |
4,610.20 |
WACC = (1/2 × 15%) + (1/2 × 7.8% × 70%)
= 10.2396
EVA = NOPAT – (WACC × Capital Employed)
= ₹ 970.24 L – ₹ 4,610.20 L × 10.23%
= ₹ 498.62 L
The recomputed EVA has increased from ₹ 307.95 Lacs to ₹ 498.62 Lacs | which shows a positive position for AC as it adds up the shareholder’s wealth.
For calculating NOPAT, following most common adjustments to accounting I profit as remarked by the Stern Stewart has been considered.
For Advertising, Research and Development Items expensed, Staff Training
- Impact on Profit: Increase CY’s profit, deduct economic depreciation on PY’s EVA adjustment.
- Impact on Capital Employed: Increase capital employed at the end of the year, increase capital employed in respect of similar add backs of PY’s investments not treated as such in financial statements (net of economic depreciation),
For Depreciation
- Impact on Profit: Add accounting depreciation and subtract economic depreciation.
- Impact on Capital Employed: Alter value of non-current assets (and capital employed) to reflect economic depreciation not accounting depreciation.
For Non- Cash Expenses
- Impact on Profit: Add back to profit.
- Impact on Capital Employed: Add to retained profits at the end of the year.
For tax charge, this will be based on ‘cash taxes’ rather than the accruals based methods used in financial reporting.
Further, the revised calculation of EVA is largely based on the following assumptions:
There is an implicit assumption that accounting depreciation (included in operating profit) is equivalent to economic depreciation (which should be used for EVA calculations). This assumption is doubtful, although there is no information for more accurate calculation.
For Additional Marketing Expenditure, no estimation of economic life (expected period during which an asset remains useful) in building the brand and corresponding economic depreciation has been considered in the above calculation.
No amortisation on the R&D Costs is required to be recognised as the product has not been introduced yet. This is in line with the accounting treatment of such items. There was no Research & Development expenditure in the previous year.
Question 10.
(Economic Value Added)
X Greetings is a Korean company based in Seoul committed to supplying the highest quality stationery, greeting cards, gifts, and children’s products, which are sourced from all over the world. Company also distributes Sunday Paper – Korean made eco-friendly stationery designed and manufactured in Seoul. X’s home currency is the KRW. It is also listed on the KRX for last 20 years and its current share price is KRW 23.25. You are a Management Accountant of the X Greetings and directors have asked you to study X on value-based management which is a different approach to the performance management. The directors have heard about this method considering it a way of focusing on shareholder’s interests and in the present economic scenario, they think it to be useful for the growth of X.
Conventionally earnings per share (EPS) and share price were being used to assess performance. The proposed changes are important and the directors require you to have the implications of the new analysis and also want to convince the major investors for the future benefits.
Financial data for X Greetings
| Particular |
2018-19 |
2017-18 |
|
KRW in million |
KRW in million |
| Profit after interest and tax |
55.55 |
65.38 |
| Interest |
15.60 |
8.00 |
| Opening capital employed |
273.58 |
198.40 |
| Closing capital employed |
329.13 |
273.58 |
|
Debt to Equity |
Debt to Equity |
| Capital structure |
40:60 |
40:60 |
|
% |
% |
| Costs of capital |
|
|
| Equity |
14.20 |
|
| Debt (pre-tax rate) |
8.00 |
6.00 |
| Tax rate |
30 |
30 |
| Stock market information: |
|
|
| Average number of shares in issue |
3.2 million |
3.2 million |
| Particular |
2018-19 |
2017-18 |
| Stock market all-share index |
1,985 |
2,561 |
| Retailing sector index |
1,155 |
1,408 |
| X Greetings (share price) |
KRW 22.50 |
KRW 24.40 |
Required
ASSESS the performance of X Greetings using Economic Value Added and ANALYSE the result relative to those of earnings per share (EPS) and share price. Assumptions, if any, should be clearly stated.
Answer:
The performance of X Greetings has gone down since earnings per share is down by 15.03% (W2) from last year. This indicates the company being not in the favour of investors. However, the share price seems up with a decline of only 7.79% relative to fall in retailing sector of 17.97% and the stock market down by 22.49% (W3). The sector comparison is more material for the performance of X as stock market all-share index (KOSPI) is composed of data from financial, manufacturing and other industries whereas retailing sector comparison is specific. This implies that the market views X as one % of the better prospects within the retailing sector that will encourage the shareholders to continue to hold their shares in the company.
In addition, X Greetings has generated positive EVA for 2018-19 KRW 37.03 m (Wl). EVA of FY 2018-19 has fallen from 2017-18 but still it is remained positive and so the company continues to create value for its shareholders even in the bearish market. It is therefore a good investment option even I in a falling market.
Working Note-1
EVA calculations for the periods given are:
| Particulars |
2018-19 |
2017-18 |
|
KRW in million |
KRW in million |
| Profit after interest and tax |
55.55 |
65.38 |
| Add Back: Interest (net of tax at 30%) |
10.92 |
5.60 |
| Net operating profit after tax (NOPAT) |
66.47 |
70.98 |
| Opening Capital employed |
273.58 |
198.40 |
Assumptions:
There are no non-cash expenses to adjust the profit.
Economic depreciation and Accounting depreciation are equal,
No lease exists for capitalization.
Cost of Capital
WACC2018-19 = 0.60 × 14.20% + 0.40 × 5.6096
= 10.7696
WACC2017-18 = 0.60 × 11.5096 + 0.40 × 4.20%
= 8.5896
EVA = NOPAT – Capital Employed × WACC
EVA2018-19 = 66.47 m – 273.58 m × 10.7696
= KRW 37.03 m
EVA2017-18 = 70.98 m – 198.40 m × 8.5896
= KRW 53.96 m
Working Note- 2
| Particulars |
2018-19 |
2017-18 |
Change |
| EPS |
KRW 17.36 |
KRW 20.43 |
-15.0396 |
Working Note- 3
| Particulars |
2018-19 |
2017-18 |
|
| KOSPI (capitalization-weighted index of all common shares) |
1,985 |
2,561 |
-22.4996 |
| Retailing sector index |
1,155 |
1,408 |
-17.9796 |
| X share price |
KRW 22.50 |
KRW 24.40 |
-7.7996 |
Question 11.
(EVA)
Water Benefit Services (WBS) is a parastatal company established with j an aim for supply and distribution of water in Mumbai as well as supply of water to the various local authorities for distribution to villages and j other small cities adjacent to Mumbai. This involved planning, operating, treating, maintaining, and distributing water resources in the country’s urban centers and other areas mandated by Maharashtra Government. Its mission is “To provide sustainable water in a cost effective and environmentally friendly manner to the economy”.
The government ensures that WBS does not take advantage of its monopoly position in the regional area by increasing prices. The government controls majority of services through its water regulatory body which determines an acceptable margin level (ROCE) and ensures that the pricing of WBS within these areas does not break this level. The remaining work i.e. a water bottle operation (WBO) is not regulated by government and WBS charges a market rate for water supply in bottle. The regulator compute return on capital employed (RGCE) of WBS based on its own valuation of the capita! assets which are used in operation and the profit from those services.
Acceptable level of ROCE set by the regulator is 7.00%. If WBS breach this level, then the company would be penalized. WBS board is trying to improve the performance for the benefit of the shareholders, in order to communicate the objective of maximizing shareholders’ wealth, the directors have decided to consider economic value added (EVA) as the key performance indicator.
Compute EVA of WBS based on the following information for the year ending 31 March 2019:
Notes
1. Operating Costs includes:
| Particular |
2018-19 |
2017-18 |
| Rs. in Crore |
Rs. in Crore |
| Depreciation |
118 |
114 |
| Provision for Doubtful Debts |
4 |
1 |
| Research and Development |
24 |
– |
| Other Non-Cash Items |
14 |
12 |
2. Economic depreciation is Rs.166 Crore in 2018-19. In FY 2017-18, economic and accounting depreciation were assumed to be the same.
3. Current year tax paid is (Rs.I8 crore) and deferred tax provisions of Rs.1.50 crore has been adjusted. There was no deferred tax balance before 2018-19. The provision for doubtful debts was Rs. 9 crore in the 2018-19 balance sheet.
4. Research and development has been non-capitalized. It belongs to a new project that will be developed over five years and is expected to be of long-term benefit to the company. 2018-19 is the first year of this project.
5. Cost of Capital
| Equity |
14% |
| Debt (Pre-Tax) |
6% |
6. Gearing of WBS
Required
(i) EVALUATE the financial performance of WBS using EVA. (10 Marks)
(ii) ASSESS whether WBS comply with its acceptable ROCE level (4 Marks)
(iii) ADVISE on how to improve profitability. (6 Marks) [MAY 2019 RTP]
Answer:
(i) Computation of NOPAT
| Particulars |
Rs. in Crore |
| Operating Profit |
162.00 |
| Add: |
|
| Non-Cash Items |
14.00 |
| Accounting Depreciation |
118.00 |
| Doubtful Debts |
4.00 |
| Research and Development |
24.00 |
| Less: |
|
| Economic Depreciation |
166.00 |
| Tax Paid |
18.00 |
| Tax Saving on Interest (Rs. 46 × 30%) |
13.8 |
| NOPAT |
124.20 |
Computation of Capital Employed
|
Rs. in Crore |
| Capital Employed as on 31.03.2018 |
1,495.00 |
| Add: |
|
| Provision for Doubtful Debt as on 31.03.2018 |
5.00 |
| Other Non-Cash Items (incurred in 2017-18) |
12.00 |
| Adjusted Opening Capital Employed |
1,512.00 |
WACC = 0.45 × 1496 + 0.55 × 6% × (1 – 30%) = 8.61%
EVA = NOPAT – (WACC × Capital Employed) = – 5.98 Crores
Evaluation
Presently, WBS is distorting value as it is not able to meet the economic cost of its own capital. This put the company into the question of perpetual succession and lead the company against shareholder’s interest. The reason could be a higher cost of equity for WBS. The investing risk should be low since 75% of the services that the company renders are important for the economy and demand is guaranteed in future. Optionally, WBS needs to either increase its NOPAT enough for break even on economic value added or slash its capital employed by selling unutilized or under-utilized assets.
(ii) Regulatory ROCE: Target 7.00%
ROCE = (Operating Profit/ Capital Employed) × 100%
= (95/1,422) × 100%
= 6.68 %
The ROCE is within the acceptable ROCE of 7.00%.
(iii) Operating Margins
Water Distribution Operation = 17.12% Water Bottle Operation = 36.02%
Advise
Operating margin from WBO is 36.02% compared to 17.12% (WDO). WBS may use the WDO activities as a trusted source of cash profit to reinvest in expansion of the WBO. Expansion through acquisition of appropriate non-regulated businesses using the cash generated by the regulated activities might be a good decision.
Further, WBS may improve profitability by controlling costs within WDO activities through performance measurement. The regulatory body cannot argue that the company is overcharging its customers to increase profit margin. This is possible through strict observance of expenses and using cost savings techniques through efficiency improvements. In order to control cost within WDO, targets should be based on minimal variances and adopting cost cutting methods.
Overall, in WDO, there is only a limited scope for increase in the operating profit since the maximum operating profit allowed, is Rs. 99.54 crore i.e. 7.00% of Rs. 1,422 crore of capital employed. Thus, WBS should go to expand its WBO as this is producing higher operating profit margins.
Question 12.
TRIPLE BOTTOM LINE (TBL)
HEALTH PROVIDER LTD. is a multi-specialty hospital in a mid-sized town. A 300+ bedded facility offers treatment across all medical disciplines of Cardiac, Oncology (Medical. Surgical and Radiotherapy), Neurosciences. Urology, Nephrology, Kidney Transplant, Aesthetics and Reconstructive Surgery, and other ancillary services. Most of the community members have their livelihood linked with the hospital. Marty of them are directly employed at the hospital as doctors, nursing staff, lab technicians or as oilier support staff. While, others arc indirectly related as suppliers of medical devices or drugs to the hospital, catering or housekeeping contractors etc. for the hospital. Hence, existence of the hospital is vital to the community. Growing aw areness about sustainable business prompted the management to identify areas that can help the hospital operate in a sustainable manner that would be mutually beneficial to the organization as well as the town that depends on it. Therefore, it has identified the initiatives that have been put in place to create a sustainable business. Information captured from various departments are being considered to prepare the Triple Bottom Line (TBL) report that is for the consumption both to internal and external stakeholders.
Required
IDENTIFY, which of the following aspects need to be reported in the TBL report and under which of the three categories. Provide reasons for classifying the aspect under a specific category, if applicable.
(i) Medical staff conduct charity camps every month. Open to all members of the community, who are provided with consultation free of charge.
(ii) Prompt and accurate tax payments based on records maintained without errors or fraud.
(iii) Health provider, with the help of traffic police, has implemented a “green corridor” for ambulances that cany donor organs for trans-plantation. Organs harvested from the donor at one hospital can reach another hospital with the recipient patient at the earliest.
(iv) Medical waste is discarded at a landfill in a nearby dumpsite. Some of the waste are not bio-degradable.
(v) During review of the supplier for housekeeping service, it was observed that the service provider resorted to child labour to keep cost of operations lower.
(vi) Training and professional development programs doctors and nurses.
(vii) Lab reports are being made available online within the hospital computer system. This would reduce printing costs and storage space needed to maintain older records.
(viii) Health piovider has a good track record of having no medical negligence litigation cases filed against it.
(ix) The hospital is planning to market medical check-up packages so that facilities in its out- patient department can be utilized better.
(x) The number of inpatient hospital deaths decreased 8%, from 776 in 2016 to 715 in 2017. Assume all aspects are material enough to be reported in the TBL report.
Answer:
Aspects that need to be reported in the TBL report:
| Aspect |
Category on the TBL Report |
| (i) Medical staff conduct charity camps every month. Open to all members of the community, who are provided with consultation free of charge. |
Social bottom line, as it benefits the local community. |
| (ii) Prompt and accurate tax payments based on records maintained without errors or fraud. |
Economic bottom line, since tax payments impact an organization’s bottom line and money flow. |
| (iii) Health provider, with the help of traffic police, has impiemented a “green corridor” for ambulances that carry donor organs for transplantation. Organs harvested from the donor at one hospital can reach another hospital with the recipient patient at the earliest. |
Social bottom line, since green corridor would unable the ambulance to transport harvested organs between the hospitals at the earliest this would be beneficial for patients in need of critical care. |
| (iv) Medical waste is discarded at a landfill in a nearby dumpsite. Some of the waste are not bio-degradable. |
Environmental bottom line, as it
affects the ecological surroundings of the town. |
| (v) During review of the supplier for housekeeping service, it was observed that the service provider resorted to child labour to keep cost of operations lower. |
Social bottom line, since employing child labour leads to exploitation of children within the community. |
| (v) Training and professional development programs doctors and nurses. |
Social bottom line, since it contributes towards employee development. |
| (vi) Lab reports are being made available online within the hospital computer system. This would reduce printing costs and storage space needed to maintain older records. |
Environmental bottom line, since paper, cartridge and storage requirement would be lower. This preserves environmental resources. |
| (viii) Health provider has a good track record of having no medical negligence litigation cases filed against it. |
Social bottom line, since this is an indicator of the quality of services provided to patients. |
| (ix) The hospital is planning to market ‘medical check-up packages’ so that facilities in its outpatient department can be utilized better. |
Not relevant to TBL report. This is a marketing strategy to improve profitability. |
| (x) The number of inpatient hospital deaths decreased 8%, from 776 in 2016 to 715 in 2017. |
Social bottom line, since hospital mortality rate measures the clinical quality. |
Question 13.
(Case Study : Triple Bottom Line)
TEK Ltd. is a paper mill producing excellent quality writing and printing paper. It is located in a small town where eucalyptus, acacia and casuarina trees grow in plenty, which are required in the paper production process. It sources its raw material from pulp-wood plantations that grow the abovementioned trees. These plantations are located in degraded agrarian Sand surrounding the factory site, which was previously waste-land. Their owners are subsistence farmers, who have been encouraged to grow these trees to source raw’ material for the paper mill. The mill’s local procurement policy has thus provided a source of livelihood for this community. Moreover, almost 40% of the staff working at the mill are from the local community. Most of the mill’s labour force lives in residential areas near the factory site. Catering to the mill employees’ livelihood needs like food, clothing, education etc. has given the town alternate sources of income and thus has benefited the town. The plant managers at the mill have been working on various projects in order to build a sustainable business. This includes, reducing waste during the manufacturing process, imparting knowledge to local farmers at the pulp-wood plantations to improve the quality of wood through breeding and seed improvement techniques. Operations at the mill have yielded substantial profits over the last 15 years since inception.
You are the chief accounting officer of TEK taking care of all the reporting (internal and external) needs of the company. Recently, you read about the Triple Bottom Line (TBL) reporting that many other companies are following. You feel the need to introduce TBL reporting because:
The vital role played by the mill towards the development of the town. This can be highlighted in the TBL report. This will enhance the company’s goodwill. At the same time, you feel the need for transparency of operations and balancing the need of various stakeholders involved. All this can be addressed by publishing the TBL report periodically.
The mill’s operations are driven by the resources available in the environmeet. What the mill takes should be returned in equal if not in a higher measure. TBL reporting can help identify opportunities of giving back to the environment.
You have an appointment with the Chief Executive Officer to discuss this reporting framework. During a preliminary discussion, the CEO was sceptical of the need for additional reporting. “We are here to do business, profit should be the sole parameter for measuring our success. Shareholders are our only stakeholders. Annual reports would provide sufficient information to others who are interested in our operations. ”
Required
To convince the CEO, you need bring out the differences traditional accounting framework and the triple bottom line framework. Draft an e-mail on this subject that you need to send to the CEO for discussion at the meeting.
[April 2019 MTP] (20 Marks)
Answer:
To: CEO
From: Chief Accounting Officer
Date: 02/03/20XX
Subject: Traditional Accounting Framework vs. Triple Bottom Line
Framework Please find below comprehensive study on both frameworks in context of the TEK.
Best Regards,
Chief Accounting Officer
………………………………………. Attachment ………………………………………
Difference between traditional accounting framework and triple bottom line framework.
(i) Traditional accounting framework has a “single bottom line” that focuses on the profit that our company has made during the financial year. This is calculated by reducing costs, including the cost of capital, from revenues earned during the period, to arrive at the net profit that is available to the shareholders. This reporting framework has its focus on meeting the informational needs of mainly one category of stakeholder within the company, namely its shareholders. It satisfies the information needs of those interested in the financial aspects of business. It does not provide much insight on the social, environmental and economic implications of its operations.
Albeit, some information about its operations is available in various parts of its annual report, like the management discussion and analysis section or the chairman’s letter to shareholders. However, this is generally not sufficient to satisfy the information needs of other stakeholders, some of whom can be our company’s employees, customers, suppliers, communities living near our factory site or even the government. Transactions that do not directly impact our company are ignored. Recognition of an expense partly depends on utilization of assets. For example, costs incurred to operate machines used in the pulping process would include labour expense, repairs, depreciation, utility etc. These get captured as part of cost of goods manufactured in our financial reports. Therefore, assets and their related expense, that are owned and within the control of the company will be reported in the financial reports.
However, certain assets are neither owned nor controlled by the organization, yet it utilizes these resources in its operations. For example, the waste water from our company is discharged in the river nearby.
The waste water contains solids, chemicals and metal compounds that were used during production. This pollutes the river water, which is the primary source of water for our town. This poses both an environmental and health risk to the citizens. Although we have taken sustainability initiatives to reduce this waste, we do not pay to clean up the river water. It is the government that undertakes the onerous task of cleaning up the river water and also bears the clean-up cost. This aspect of our company’s operations and the associated cost will not get captured in our financial reports. Hence, the true cost of operations of our company is greater than the costs reported in the financial reports. Moreover, the market price that we charge our customer for our paper product does not factor this cost. Consequently, both our company and our customers who use our product end up under-pricing the cost to the environment and society.
It can be concluded that under traditional financial reporting, sustainability and our company’s performance are mutually exclusive. At the same time, information about sustainability is extremely important to other stakeholders like the community living next to the factory site since it affects their lifestyle, the local government that may be incurring substantial expense to nurture back the environment or environmentalists that seek to protect the habitat of other species. It might be critical for our company. Healthy environment and society are key drivers to sustain our operations. “Can we do business in a world fraught with sickness due to pollution?”
On the other hand, triple bottom line reporting framework focuses on a more broader view of the company addressing the interests of various other stakeholders. These stakeholders could our company’s employees, creditors, customers, communities near the factory site, government etc. The objective is to force ourselves to identify areas within our operations to create sustainable initiatives that would, in the long run, be beneficial to its current and future stakeholders as well as to our company itself. It focuses on the impact of the decisions and operations of our company on the society, environment, and economy. Known as 3Ps, people, planet and profit, hence the name “triple bottom line”. Triple bottom line goes beyond the financial aspects of an organization’s performance. This helps stakeholders make more informed assessments of the opportunities and risks that the company faces.
(ii) Traditional accounting framework uses the reporting currency as the unit of measurement. It follows the accounting and reporting principles generally accepted in the country it operates.
Materiality under this framework, is measured in monetary terms, that could impact the decisions of a rational investor. On the other hand, there is no uniform standard or measure for the TBL framework. Measurement of an aspect, therefore its materiality, could either be financial or non-financial. Organizations could follow the metrics suggested in the Global Reporting Initiative (GRI) framework. In India, efforts are underway to align the GRI with the Business Responsibility Report (BRR) mandated by SEBI for some of the public companies, The TBL report focuses on both the positive and negative impact of the organization’s performance on the society, environment and economy. TBL reporting may be (i) core reporting, report selective metrics or (ii) comprehensive reporting, a detailed report based on the GRI standards.
In summary, while financial reports provide information about the profitability of our company, TBL enhances the information available to various stakeholders who may hold different perspectives of the company’s business operations. TBL will work well to supplement | information in the financial statements.
Overall business strategy should be linked to the TBL reporting to work towards a sustainable future. Our company has already been working sustainability initiatives. Waste generation is being tackled by our plant managers. Metrics for this report has to come from various departments. Awareness about sustainability and its impact may open up opportunities that are currently being overlooked. Our company has been a lifeline for this town for the past 15 years. Why not use the TBL to highlight these positive aspects and garner goodwill for our company? TBL reporting need not remain another administrative task requiring just data gathering. It might vitalize our company to achieve greater heights of success.
Question 14.
(Triple Bottom Line)
The triple bottom line recognizes that a company’s performance should not only be viewed in terms of its ability to generate economic profits for its owners, but also by its impact on people and the planet for its long term economic and social viability. LMN Limited has recently undertaken initiatives towards sustainability as below :
(i) Reduced the amount of plastic usage in the peanut butter jars.
(ii) Provided financial support to hospital run by local authority in the vicinity of the factory.
(iii) Constructed solar powered warehouse.
(iv) Generate profit for the company’s shareholders.
(v) Started child care unit for the benefit of women employees as well as for the neighbourhood community.
Required
IDENTIFY whether this initiative would primarily impact people, planet or profit [Nov 2019 Exam] (5 Marks)
Answer:
Triple Bottom Line
Identification of initiatives undertaken by LMN Ltd. into categories it would impact based on the Triple Bottom Line Model – People, Planet or Profit.
| Reduced the amount of plastic usage in peanut butter jars. |
Planet |
| Provided financial support to hospital run by local authority in the vicinity of the factory |
People |
| Constructed solar powered warehouse |
Planet |
| Generated profit for the company’s shareholders |
Profit |
| Started child care unit for the benefit of women employees as well as for the neighbouring community |
People |
Examiner Comment: This question was related to triple bottom line. Most of the examinees scored full marks.
Question 15.
Case Scenario (Triple Bottom Line Approach)
Fashion industry prospered more than any other industry and it kepi blooming with new trends being brought weekly and almost all being sold in no time. The NextGen clothing (NGC) into the fashion industry, situated in the outskirts of Deshipur, had several textile plants, nurturing the needs of the community. NGC had a good base of labourers and farmers, few of them aged under 14, from nearby locations enrolled into the program. They had no source of employment past the cloting plants. It gave boost to their living avenues with receptivity to all modern facilities of living. They worked overtime to get NGC to where it wanted to be.
The raw materials did not cost much toNGC, given the local availability and the cheap quality. The low financial cost and the low sale price it offered to its customers allowed it to churn out cotton and viscose fabricated clothes in humungous quantities. The citizens loved the articrafts brought out by the designers and the cotton material pleased them.
NGC had no history of reporting sustainable efforts to build up a strong environment to work in. It reported phenomenally huge profits in past three years, paid out impressive dividends to its shareholders, bonuses and lucrative overtime pays to its labourers. All were happy and no one complained about the sustainability aspect, the duty it owes to its surroundings and the greater environment.
The community focused on the form rather than the substance of it. It ‘ kept overlooking the brutal effects of producing cotton and viscose in local farms which was the primary source of raw material for NGC. s One day NGC learnt that a scholar born and brought up in Deshipur, studied in Northern America, returned to his hometown. He presented brain storming sessions to the civilized people which made them rethink on their clothing habits. His sessions were summarized below:
Cotton
First of all, the production of cotton involves enormous water usage, which is already a scarce resource globally. Just to manufacture cotton enough to make a t-shirt, involves using liters of water. Above that fertilizers and pesticides employed takes a toll on farmers health. They become ill often than not. Not just the cotton producing process is environmentally non tenable, it involved tons of water for spinning the cotton and dying the fabric to make the cloth. The chemical composed @ water then flows to the nearby rivers and hampers the life of water beings and people around.
Viscose
This is a semi synthetic matter derived directly from wood pulp and converted into cloth by application of chemicals and water. Most of the deforestation can be ascribed to the paper production and rayon production. The greedy merchants overlook even the protected areas to get the required pulp. The sprouting air pollution and water pollution has left community residents forsaken to cry over their fate. The use I of harmful chemicals leads to diseases like cancer and heart strokes.
We, the Customers
The ridiculously low prices of the clothes with the advent of the internet have created a desperate demand of clothes and have led to surge in its buying frequency. Hardly few of us contemplate on how a t-shirt or jeans ; we are wearing was made, what processes they had to undergo before it took that shape and the extent of loss and injury it caused persistently, ;
In a nutshell, his sessions were about the ideas hinting at the destructive impacts on environment thatNGC is bringing to their plate. They gave a patient listening to all his talks, welt fabricated in their native language, free from any fictions.
The training sessions of the scholar, Raghupicked up many ears, it was all over the country and NGC started to perceive this as the verge of its downfall. NGC had to give a rethinking on the way clothes were made.
Required
RECOMMEND ways to bring a turnaround in the reporting framework and go extra miles to do something “sustainable” for the environment
Answer:
Sustainability is a wider phenomenon in itself and cannot be narrowed to just the environment and its people. Ensuring sustainability in a profound context means not just to make the present secure but also considering the needs of the future for the resources. This can be done when there is well blend of demand and supply of such resources.
As per the triple bottom line approach, in the context of fashion, sustainability is interpreted as using environmentally ethical means of producing wearables like clothes, footwears, and other apparels. This approach considers the challenges that a production process brings to the people and the planet even if of less intensity to the firm itself, in the short run. The triple bottom line counts in the advantage of the greater stakeholders rather than the traditional shareholders as noted down from a traditional reporting policy.
Therefore, a sustainable fashion is an undertaking to consider the implications of triple bottom line pillars i.e., environment or planet, the people, and the profitability of the firm) when producing consumables. This holistic approach looks beyond just the term fashion and does what is to be done to put in place an ecological balance.
Once we understand the term sustainability, we now catalog some of the sustainable efforts that are recommended in the situation of NGC and they are:
Producing quality materials
Now a days firms are resorting to producing cheap materials that cost them less to produce and sell. Bearing the come and go fashion in mind, their produces have less longevity and are more representative of use and throw stuffs. Given the environmental boost, NGC should use materials that guarantee longer lasting textiles, thoughtfully designed and priced. This will plunge the need to buy the clothes so often and will enhance the clothing experience of the masses. The highly priced material will lower the demand and keep at bay its accessibility to all. From a short-term perspective, this may sound a financial hit which in the long term will prove a reputational boost to the firm, given the drastic change in quality it adapts to.
Spreading awareness among the customers
Though many expectations are just around the firms engaged in textile production and sale thereof, the customers are no less responsible in turning down the clothes and discarding them in less environmentally amicable manner. They do not discard the clothes in the right time and at right place, rendering the clothes unsuitable for reuse. The thrift stores and donation center are propelled to throw such unfit clothes. As per reports, only established donation centers or processing centers are able to sell overwhelming quantities of secondhand clothing and footwears. So, there is a strong relation between the conscious buying choice of the customers and the sustainability in the fashion industry. With less numbers of purchases of good quality pieces, they can support sustainability.
Using organic materials and addressing safety issues
Triple bottom line suggests that reducing financial expense at the cost of health of its people can cost unimaginative money to the firm in the long run. A firm cannot be seen in isolation to its people who work for its interest and the local residents that live around. As indicated from the facts above, we are aware that producing cotton and viscose involved usage of enormous pesticides and fertilizers that ultimately impaired the health of the farmers and other people involved. They end up having life threatening diseases like cancer and heart strokes. Organic material does not necessarily eliminate the application of pesticides and other toxic materials; however, it will reduce its usage to an acceptably low level. Though restoring to organic materials would not lead to reversal of harmful effects that occur once the cotton is harvested, it will present considerable relief to the health of its people. The adversity occurring by way of colossal use of water to produce organic cotton as compared to the ordinary cotton has to be kept in mind though. This aspect will risk the sustainability of the water for the future generation, an already scarce resource for the present as well.
Moreover, selling the produce for cheap prices, will mean an adjustment to the wages of the labourers and farmers they receive for their hard work. Historically we have seen that firms with an attempt to practice price competition, try to cut down their production cost by compromising the quality of machines they use, providing below standard working environment to their workers, undue firing of skilled people. All of these presents an ongoing challenge to the wellbeing of those people such that they are forced to eke out their living.
Channelizing efforts towards recycling
NGC can introduce in novative recycling channels to ensure that customers are enticed to turn over the used clothes rather than throwing them away, Having a recycling collector at its store with a catchy slogan like 20% discount on fresh stocks for the used clothes, can help. This effort directs people to resort to reusing their old stuffs so that the landfill pressure reduces thereby reducing the emission of carbon gases in the environment. Few firms collect their own products, and after working on them, are sold below normal prices.
Alternatively, NGC can seek the services of third party that can help them buying secondhand clothes and sorting those based on their quality and resale the ones suitable for use and get others to the recycling process, Such unsold clothes left over can be used as raw materials by carpet manufacturers or other textile manufacturers.
Compliance to local labour laws
The true cost of any firm is not just the perceivable financial cost that is reported in its annual publications, it also comprises of the non-financial costuot counted in the context of financial reports. As mentioned above, the low quality of machines can cause myriad accidents at NGC’s plant thereby putting it into legal liabilities which is although a financial cost for the firm but will prove to be reputational risk in the long run, a non-financial cost.
Ethical manufacturing also means complying by the local laws of the country pertaining to usage of labour. We see that NGC are pulling in children of age below 14 years to get their job done. Rather than defending the rights of its workers, it puts an imminent risk to the local kids. It is against the local labour laws to hire child labour and provoke them to work when it is their right to receive educational and nutritional support at this age.
Producing Poly clothes
We see the most expensive sportswear made out of recycled polyester materials, which comes as no surprise. Thanks to the ethically aware multinational firms. It is suggested that NGC should direct its effort in reducing the negativity of plastic remnants brought into the cycle. The plastic materials like ketchup bottles, pickle and oil containers are processed to a liquid consistency which is then turned into reusable fabrics. The demand for cotton clothes is surging globally and polyester made clothes appears to bring a switch over. Poly clothes have less ecological impacts compared to cotton and are easily recyclable; and consume less water.
Reducing the usage of water consumption
As evidenced from the facts, each cloth made to wear consumes liters of water. This usage of water can be controlled by manufacturing as per the just in time approach rather than churning out humungous quantities. This will allow controlled production of raw material on need basis and in turn the limited manufacture of the clothes. NGC can adapt the policy of taking customized order made to manufacture what is ordered for. This will also ensure limited flow of hazardous chemically composed water to the nearby rivers, thus managing the risk of commoners’ lives.
Overall
Considering the above approaches, it is perceived that NGC can bring a significant positivity to its environment. Being a socially responsible part of i the community, it owes a duty to its surrounding and not just to its capital\providers. Hence it is also recommended that it should hire an expert who can assist it in presentation and preparation of sustainability report (or reporting as per the triple bottom line framework). This report satisfies the informational needs of the larger stakeholders i.e., the government, regulatory authorities, employees, local residents and community, and the j customers and suppliers.
Once NGC implements some of the suggested sustainable approach to manufacturing clothes, those policies and efforts can be reported in the triple bottom line framework reporting. This will provide a reputational advantage and also a competitive edge over its competitors in the industry which will bring in financial gains.
Question 16.
(Balance Scorecard)
Excell Telecom Ltd. is a leading cellular service provider having a global presence. It aims to be the most innovative and trusted telecom company in the world. To achieve this aim, it is constantly working on its overall functioning. It is trying to adopt best managements practices in the world. Following are some information related to the company’s performance for a particular period:
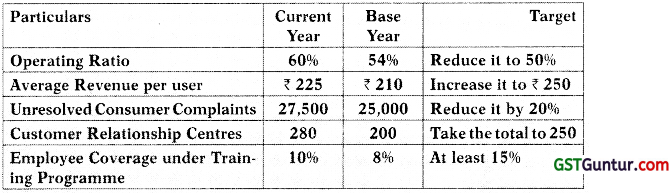
Required
ANALYSE the performance of the company using Balance Scorecard approach.
Answer:
The balanced scorecard is a method which displays organisation’s performance into four dimensions namely hnancial, customer, internal and innovation. The four dimensions acknowledge the interest of shareholders, Customers and employees taking into account of both long-term and short – term goals. The detailed analysis of performance of the company using Balance Scorecard approach as follows:
(i) Financial Perspective: Operating ratio and average revenue will be covered in this prospective.
Company is unable to achieve its target of reducing operating ratio to 50% instead it has increased to 60%. Company is required to take appropriate steps to control and manage its operating expenses. Average revenue per user has increased from ₹ 210 to ₹ 225 but remains short of targeted ₹ 250. This is also one of the reasons of swelled operating ratio. Company can boost up its average revenue per user either by increasing the price of its services or by providing more paid value added services.
(ii) Customer Perspective: Service complaints will be covered under this perspective. The company had set a target of reducing unresolved complaints by 20% instead unresolved complaints have risen by 10% [(27,500-25,000)/(2,500) × 100]. It shows dissatisfaction is increasing among the consumers which would adversely impact the consumer’s general perception about the company and company may lose its consumers in long run. .
(iii) Internal Business Perspective: Establishing customer relationship centres will be covered under this perspective. Company has established 80 relationship centres in the current period exceeding its target of 50 (250-200) to cater to the needs of existing consumers as well as soliciting new consumers. This shows the seriousness of the company towards the consumer satisfaction and would help them in the long run.
(iv) Learning and Growth Perspective: Employee training programmes are covered under this Perspective. Company had set a target to cover at last 15% employee under its training programmes but covered only 10%. This could hurt capabilities of the employees which are needed for long term growth of the organisation necessary to achieve the objectives set in the previous three perspectives. People or the human resource of the company is one of the three principle sources where organisational learning and growth comes.
Question 17.
Case Study (Balance Scorecard)
History
In 2009, Luxo had monopoly in the eyewear market of America, but the problem with the company was that it was selling variety of eyewear, by putting a big price on it. At present, there is almost nothing that you can’t buy online, but at that time there were limited things that you could order online. In 2009, Arby Signer Inc. launched a website to sell eyeglasses online. Selling eyewear online and competing with Luxo was a challenge for Arby. Within just 4 years Arby break the monopoly of Luxo and capure the major market of America. People Find it really convenient to buy sunglasses and glasses online and get delivery at doorstep. Following the footstep of Luxo, Arby eliminated the middle man from the manufacturing process, launched its own optical lab to have its own manufacturing process. The range of products/services offered by Arby which make them 5 different from Luxo include easy buying process, delivery at door step, stylish glasses, customize eyewear glasses, products was sold on the site at very affordable, with a starting range of just $95 etc.
Mission, Vision & Objectives
| Mission |
“Improving people’s lives with our health care products in a socially cognizant way” |
| Vision |
“To be a trusted health care partner” |
| Objective |
“To offer people designer eyewear at a revolutionary price” |
As a mission-based brand, Arby needed a way to instill their team of employees with a passion for the mission. Arby let their employee know what they value and what the employee should value in who they are.
This is important to setting up what they do and why they do it as a core foundation of their brand story. Arby also contributes in the philanthropic work, it inspires the people with its mission. For every pair of glasses customer pay, Arby donates a pair of glasses to needy person. In December 2019, Arby reported the donation of 9,60,000 pairs of eyeglasses. The company also claims to be 90% carbon neutral.
Extracts from the Balanced Scorecard
| Performance Measure |
2019
Actual |
2019
Target |
| Financial perspective |
|
|
| Return on capital employed (ROCE) |
13% |
14% |
| Net income |
$ 95 Millions |
$ 89 Millions |
| Customer perspective Number of first-time buyers |
1,20,000 |
1,00,000 |
| Customer retention ratio |
78% |
75% |
| Number of complaints (per 1,000 customers) |
1.5 |
2 |
| Number of glasses donated to needy people Internal processes |
9,60,000 |
9,00,000 |
| Number of business processes re-engineered |
110 |
100 |
| Number of new services made available through online application |
2 |
4 |
Incidences of fraud on customers’ accounts
(per 1,000 customers) |
3 |
10 |
| Total C02 emissions (tons) |
850 |
1,100 |
| Learning and growth |
|
|
| Number of employees trained to instruct retailers |
1,000 |
1,050 |
| Number of hours (paid for) used to support social plans |
10,200 |
10,000 |
| Number of trainee positions from rural areas |
189 |
200 |
Other Information
Arby Signer has recently invested heavily in IT security to prevent fraud.
Required
EXAMINE the performance of The Arby Signer in 2019. [MAY 2020 RTP]
Answer:
The balanced scorecard approach looks both financial performance and non-financial performance. In order to gain competitive advantage, organizations have to be conscious of the needs and convenience of their customers. The Arby Signer has a vision and strategy which goes far beyond just making money. They want to help the community and give something back to customers also. Hence, performance measures which address whether the Arby is being successful in pursuing their vision has been incorporated in Balanced Scorecard. The performance of the Arby will be considered under each of the titles used in the balanced scorecard:
Financial Perspective
The Arby has had a year of diverse achievements when looking at the extent to which it has met its financial targets. Its ROCE shows how efficiently it has used its assets to generate profit for the business. The target of ROCE 1 for the year was 14% but it has only achieved 13% return. The Arby’s Net Income, however, was in fact $6 million higher than its target, which is good. The most likely reason for the under target ROCE is possibly the investment which Arby has made in IT security. Whilst this may have reduced ROCE, this investment is essentially a good idea as it helps Arby to pursue its mission and will keep customers happy.
Customer Perspective
Regarding its customers, Arby’s performance is better in the current year, It has not just exceeded its target sale to first time buyers by 20,000 but also improved its customer retention ratio, which is good for company to pursue its vision of being a trusted healthcare partner.
Customers complaints has reduced from 2 complaints to 1.5 complaints for every 1,000 customers, the exact reason is not clear but it might be because § of improved processes and team efforts of employees.
Also, the number of glasses donated exceeded the target. It shows that company has exceeded its target of helping people which is good for the company’s reputation.
Internal Processes
Number of business processes within Arby re-engineered has exceeded the target, which is very good and the impact of which may be reflected in the lowering of level of customer complaints. Likewise, the investment to improve IT security has been a great success, with only three incidences of fraud per 1,000 customers reported compared to the target of 10. However, only two new services have been made available via online application, instead of the target of four, which is unsatisfactory. But fortunately, its CO2 emission is below to their target level.
Learning and Growth
The Arby has succeeded to train its employee to instruct retailers. However, the number of employees trained to instruct retailers are comparatively lesser than targeted, shortfall in training of employees to give instruction to retailers may have an impact on the Arby’s failure to meet its target of market expansion. j
Number of hours (paid for) used to support social plans are comparatively higher, it results in additional costs which could have contributed to the fact that the Arby did not quite meet its target for ROCE. The company has not met aim for helping the rural area as targeted. This may be because the number of candidates applying from these areas was not as high as planned and this situation is beyond companies control.
In general, the Arby Signer had a successful year, meeting many of its targets.
Question 18.
Case Study
Spicy is one of the top Engineering coaching institute, it operates a chain of 157 centres across the country of Mayaland. Spicy is equipped with the team of top most faculties for preparation of JEE who are known for giving best results year after year. Students willing to join Spicy have to appear for admission test/(s). These tests help the students in understanding their potential and also provide them with the opportunity for scholarships that help them rewards academically and monetarily. In addition, Spicy provides comfortable class rooms, libraries, and ambience for overall development of student. Spicy delivers quality coaching for JEE by providing innovative ways and therefore prepare students for. all challenges. Spicy prides itself on their results and level of educational service it offers to its students.
It has previously been successful in attracting students across the nation. However, in recent years, the number of enrolment of students has started to decline as a result of introduction of online platform. Several recent surveys have painted a disappointing picture for market conditions in 2020. A survey by the “My Education Outlook” over the month to 31st December found that only one in five respondents believes their business will be better off in 2020 compared with 2019.
Spicy has a policy to set the standard fees based on jhe location of coaching centre. It also takes into account fees charged by the competitors. However, the institute’s managers have the right to offer discount to underprivileged students or scholarship to merit students, and to reduce fees structure when student hiring ratio (SHR) in their class rooms are expected to be low. The average standard fees per student, across all the centers of institute, was M$ 15,000 in 2019, compared to M$ 12,000 in 2018.
Spicy also generates revenue from the additional services available to students, such as selling books, providing test series etc. The series of periodic tests are identical to the pattern of various competitive engineering examinations and give sufficient practice to the aspirants for the same. Every test attempted by the students gives them a clear idea of their understanding of the concept, timeliness, strengths, weaknesses, and ranking amongst the aspirants from across Mayaland.
Summary from Spicy Management Accountants
|
Year ended 31 Dec. 2019
M$’000 |
Year ended 31 Dec. 2018
M$’000 |
| Gross Fees |
1,11,980 |
1,05,977 |
| Less: Fees Discount/Scholarship |
(18,783) |
(13,900) |
| Net Fees |
93,197 |
92,077 |
| Add: Other Revenue (selling books, tests etc.) |
27,250 |
25,895 |
| Total Revenue |
1,20,447 |
1,17,972 |
| Less: Operating Costs |
(97,685) |
(93,758) |
| Operating Profit |
22,762 |
24,214 |
Other Performance Information
|
Year ended 31 March 2019 |
Year ended 31 March 2018 |
| Capital Employed |
M$ 3,77,50,000 |
M$ 3,77,10,000 |
| Average SHR |
78% |
73% |
| Average SSR (Students Satisfaction Rating) |
8 |
9.5 |
At the end of the course, or at the end of the unit within the course, students are asked to complete a questionnaire rating based on a scale of 1-10 where ’10’ represents ‘Excellent’ with various aspects of course, for example, the knowledge level of faculty, the quality of support material, and the approachability of faculty to ask them questions.
Two issues are becoming increasingly frequent in the students’ comments alongside the scores:
- Students complaint that faculties in the institute were full of attitude not taking the doubts of students, instead of encouraging students to solve their doubts in the class, they insulted the students who raise their doubt during class. So, their standard of education has not been as good as in previous sessions.
- Students in classes need special individual attention, there is need of smart classes, doubt solving sessions etc. to improve the result of students.
Spicy had planned to start a remedial programme for average students for all the centres at the beginning of 2018. However, this programme has been put on hold to reduce expenditure.
Required
Analyse Spice’s performance for the year ended 31 March 2019. [MAY 2020 RTP]
Answer:
Performance of Spice for the year ended 31 March 2019 Revenue
Gross Fees of Spicy has increased by 5.66% in 2019, which reflects the higher SHR (78% vs. 73%) and the increase in average standard fees per student (M$ 15,000 vs. M$ 12,000 per student). However, this information is not enough to conclude how well institute have performed in the year to 2019. Net Fees has only increased 1.22%, this reflects the significant 35.13% increase in the discounts or scholarship offered.
It is observed that even though % change in the SHR is +6.85% (from the budgeted level of 73% to 78%), revenue from fees, net of discount/ scholarship, only increased by 1.22%. This means that average fees collection per student in 2019 was lower than in 2018, despite the higher average standard rate (M$ 15,000 vs M$ 12,000).
It is also important to mention that in tough market conditions, managers have managed SHR, higher than budgeted figure by offering/ awarding the discount or scholarship.
With the increase in SHR, one of the best possible benefit is that, even if i students are paying less fees, they will generate additional revenue from sale of books and test series. For example, in the givemcase additional revenue has increased by approximately 5.23% from M$ 25,895 to M$27,250.
In total, revenue has increased 2.1% in 2019 v 2018.
Overall, given the tough market conditions, any increase in revenues can be viewed as positive, however, the revenue achieved from per student should be greater than the variable cost of providing it.
Operating Profit
Notwithstanding the increase in revenue, operating profits have fallen by j M$ 14,52,000 (6.00%) between 2019 and 2018, due to a sizeable increase in operating costs. There is no detail about Spicy’s operating costs, for example, the split between fixed and variable costs. However, in tough market conditions, cost control is likely to be very important. As such, increase in operating costs M$ 39,27,000 (4.19%) between 2018 and 2019 is potentially a cause for concern and the reasons for the increase should be investigated. However, when looking to reduce costs, it will be very important to do so in a way which does not compromise student’s satisfaction. More generally, Spicy needs to avoid cutting expenditure in areas which will have a detrimental impact on student satisfaction ratings, for example, not providing enough time by faculty to students for doubt solving.
The increase in costs has also led to a fall in operating profit margin. The margin falls from 18.36% to 16.35%. This reduced profitability is also reflected in the institute’s return on capital employed which has fallen slightly from 64.21% to 60.30%. This suggests that the value which Spicy is generating from its assets is falling.
Students Satisfaction Rate (SSR)
Although the reduction in profitability should be a concern for Spicy, the reduction in student satisfaction rate should potentially be seen as a greater cause for concern. The rating suggests that, in the space of one year, it has lost 1.5 points in the scale of 1-10, being the top Engineering Coaching Institute, Spicy cannot afford to lose the points.
Spicy Institute pride itself on their results and level of educational service it offers to its students. Both factors are important considerations for students when considering whether or not to join Spicy Institute.
Therefore, Spicy needs to ensure that student satisfaction levels are maintained as high as possible and it is also important to know that how j its students feel about the services it offers.
Moreover, the decision to defer the remedial programme is likely to have a detrimental impact on the future performance.
Question 19.
Case Scenario: (Balanced Scorecard)
Sabka Bank Ltd., was established on the 30th September, 1940 under the provisions of Co-operative Societies Act by the eminent professionals to encourage self-help, thrift, cooperation among members. Bank was issued Banking License under Banking Regulation Act, 1949 on October 25,1986 to carry out the Banking Business within the national capital and since then the Bank has been growing continuously. At present, Bank has large number of membership of individuals from different sections. The Bank has 12 branches in the NCT of Delhi. Bank offers ‘traditional counter service’. Opening hours are designed to coincide with local market days.
Board of Directors were worried from growing popularity of new style banks. These banks offer diverse range of services such as direct access to executive management, a single point of contact to coordinate all banking needs, appointment banking to save time, free online banking services 24/7, free unlimited ATM access etc.
It has now been decided that the bank will focus on “What Customers Want” and will use a balanced scorecard to achieve this goal.
Required
PRODUCE, for each of the three non-financial perspectives of a ‘Balanced ; Scorecard’, an objective and a performance measure that the bank could use with appropriate reason. [MAY 2018 RTP] (10 Marks)
Answer:
Internal Business Process Perspective
Objective: Cross-sell Products
Measure: Products Purchased per customer
Reason: Cross-selling, or encouragement customers to purchase additional products e.g. insurance, forex etc. is a measure of customer satisfaction.
Only if a service is perceived as highly satisfactory the service would be repeated/additional products or services would be accepted.
Learning and Growth Perspective
Objective: Increase the Number of New Products or Services Sold Measure: Number of Customers Buying the New Products/ New Services.
Reason: Long term financial success requires bank to create new products/ services (e.g. internet banking, ATM access) that will meet emerging needs of current/future customers such as 24/7 banking.
Customer Perspective
Objective: Increase Customer Loyalty
Measure: Number of Accounts Closed or Closure Request Received
Reason: Customer loyalty describes the extent to which bank maintains durable relations to its customers. The share of existing customers should have a high importance as it indicates about image and reputation. Closure request is not a good sign for bank. Bank should investigate reasons for the same and take appropriate actions to improve services offered to retain customers.
Note: Other Objectives and Measures are also possible but they must relate to the bank’s Goal.
Question 20.
(Value Chain Analysis, Balanced Scorecard, KPI)
You are the Finance Manager of Boat Limited which is in the business of manufacturing wire rods. A division in the company manufactures copper wire rods from a single manufacturing plant in Central India. The division purchases raw material (copper cathodes) from various suppliers across the country. The cathodes are melted and wire rods of various dimensions are produced. Each batch of wire rods produced are tested for quality and strength.
The wire rods are stored in rolls in the warehouse and dispatched in company owned trucks as per the requirement of the customers. The customers are required to pay 50% of invoice value as advance and balance 50% within 30 days of delivery of goods. The company prices its copper wire rods based on the price prevailing on London Metal Exchange after adjusting it with a factor to cover conversion costs and profits.
The company explores newer markets by advertising in national dailies and participating in various industrial events in India as well as abroad. An annual conference of customers is conducted by the company to improve customer relationships and attract newer customers. The customers have right to return the material if quality specifications are not met. There is a separate team to handle such complaints.
The following email was sent by the Chief Financial Officer of the company to you.
…………………………………………………………………………………………………………………………………….
From: Chief Financial Officer
To: Finance Manager
Subject – Commodity Price Fluctuation
The board is quite aware of foreign exchange fluctuation related risks. \ However, they are not much aware of risks related to fluctuation in commodity prices. The prices of copper which are used to manufacture copper wire rods have fallen down by over 20% in the last six months owing to global factors.
The procurement team of Copper Wire Division has been waiting for the right time to buy these metals as they expect the prices to fall down further. However, we are at a verge of stock-out of these metals as no purchase was made in the last one month.
The bonus of procurement team largely depends on the annual savings as compared to the budgeted cost of purchase. Iam not happy with the approach of speculation and making profits out of price fluctuation in raw materials. Could you highlight the issues related with our performance measurement mechanism and suggest how it could be improved?
Regards
Chief Financial Officer
Attachment:
Copper Prices Quoted on LME

Required
(i) EXPLAIN and IDENTIFY th#; various primary activities of Copper Division.
(ii) DISCUSS the issues m sth performance measure fit force in the company.
(iii) ADVISE: an alternate performance measure and Identify Key Performance Indicators (KPI). [MAY 2018 RTP]
Answer:
(i) Value chain is defined as “a chain of value added activities; products pass through the activities in a chain, gaining value at each stage”. Value chain focuses on systems, and how business inputs are changed into business outputs purchased by customers. The entire set of activities that a business undertakes to covert inputs to outputs are interlinked to each other.
Porter’s value chain classifies activities into primary activity and secondary activity.
Primary Activities
Primary activities are those activities that are directly related with creating and delivering a product to the end customers. The following activities are considered as primary activities:
Inbound Logistics
Inbound logistics involves arranging inbound movement of materials from suppliers to the manufacturing plants. The activities related to inbound logistics in the case of copper division of Boat limited would involve transporting copper cathodes from multiple suppliers across the country and storing them in the warehouse. The cathodes stored in warehouse would be issued to the production facilities depending on the requirement of the production plants.
Operations
Operations involve those activities which are concerned with conversion of input into outputs in case of manufacturing companies. The activities under operations would include those related to melting of copper cathode and converting the copper cathodes into wire rods, The quality tests carried out for wire rods would also be included as a part of operations.
Outbound Logistics
These include planning and dispatch, distribution management, transportation, warehousing, and order fulfilment. This includes warehousing of finished goods (copper wire rods) and distribution of copper wire rods to its customers. The company uses its own trucks to distribute finished goods to its customers. The scheduling of trucks and dispatch of material would also be a part of outbound logistics.
Marketing & Sales
Marketing and sales are the means whereby consumers and customers are made aware of the product which is ultimately sold to them. % The activities include selling products to the end customers covering activities like product management, price management, promotion and marketing management. Boat limited uses advertisement in national dailies and holds conferences as a part of its marketing and sales efforts. The company also holds annual customer conference to improve customer relations and attract new customers.
Service
In case of manufacturing industry, service generally refers to the after sales service which are required to maintain the value of product and includes activities like installation, repair etc. The service team is also expected to handle customer returns on account of poor quality of copper wire rods.
(ii) What is the issue?
A procurement team is generally a cost center and the most appropriate way to evaluate performance of cost center is the comparison between actual cost and budgeted cost (also called variance). A large portion of bonus (performance measurement) is dependent on the savings in actual purchases.
The company has adopted variance analysis as a measure of performance. If the team is able to reduce the actual cost of purchase as compared to the budgeted cost, a higher bonus is paid. The procurement team has stopped purchase of copper cathodes to save on the purchase budget which ultimately would translate into higher payou of bonus.
The commodity prices of copper have fallen by about 20% in the last six months. The speculation of fall in price has resulted in halting of procurement process. It is very difficult to time the market and such speculation could lead to losses to the company. There could be a stock-out situation if the procurement is not resumed and the situation could hamper the production and overall delivery schedules. The procurement team appears to have taken a short- term view of price movement. The team is focused on earning higher bonus and hence is waiting to buy at lower prices. There is a larger impact of not being able to deliver product on time which could damage the reputation of the company. This has been ignored by the procurement team. Managers must be encouraged to consider the impact on the company as a whole and not on just the own department.
The company is using just a financial measure to measure performance. This can result in lopsided view7 of the goals and objectives of T the company. Managers tend to look at short term profits and ignore the long- term growth.
Optimum Performance Measurement
A performance measurement is most effective when the goals of the respective departments are aligned with that of the company. This ensures that each employee within the company works towards the overall objective of the company. The company manufactures wire rods and the objective of the copper division is to manufacture copper wire rods as per the requirement of the customers.
The profit flows from the main business of the company. If a department focusses on an objective which is not aligned with the main goal, the company as a whole suffers. A stock-out like situation would hamper the image of a company, if wire rods are not delivered as per schedule to the customers.
Another aspect to be considered is that managers and employees are evaluated only on those parameters which are controlled by them. If for example, the procurement team is able to purchase copper at a discount to market price because of their efforts, it could be considered as saving.
The prices of copper are determined by the prices on commodity exchanges and are not in the control of procurement managers. The performance of managers and employees should not be impacted by global change in prices of commodities as they are not controlled by the concerned employees.
(iii) Alternate Performance Measure
The issue with financial performance measures alone is that managers tend to have a short- term view as can be seen in our case. In order overcome possible short- termism of financial measures Kaplan and Norton developed the Balanced Scorecard which outlined four key areas in which company and divisional performance should be measured to focus on both the short and long term needs of the organization.
The key idea is that managers are to be appraised on a variety of measures which include non-financial measures so that their focus is both long and short term. The four perspectives used to measure performance measure in a Balanced Scorecard is given below:
Financial Perspective: This measures the financial performance which is linked to the overall objective of maximizing shareholder’s wealth. We already use financial measures to measure performance. The weightage could be reduced to include other measures. Also, factors beyond the control of managers like commodity prices should be excluded.
Customer Perspective: This includes focusing on customers and meeting their needs. Measures could include quality of material produced, optimum levels of inventory maintained, number of stock-out instances, etc.
Internal Business Perspective: This includes measures to evaluate the performance of business processes with particular emphasis on productivity and efficiency. Measures could include procurement lead time, number of defective purchases etc. The company could use measures like JIT to reduce the procurement lead time.
Training and Growth: This includes focusing on innovating in processes and developing and learning for the future. Trainings could be given to procurement managers to identify best quality of copper cathodes, aspects related to purity etc.
Question 21.
(Balance Scorecard, Triple Bottom Line)
R. Steels is a leading manufacturer of fiat and long products and have state-of tbe-art plants. These plants manufacture value added products covering entire steel value chain right from coal mining to manufacturing Pig Iron, Billets, HR Coils, Black Pipe/GI Pipe, Cable Tapes etc. conforming to international standards. The rock-solid foundation combined with nonstop upgradation and innovation has enabled the R. Steels to surpass its goals constantly. Its vision and values for sustainable growth is balancing economic prosperity and social equality white caring for the planet. It is preparing its balanced scorecard for the year 2018-19. It has identified the following specific objectives for the four perspectives.
| Improve postsaies service |
Improve employee morale |
Improve employee job satisfaction |
| Increase gross margin |
Increase number of customers |
Increase profitability of core product iine |
| Increase plant safety |
Increase customer retention |
|
R. Steels has collected Key Performance Indicators (KPIs) to measure progress towards achieving its specific objectives. The KPIs and corresponding data collected for the year 2018-19 are as follow s:
| Key Performance Indicator |
Goal |
Actual |
| Average replacement time (number of days) |
2 |
1.5 |
| Gross margin growth percentage |
15% |
16% |
| Number of customers |
15,000 |
15,600 |
| Number of plant accidents |
0 |
2 |
| Percentage of repeat customers |
83% |
81% |
| Core product iine profit as a percentage of core-product line sales |
5% |
4.4% |
| Employee turnover rate (number of employees leaving/ Average number of total employees) |
2% |
3% |
| Employees satisfaction rating (1-5, with 1 being the most satisfied) |
1 |
1.2 |
For preparation of Balanced Scorecard report, the following format has been developed:
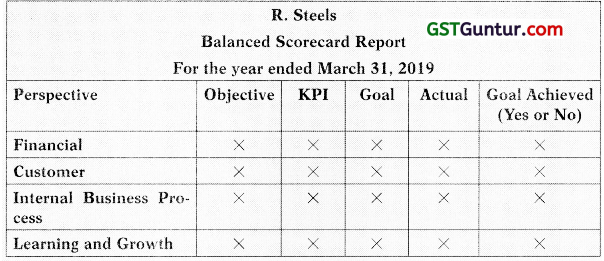
Required
(i) PREPARE a balanced scorecard report using the above-mentioned format. Place objective under the appropriate perspective heading in the report. Select a KPI from the list of KPIs that would be appropriate to measure progress towards each objective.
(ii) R. Steels desires to integrate sustainability and corporate social responsibility related KPIs in their balance scorecard to adhere vision and values. ADVISE R. Steels, using TBL framework. [NOV 2019/2021 RTF]
Answer:
(i) R. Steels
Balanced Scorecard Report For the year ended March 31, 2019
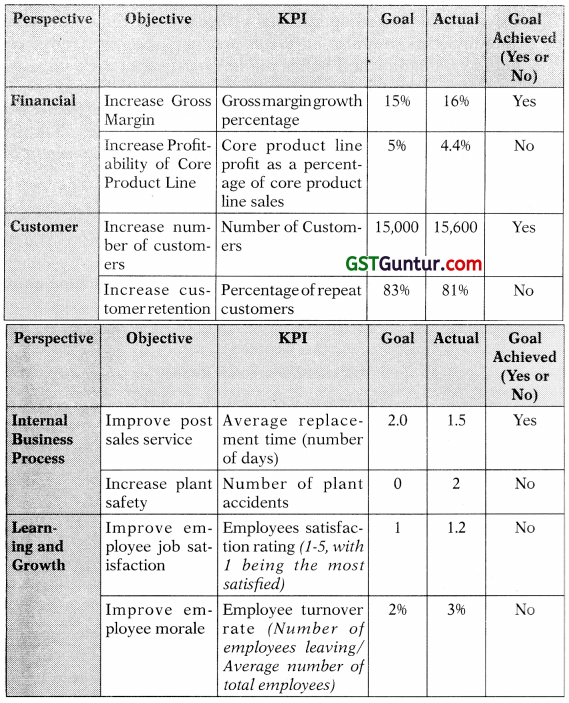
(ii) “Triple Bottom Line” concept encourages companies to measure not only their financial profits, but also the impact that its operations have on the society and environment. Therefore, this framework measures the full cost of doing business by measuring the following bottom lines (i) Profit (ii) People and (iii) Planet.
Diminishing non-renewable resources have forced businesses to focus on sustainable manufacturing. This term refers to managing manufacturing processes such that they minimize any negative impact on the environment by conserving energy and natural resources. In many instances, improved operational efficiency not only reduces waste (thereby costs) but also improves product safety, it strengthens the brand’s reputation and builds public’s trust about the company. As a long- term strategy, this improves business viability and provides a competitive edge to the company. This concept is the “Planet Bottom Line” within the Triple Bottom Line framework. Metrics on the following aspects may be investigated to find out the environment impact of business operations:
- Material consumption
- Energy consumption
- Water utilization
- Emissions, treatment of effluents and waste (include emissions affecting air, water, and land)
- Fuel consumption by tracking freight and transportation costs
- Land utilization
- Recyclability and disposal of product
“Corporate Social Responsibility” enables the company to become conscious of the impact its operations has on the society, CSR programs, through philanthropy and volunteer efforts can forge a stronger bond between itself, its employees, and the wider community. Again, this improves both the brand image as well as builds public’s trust about the company. This concept is the (“People Bottom Line” of the Triple Bottom Line framework, Metrics on the following aspects may be investigated to find out the social impact of business operations:
- Work place environment and labour relations
- Occupational health and safety, accident rates
- Human rights practices – child labour, employee work-place security policies
- Training and education
- Equal opportunity employer – diversity of workforce and opportunities available for employees’ growth
- Suppliers – local sourcing versus sourcing from external markets
- Philanthropy and volunteer programs organized
- Product safety in terms of customer health and safety
- Pricing of essential products to enable wider reach within the society
- Transparent and ethical business practices
R. Steels can study these aspects, determine the relevant metrics, and prepare periodic KPI reports that can help in measuring responsibilities towards sustainability and social impact.
Question 22.
(Balance Score Card)
Healthcare hospital provides medical care to patients to all strata of the society at nominal cost. Hospital has been operating for the last 15 years. It gets grant from the government that helps it sustain its operations. Each year an annual report is submitted to the officials in the health ministry that is in charge of giving out grants to hospitals. Each year over the last 15 years, grants given to the hospital has been increasing. This increment was found necessary to meet the increase in operational costs due to inflation. While operations have been moderately successful in the recent years, the grants committee is of the opinion that the hospital can manage its funds better.
To benchmark performance, performance of Healthcare hospital is being compared with the performance of another government funded hospital within the same city, Lifeline hospital. Both hospitals have similar scale of operations and get the same amount of grant. Given below are some of the parameters that are tracked at both hospitals:
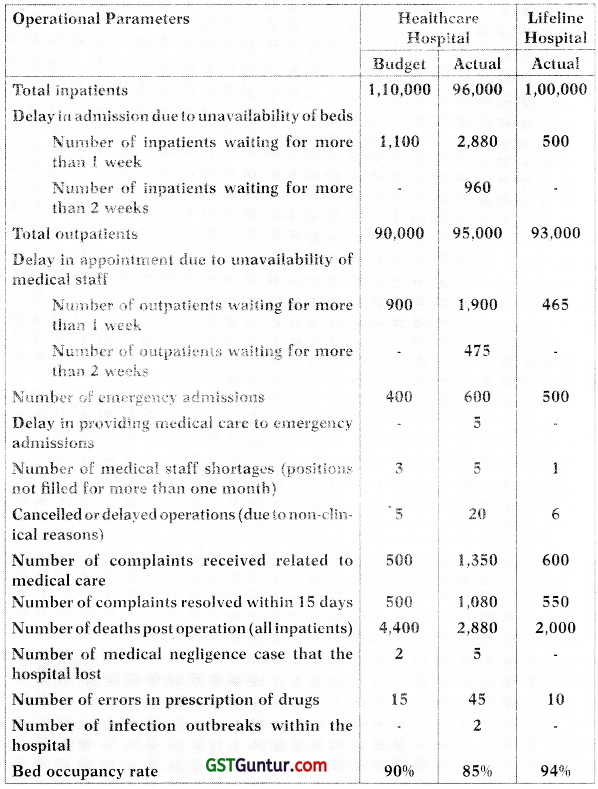
| Operational Parameters |
Healthcare
Hospital |
Lifeline
Hospital |
| Budget |
Actual |
Actual |
| Average patient stay (days) |
4 |
6 |
5 |
| Operating theatre utilization rate |
95% |
90% |
95% |
| Revenue including government grant (in crores) |
15 |
13 |
16 |
| Operating expenses (in crores) |
12 |
12 |
12 |
| ROI |
8% |
5% |
9% |
| Staff Training sessions (hours) |
500 |
500 |
600 |
| Research publications |
5 |
3 |
6 |
- Both hospitals have 50 wards with 10 beds in each ward.
- Each hospital has 50 doctors from various specialties and 75 nurses,
- Both hospitals were open all days of the year.
Required
(i) The grants committee wants to ANALYZE performance of both hospitals with respect to:
- Access to services
- Clinical performance
- Efficiency of operations
- Financial management
- Innovations
(ii) While preparing the balanced scorecard, how will you CATEGOR IZE the above performance measures?
Answer:
(i) Analysis of Performance with respect to:
Access to Services
Access to services is an indicator of whether patients are able to get medical care when they need it. Better access to medical service will improve chances of recovery for the patients. Given the: information in the problem, I this can be assessed using the following parameters:
(a) Delay in admission to inpatients due to unavailability of beds.
(b) Delay in appointments to outpatients due to unavailability of medical staff.
(c) Delay in providing medical care for emergency admission.
(d) Number of medical staff shortages.
(e) Cancelled or delayed operations.
The hospital should aim at reducing the delay and shortages in order to provide patients with better access to medical services.
(a) Delay in admission to inpatients due to unavailability of beds:
As per the hospitals’ policy, patients who need admission have to be accommodated within 1 week to get access to services. Any delay beyond this period is tracked by their information system. For delays, due to unavailability of beds, the hospitals are tracking two time lags, delay by more than a week and delay by more than 2 weeks. Unavailability of beds shows that there are constraints in the capacity of patients to whom the hospital can provide service.
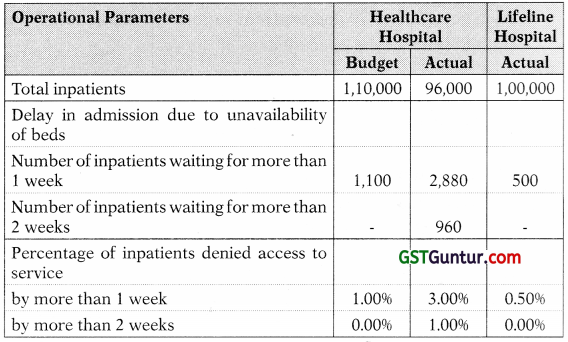
As can be seen, Healthcare hospital has a target to provide admission within a week to 99% of inpatients, delay beyond a week may happen only in 1% of cases. Delay beyond 2 weeks should not occur. However, actual performance indicates that Healthcare hospital could provide admission within a week only to 96% of inpatients. There has been a time lag of more than a week in providing admission to 3% of the inpatients. This is already 2% more than the target. Further, time lag beyond 2 weeks in providing admission has occurred in 1% of inpatients. Therefore, 4% of the inpatients had to wait for more than a week, in some cases more than 2 weeks, to get admission. In contrast at Lifeline hospital, only 0.5% of inpatient faced time lag of more than a week in getting admission to the hospital. There were no instances where patients requiring admission had to wait more than 2 weeks.
This shows that Lifeline hospital provides better access to services as compared to Healthcare hospital.
(b) Delay in getting appointment due to unavailability of medical staff:
| Operational Parameters |
Healthcare
Hospital |
Lifeline
Hospital |
| Budget |
Actual |
Actual |
| Total outpatients |
90,000 |
95,000 |
93,000 |
| Delay in appointment due to unavailability of medical staff |
|
|
|
| Number of outpatients waiting for more than 1 week |
900 |
1,900 |
465 |
| Number of outpatients waiting for more than 2 weeks |
– |
475 |
– |
| Percentage of inpatients denied access to service |
|
|
|
| by more than 1 week |
1.00% |
2.00% |
0.50% |
| by more than 2 weeks |
0.00% |
0.50% |
0.00% |
As per the hospitals’ policy, outpatients should be able to get appointment within a week to meet the medical staff. Delav beyond a week is 3 tracked by the hospital’s information system as delay beyond a week and delay beyond two weeks. Healthcare hospital targets to provide appointments to meet medical staff within 1 week to 99% of the out patients. Delays due to unavailability of medical staff can occur only in 1% of the cases. However, actual appointment schedule indicates that 2% of the outpatients had to wait for more than 1 week and 0.5% of the outpatients had to wait for more than 2 weeks to meet the doctor. This, indicates that Healthcare hospital.has not been able to meet its target. To improve performance, the reason for unavailability of medical staff has to be understood. It might indicate that more hiring is needed or high medical staff turnover.
In comparison, Lifeline hospital has provided better services to outpatients, only 0.5% of the patients had to wait beyond a week to get appointment with the doctor. This shows that Lifeline hospital provides better access to services as compared to Healthcare hospital.
(c) Delay in providing medical care to emergency admission patients:
In the case of Healthcare hospital, there were 5 instances when medical care could not be provided to emergency admission patients immediately. The hospital aims never to have such instances however this target has not been met. In case of emergencies, medical care is required urgently, any delay may impact recovery of the patient. Reasons for the delay in providing medical care to such patients have to be investigated. Lifeline hospital has been able to provide medical care immediately to all its emergency admission patients.
This shows that Lifeline hospital provides better access to services as compared to Healthcare hospital.
(d) Medical staff shortages:
The hospital should have enough doctors and nursing staff at any point in time to be able to provide good quality of medical care to patients. If there are vacancies, the existing staff have to bear extra patient load.
This could lead to delays, some of which have been outline above.
This results in patients getting lesser access to medical services when they need it. Healthcare hospital has 5 medical staff vacancies that have been vacant for more than a month, as compared to the target of 3. There are lesser resources available to provide patient care. In comparison, Lifeline hospital has only 1 position that was vacant for more than a month.
This shows that Lifeline hospital provides better access to services as compared to Healthcare hospital.
(e) Cancelled or delayed operations due to non-clinical reasons:
When operations are cancelled or delayed are cancelled due to non-clinical reasons, it indicates that there are administrative issues that deny patients access to medical care. Possible reasons could be unavailability of operation theaters, unavailability of medical staff or unavailability of required instruments or medicines. Compared to an expected 5 such instances, the actual cancellations or delays have been 20 in the case of Healthcare hospital. This is a huge variation that needs to be investigated. Given in the problem that operation theatres are used only to 90% of their availability. Possibly cancellations are not due to unavailability of operation theatres. It could be due to medical staff shortage or unavailability of instruments. Reasons have to be investigated to take appropriate action. Comparatively, such instances are fewer in the case of Lifeline hospital.
Clinical Performance
Clinical performance can be evaluated by looking at the quality of actual work performed. The parameters to look at are:
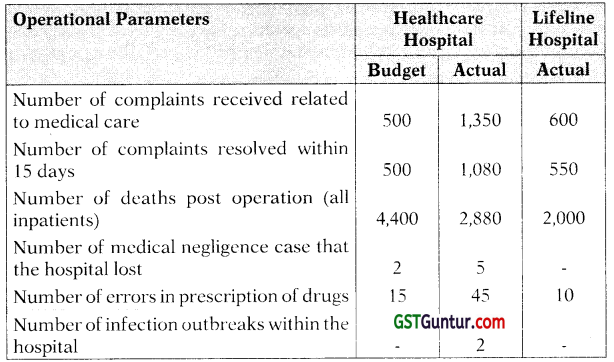
(a) Number of complaints received related to medical care:
As can be seen from the table, the number of complaints received by Healthcare hospital is more than twice the expected volume. Only 80% of these have been resolved within the time frame of 15 days. Comparatively, Lifeline hospital gets fewer complaints also the complaint $ resolution rate within the given framework is much higher at 92%.
(b) Number of deaths post operation:
The actual deaths post operation are much lesser. While this is a good indication of quality, the objective of the hospital should be to keep this as low as possible. Lifeline hospital has a lower mortality than Healthcare. Good quality medical care can contribute towards preventing deaths post operation.
(c) Number of medical negligence case that the hospital has lost:
The fact that the hospital has lost a case of medical negligence shows that the quality of clinical care provided is questionable. In this case of Healthcare hospital, the number of such cases lost is 5. This is in excess of an expected loss of 2 cases. This indicates that quality of clinical care is found wanting at Healthcare hospital. Lifeline hospital has not lost any case of medical negligence implying that quality of medical care is better than Healthcare.
(d) Errors in prescription of drugs:
Prescription of drugs to cure an aliment should always be accurate. 1 Any errors could be disastrous to the patient’s health. Compared to the expectation, Healthcare has three times the number of prescription errors. This shows that medical staff have been negligent in providing their service. Again, Lifeline hospital has a better record comparatively.
(e) Infection outbreak in hospital premises:
Outbreak of infection within hospital premises indicates that proper standards of hygiene are not being maintained at Healthcare hospital.
Efficiency of Operations:
Operating efficiency can be assessed using the following parameters:
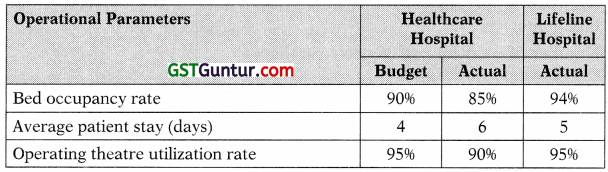
(a) Bed occupancy rate:
Bed occupancy is a factor that is dependent on the number of inpatient admissions. While this factor cannot be controlled by Healthcare, it is important to track this ratio to look at capacity utilization. The bed occupancy rate is lower than the expected rate. If this persists over a longer period, the hospital may want to explore the option of scaling down the number of wards and beds. The space freed up can be utilized for some other productive purpose.
However, as explained in point (a) above, 4% of the inpatients at Healthcare hospital are being denied admission due to unavailability of beds. This is a contradiction that needs to be investigated. Possible reasons could be administrative ones like inability to get the room and bed on time once the previous patient vacates. Else there may be mis-communication between the department discharging patients and the department admitting patients. Bed occupancy may not be tracked on real time basis due to which these delays in admission have occurred.
Lifeline hospital has an occupancy of 9496 that shows that it has just the sufficient number of beds to meet demand.
(b) Average patient stay (days) in the hospital:
On an average a patient is staying in the hospital for 2 days more than the target of 4 days. While this factor is dependent on the type of ailment, lower the patient stay the higher can be the bed occupancy rate.
That means more patients can utilize the same resources if patient stay is shorter. This may be needed when there is a constraint on the beds available, which is not the scenario in the current case.
However, before taking action to improve bed occupancy rate, a hospital should ensure that quality of medical care given is not compromised.
In the given problem, bed occupancy is only 90% at Healthcare hospital. Therefore, the hospital can afford to have longer patient stay. Lifeline hospital has lesser patient stay day, only marginally different from Healthcare’s record. In both cases, since there is no constraint on bed occupancy, higher average patient stay can be managed without any constraint.
(c) Operating theater utilization rate:
Utilization of operating theatre is subject to the nature of treatment, something that cannot be controlled by a hospital. However, it is necessary to track this parameter since it shows whether the facilities that | are currently in place are sufficient and are utilized properly. Again, at 90% Healthcare hospital has a lower operating theatre utilization rate compared to the expected usage. If this continues in the long run, the number of operating theatres can be reduced to make resources
available for other uses.
Lifeline hospital has a higher utilization rate at 95%, indicating more g efficient use of resource.
(d) Medical staff shortage:
Medical staff is the most important resource at a hospital. Higher vacancies could imply higher staff turnover. A possible reason could be dis-satisfaction with the employer. Healthcare should understand the reason for have 5 positions that it has not been able to fill in within 30 days. Since this reduces the number of staff available, efficiency of the hospital will suffer. Comparatively; Lifeline makes better use of its medical staff since only one position was vacant for more than a month.
Financial Management
Healthcare hospital has an actual surplus of ₹ 1 crore compared to a budget of ₹ 3 crores. (Surplus = Revenue – Operating expense). ROI of 5% is below the target of 8%. The grants committee feels that there is a wastage of funds at the hospital. Therefore, areas of wastage should be identified such that operating expenses can be controlled better. Lifeline hospital has a surplus of ₹ 4 crores. Since there are other hospitals like Lifeline that are vying for grant, Healthcare has to make itself competitive in this respect. Therefore, it has to be more efficient, effective and economical in its operations.
Innovations
Research publications indicate that newer discoveries have been made in fields that can further the horizons of knowledge. Therefore, research publications are an important indicator of innovation.
While staff training is not directly related to innovations, they do keep the experts up to date in their subject area of expertise.
(iii) Performance Measures Categorized into the Balance Scorecard
- Customer Perspective would include availability of service measures and clinical performance measures.
- Internal Processes Perspective would include measures used to determine efficiency of operations.
- Financial Perspective would include details of the surplus generated and ROI.
- Learning and Growth Perspective would include staff trainings and research publications.
Combined with other parameters that the grant committee finds important the balanced scorecard can benchmark the hospital’s performance with its own targets and the performance of Lifeline hospital. Decision to extend; grants and its quantum can be decided on this basis.
Question 23.
Corner is an online Pizza delivery business. Corner is one of the QSR that created its own system, website, and app. Corner’s pizza baking points having a home delivery system. Due to popularity ofE Commerce awareness among the customers, online food order system come up with new opportunity for food business. Corner has grown rapidly due to boom in online platform. It is now operating around 1,000 points.
Corner’s vision is to increase shareholder wealth by making and timely delivery of quality pizza. Corner provides customize pizzas as per customer’s taste. People choose to order pizza online for different reasons not wanting or having time to cook, do not have to wait in a queue for order or taking delivery. During happy hours from 4pm-7ptn, baking points have a great deal on both pizzas and beverages. The customers can call, text or order pizzas online. Corner’s collection and delivery service uses delivery motorcycles and scooters to transport pizza parcels. The process consists of a customer choosing the restaurant of their choice, scanning the menu items, choosing an item and finally choosing the place of delivery. Payment is then managed by cash on delivery, or with a credit card, debit card etc. when the delivery boy delivers the pizza at the customer’s place of delivery.
Issue
Corner’s delivery service is slow. It uses an automated reminder sendee like Dial My Calls to send updates to customers about the status of their order – when it goes into the oven, when it comes out, when it is out for delivery, and so on. Customers are willing to wait a little longer if they know that pizza is on its way. Slow delivery reduces the taste, aroma and flavour of pizzas delivered.
Recently, financial performance and market share of Corner has deteriorated. The CEO of Corner believes that reductions in customer satisfaction and flexibility, caused by a decline in operational perfor¬mance, may have led to the recent deterioration. It has been suggested that to use the Lynch and Cross’s Performance Pyramid to reverse this deterioration and four new measures for operational performance have been suggested.
| Measure |
Description |
| Live tracking system/ GPS driver tracker {to choose the best and the shortest routes for food delivery vehicles and to guide the drivers in real time basis) |
Number of successfu l deli verves per day |
| On-time delivery |
% of pizzas delivered within 30 minutes of the hooking time |
| Fuel consumption |
Average fuel consumption per kin travelled |
| Improving the taste (It is proposed to use pizza delivery bags to keep the pizzas hot and fresh) |
% of positive feedback |
Required
EVALUATE the extent to which the suggested new measures can be used to manage operational performance at Corner.
Answer:
The performance pyramid covers not just only financial performance but also a broad range of underlying processes of business organization which drive financial performance. It facilitates to set financial and non-financial performance measures. Non-financial measures are important indicators which can help to attain long-term financial performance. The elements of the pyramid are interconnected, and each level in the pyramid backs the one above it. For example, on-time delivery of pizzas will increase customer satisfaction, which will eventually lead to greater market share, one element of the vision.
The left side of the performance pyramid covers external effectiveness, such as customer satisfaction, while the right side of the pyramid covers internal efficiency, such as flexibility and productivity. Operational performance is signified by the four elements, which are quality, delivery, cycle time and waste, at the bottom level of the performance pyramid. Operational performance measure can help the organization to achieve the vision of the organization. Reduction in pizza delivery time and delivery of fresh hot delicious pizza ie., quality can help Corner to achieve its vision.
Cycle time can be reduced by using live tracking system. Live tracking system is a key to improve productivity and profitability. It can help in taking well-versed decisions and schedule pizza delivery more efficiently.
GPS driver tracker will allow real time monitoring of vehicles and offer detailed insights of fuel usage, driver’s behaviour, engine’s idle time, etc. using this data efficiently; money saving areas for pizza delivery can be identified. Through this tracking system idle delivery vehicles can also be identified. This may lead to an increase in the number of deliveries per day and more deliveries, translated into more business.
It can also assist Corner to reduce the fuel consumption and unnecessary overtime costs. Reducing fuel consumption would lead to an improvement in financial performance. Measuring average fuel consumption per km travelled does not, however, relate directly to activity, for example, to the number of pizzas delivered. Average fuel consumption will vary between type of vehicle used for delivery ie., scooters or motorcycles and conditions, of roads in the areas of delivery. Average fuel consumption per km is not a good measure of waste or any other aspect of operational performance of business organization. To be useful in managing operational performance, this measure should be changed to average fuel consumed per pizza delivered which would be an appropriate measure for waste.
A loyal and satisfied client is paramount to success of a food delivery business. With the assistance of tracking system, pizza delivery vehicles will respond to service calls quickly and reach their destination on time. Customers are likely to value on-time pizza delivery very much, this will be one of the main causes, and they will choose pizza from Corner. The proportion of on-time delivery is a measure of operational performance ie., key driver for customer satisfaction.
Moreover, use of pizza delivery bags to keep the pizza hot and fresh will improve the taste, aroma and flavour of pizzas, which is also related to the quality element of the performance pyramid and is key driver of customer satisfaction.
Question 24.
(Performance Pyramid)
You are a paid assistant working in SBC LLP – an accounts consultancy firm. You have received the following email from one of SBC’s senior partner:
To: DG
From: SB
Date: 22/06/20XX
Subject: PEL meeting this afternoon
As you are probably aware, we are meeting with the managers of PEL later this afternoon to discuss several key issues, and I need you to do some research for me. I need a report that covers the following: Analysis of the new proposal for the period 2017 to 2019 based on
- external effectiveness and
- internal efficiency
To help you with this, I’ve attached a copy of our forecast of PEL’s financial and non-financial data for the period 2017 to 2019. Please read it carefully and email me back as soon as possible so I have time to prepare before the meeting.
Thanks SB
———————————– Attachment —————————–
Background to PEL
Precision Engineering Ltd. (PEL) specializes in engineering design and manufacture in the automotive and motorsport industry. PEL’s design team has many years’ experience in the design and development of engine components for the market and high performance engines. PEL has identified a number of key competitors and intends to emphasis on close co-operation with its customers in providing products to meet their specific engineering design and quality requirements. Efforts will be made to improve the effectiveness of all aspects of the cycle, from product design to after-sales service to customers. This will require data from a number of departments in the achievement of the specific goals of the new proposal. Efforts will be made to improve productivity in conjunction with increased flexibility of methods.
Forecast of PEL’s Financial and Non-Financial Data
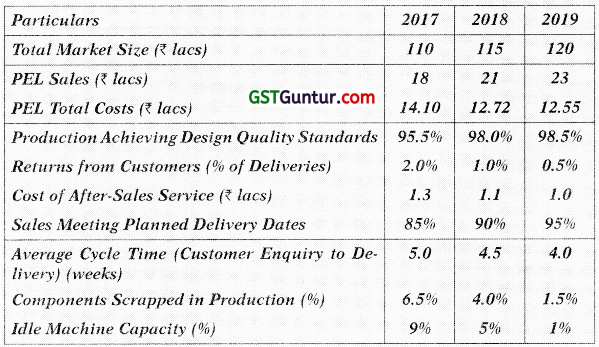
Answer:
To: SB
From: DG
Date: 22/06/20XX
Subject: Re: PEL Meeting this afternoon
Please find below my analysis of the points you wished me to examine for PEL. Please let me know if you wish to discuss any of these points in more detail.
Kind Regards DG
External Effectiveness: The marketing success of the proposal is associated with the achievement of customer satisfaction. The success will need an efficient business operating system for all aspects of the cycle from product design to after-sales service to customers. Customer satisfaction is linked with Improved quality and delivery.
Quantitative measures of these factors are as follows:
- Quality is expected to improve. The percentage of production achieving design quality standards is expected to increase from 95.596 to 98.596 between 2017 and 2019. In the same period, returns from customers for replacement or rectification should drop from 296 to 0.596 and the cost of after-sales service should drop from ₹ 1.3 lacs to ₹ 1.0 lacs.
- Delivery efficiency improvement that is expected may be measured in terms of the rise in the percentage of goods achieving the planned delivery date. This percentage rises from 85% in 2017 to 95% in 2019.
Internal Efficiency: The financial success of the proposal is linked to the achievement of high productivity. This should be helped through reduced cycle time and decreased levels of waste. Quantitative measures of these factors are as follows:
- The average total cycle time from customer enquiry to delivery should drop from 5 weeks in 2017 to 4 weeks in 2019.
- Waste in the form of idle machine capacity is expected to drop from 9% to 1% between 2017 and 2019. Also, component production scrap j is expected to drop from 6.5% in 2017 to 1.5% in 2019.
Question 25.
Case Scenario
‘Digital Computers’is a manufacturer and wholesale dealer of electronic goods. In the initial years, the company was performing excellent and was improving year after year. However, from past three years, the performance of the company is towards decreasing trend. In a report, the sales manager stated that sales had been disappointing, and company’s sale has gone down drastically. However, the sales manager pointed out that some orders had been lost because the production department had been unable or unwilling to adapt product specifications to the requirements of the customer. Also, one of company’s larger customers had returned goods which it claimed did not meet its requirements, and the customer has subsequently not placed any further orders with Digital Computers. In addition, a delay in the completion of another large order meant that some revenue originally budgeted for this year would not now be earned until next year. The employees and managers are not motivated to perform at their best nor are the cycle time and waste at production department monitored.
Summary of Annual performance figure
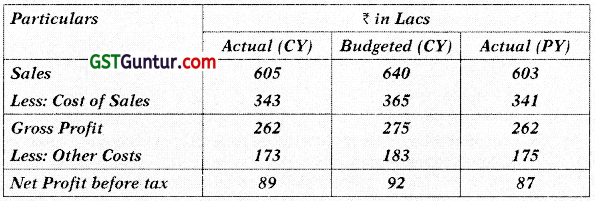
The CEO believed that company’sperformance measures needed to link operations to strategic goals more closely, and they needed to focus on non-financial as well as financial measures. The CEO has suggested that Digital Computers should use a structure for setting targets based on the concept of the performance pyramid and should not focus only on financial performance.
Required
(i) LIST, how the system of performance measurement within Digital Computers could be improved?
(ii) ASSESS how the implementation of a performance pyramid might help Digital Computers achieve its stated objectives for sales and profit growth.
Answer:
(i) The performance reporting system of Digital Computers appears to have focus exclusively only on financial performance and does not provide information about effectiveness and efficiency issues which may be affecting the company’s performance. Digital Computers can improve its performance by establishing a range of operational measures which should include both financial and non-financial performance targets.
Some of the key pointers which can improve the performance measure at Digital Computers:
- Be allied to corporate strategy, which needs to be linked to day-to-day operations of Digital computers.
- Focus on customer satisfaction which is of foremost importance as orders have been rejected as it did not meet the requirement of customers, hence increase in flexibility needs to be adopted.
- Consider internal as well as external measures in the company i.e. internal such as waste and cycle time can be monitored at production department as well external measures like customer’s requirement can be assessed.
- Make explicit the trade-offs between different dimensions of performance i.e. in order to increase performance on non-financial performance dimension it has to decrease performance on the financial dimension.
- Consider all important factors to assess the performance whether difficult to measure.
- It appears that ‘Digital Computers’ is having poor communication and information sharing between departments. Therefore, having an integrated communication system across the organisation is recommended.
(ii) Establishing corporate level objectives – Establishing a performance pyramid structure should begin with the overall corporate objective or corporate vision. In Digital Computer, there may be the objective of increasing profit by a fixed percentage each year and increasing market share. The overall objective should then be used to establish targets at the next level down in the performance hierarchy.
Strategic business unit objectives: At the business strategy level, performance targets should then be created for both internal efficiency which includes financial targets and external effectiveness which ineludes marketing targets. The financial and marketing targets should be consistent with each other.
External effectiveness: The marketing success is associated with the achievement of customer satisfaction. The success will need an efficient business operating system for all aspects of the cycle from product design to after sales service to customers. Customer satisfaction g is linked with improved quality as well as focus on delivery of goods provided as per customer specifications.
Internal efficiency: The financial success is linked to the achievement of high productivity. This can be gained through reduced cycle time and decreased levels of waste. Quantitative measures of these factors are:
- The average total cycle time from customer enquiry to delivery.
- Waste in the form of idle machine capacity.
Setting targets – Targets should be identifiedf or productivity, customer satisfaction and flexibility. Targets for flexibility may be qualitative in nature, relating to Digital Computer’s ability to adapt product specifications to customer requirements. Targets for measuring customer satisfaction may include targets for reducing the volume of customer returns. For instance, specific quality targets may help Digital Computers to reduce the volume of customer returns. Targets for cycle time and delivery may help the company to complete customer orders more quickly, thereby increasing the amount of orders it can complete in a year and hence achieving its sales target and thereby its profit.
Question 26.
Krispy Meal is a fast food joint operating in a very competitive business environment. It is a profitable business with very good prospects for growth. A strategy development meeting is underway to chalk out a plan to improve business growth in a very systematic measurable manner.
The following information is given to you:
Krispy Meal has the following mission statement “Derive strength to grow in scale using our passion for the craft of cooking and service that will satisfy our customers, employees and other stakeholders. ” Krispy Meal is a closely held partnership firm with five partners. It started at a scale of operations that catered to the local demand within a locality. Reputation for good quality food and service has help it scale up its operations in the recent years. Most of the key decisions relating to operations like decision about the menu and its method of preparation, product pricing, finance, marketing, administration etc, are centralized. Skilled chefs, managers for various functions and the firm’s partners are part of this core team.
A general survey published in a food trade magazine highlighted people’s perception about fast food diet. Predominant opinion wras that the current food platter available in food joints across the town were not healthy option. People want healthier choices in the menu when they dine out. At the same time, they do not wrant to compromise on taste or presentation of the food item. The other focal point for improvement was the order taking system. In most food joints, the current system is manual where the order taking staff note down a customer’s order on paper, send it to the kitchen and then delivers the order on intimation from the kitchen, which is also done manually by the kitchen staff. This system has problems like errors in taking down orders, most times delivery staff are unaware of the content in an item or its availability, delays in delivery leading to customers complaining about food served cold etc. This problem takes away the pleasure of dining out and is leaving customers dissatisfied. Another scope for improvement is that customers want more payment options other than cash to settle their bills. With the advent of plastic money and mobile e-wallet payments carrying cash around has become cumbersome for most of them.
The partners have decided to use this as an opportunity to develop Krispy Meal as the niche food joint addressing the customer’s concerns, while managing to remain profitable. Consequently, Krispy Meal plans to expand by providing more choices along with its regular menu to health-conscious customers. Also, revamping its ordering, delivery and payment system would improve customer experience, A reasonable return at the overall firm level would be a return on equity (Net Income./Total Partnership Capital) of 25% each year. Capital structure will remain unchanged. The partners are not interested in diluting their share by bringing in new partners or take external funding with ownership stake. They may however utilize bank financing for expansion, but only if required.
Expansion of business will entail opening new branches in other localities as well as forging franchise with other stakeholders. However, Krispy Meal is not clear how to measure market share since the fast food industry market is not entirely an organized sector. There is no clear information about the overall revenue of the whole sector.
In the past, it was quality of its products that drove growth. The management wishes to maintain high quality standards across branches and franchisee. Therefore, an internal quality control department may be established to look into the same. External certifications from government food inspectors and other recognized agencies would also be required to be met. Quality refers to both product quality and service quality, in this -55 case, service being an inherent part of customer experience.
The staff at Krispy Meal are also excited at this opportunity. Expansion of the food joint would present a more dynamic work culture. Chefs would have the opportunity to enhance their skill by trying out various ways to cater to the consumer’s palate. Ordering and delivery staff would have the opportunity to enhance their people management skills. This learning opportunity would definitely be an impetus for their career growth, With expansion chances of promotion within the organization increase. Financially, better business leads to the expectation of better pay and reward system.
Consequently, the management is intent on developing a performance management system that tracks performance across the organization. Among the different models, the Building Block Model is being considered.
Required
ADVISE the partners how the Building Block Model at Krispy Meal could be implemented. [Nov 2017 RTP/March 2018; Oct 2019 MTP] (20 Marks)
Answer:
Performance management using the Building Block Model poses three questions based on which the performance measurement system is developed:
What dimensions of performance should the company measure?
Dimensions are the goals that the company wants to achieve based on its overall strategy, those goals that define its success, How to set the standards (benchmarks) for those measures?
What are the rewards needed to motivate employees to achieve these standards?
Dimensions
Dimensions (goals) include financial and non-financial goals. Dimensions are I further categorized as into results and determinants. Results are tracked as (a) financial performance and (b) competitive performance. Determinants are tracked as (a) quality, (b) flexibility, (c) innovation, and (d) resource utilization. Determinants influence results.
Results
(a) Financial Performance: Krispy Meal is a closely held partnership with 5 partners. Partners are interested in earning profits that have been benchmarked at an overall return on equity of 25% each year. This can be derived from periodic financial statements that get prepared as part of the accounting function. Partners want to retain the current capital structure. This implies that they do not have any plans to go public or have other external funding with ownership stake. They may take loans from banks for funding their expansion.
Consequently, if they want to expand, the firm has to make sufficient profits that will yield ample cash reserves. Therefore, Krispy Meal’s financial performance dimensions should also include profitability,
ratios like gross profit ratio, net profit ratio, operating margin, return of capital employed (if bank loans are taken) etc. Cash profit and changes in cash reserves may also be included as dimensions of performance.
These measures should be tracked at the firm’s overall level as well at the individual branch/franchisee level.
(b) Competitive Performance: Krispy Meal was to be a niche joint in a highly competitive segment. However, to measure how it compares with its peers there is a limitation in terms of availability of information due to the unorganized nature of the fast food industry. All the same, one of the measures that can be helpful are the number of branches franchisees the firm is able to open. Krispy Meal is also likely to have a competitive edge because it is foraying into providing healthier food choices along with its regular menu. Since this is unique among its segment, it will retain a competitive edge until its peers start replicating the same. Therefore, one
other measure for competitive performance could be the spread and uniqueness of Krispy Meal’s menu as compared to its peers. Information for this could be gathered from published /researched sources like trade magazines as well as informal sources like customer feedback /word of mouth.
Determinants
(a) Quality: Quality drove past performance and it will continue to drive performance even after expansion. For product quality, the management should track if internal quality checks and external certifications are met periodically. Quality control should cover all branches and franchisees. Non-compliance may require immediate attention of the management. For service quality, periodic training programs can be initiated to educate the staff with people management skills. Therefore, Krispy Meal should determine parameters that the management would be interested in ensuring that quality standards are met and how non-compliance should be reviewed.
(b) Innovation: Innovation involves experimenting with the appropriate inputs which make them healthy. At the same time, the healthier option should satisfy the taste and presentation preference of customers, g This requires innovative efforts from qualified and skilled chefs. This § will give the competitive edge to Krispy Meal. Innovation has to be constant and not a onetime exercise. Therefore, management may p review the number of new variants that have been introduced in the menu, regularity of these introductions and customer feedback of the same.
(c) Flexibility: Growth in scale of operations combined with a competitive business environment implies that Krispy Meal should have some flexibility in its operations. This could mean ability to hire staff quickly, cater to seasonal surges in customer’s demand etc.
(d) Resource utilization: Better utilization of resources help business function efficiently. Revamping the order, delivery and payment system would improve the way resources (kitchen, ordering and delivery staff) operate. Lesser errors and delays would increase capacity utilization, freeing up time to cater to more customers. Consequently, pressure on resources decreases. Therefore, some indicators to be tracked can be overtime idle time of kitchen, ordering and delivery staff, turnaround time in these functions, table occupancy rate, breakage, or wastage of material etc. Again here, the management should chart out the appropriate dimensions that will help them track resource utilization.
Standards:
Standards are the benchmarks or targets related to the performance metric that is being tracked under each dimension. To be useful, standards should ! have the following characteristics:
(a) Ownership: It is important to establish who in the organization structure is responsible for achievement which performance metric. Krispy Meal has to consider this very carefully. As explained in the problem, many key management functions like decisions about the menu and its preparation are determined by a core team. Similarly, the centralized core team is handling finance and marketing. However, at the branch level, managers of various operational functions can be held accountable for performance of that specific process. For example, the chef at a particular branch can be held accountable for the quality of food prepared in that branch (Dimension: Quality). Similarly, the head of the order taking staff at a particular branch can be held accountable for the overtime that the staff at putting in at that branch (Dimension: Resource utilization).
(b) Achievability: Benchmarks and targets will be useful only if they are achievable. The managers who have ownership for the achievement of performance metric have to be involved in setting benchmarks or JS targets. They should be clearly defined, preferably quantifiable. At the same time, they should be in line with the firm’s overall strategy. If the target is set very high staff can get de-motivated. If set too low, will not raise the bar for performance. If not in line with the firm’s overall strategy, there will be discord or gap between the firm’s performance and what it wants to achieve.
(c) Equity: Benchmarks should be equally challenging for all parts of the business. Krispy Meal should customize its performance measure for each function like kitchen staff, order and delivery staff, finance staff, advertising staff etc. For example, while turn around time to meet a customer’s order would be relevant metric to the kitchen, ordering and delivery staff, popularity of the advertisement jingle for Krispy Meal would be the relevant metric for the advertisement department. The rigor of the target should be uniform across departments. Otherwise the staff would view the benchmark system as being biased towards select functions within the firm.
Rewards
This relates to the reward structure within the firm that includes compensation package, bonus, rewards, awards, facilities provided to employees etc. Proper reward system is required for achievement of standards while maintaining costs at optimum levels. Krispy Meal should have a well-defined HR policy for compensation, bonus, promotion, and reward. A good system should have the following characteristics:
(a) Motivation: Does the reward system drive the people to achieve targets and standards? A low reward system would not induce staff to work towards the goal. Goal clarity and participation in target/benchmark setting can motivate staff to achieve standards. While some part of compensation may be fixed, other parts can be made variable. For example, bonus of the advertising staff can be aligned to the sales generated, Chefs can be rewarded bonus based on sales as well quality measures etc. Better job prospects in a growing environment would also be a good motivator. Krispy Meal’s management should track various metric in this regard. Some of them could be percentage of bonus paid to the overall compensation package categorized staff cadre, attrition rate, internal promotions, cross training programs etc.
(b) Clarity: The reward package should be clearly communicated to the staff. It should be understood by the staff concerned. They should be told what kind of performance will be rewarded and how their performance will be measured. Krispy Meal may consider having a dedicated HR team for this purpose.
(c) Controllability: Unlike the traditional understanding, rewards need f;
not be based only on the financial element that the staff can control, There may be other non-financial elements for which rewards can be given. Both aspects however need to be controllable by the staff concerned. For example, the chef can come up with a popular menu. If the pricing of the product, managed by the central core team, is such that it results in a loss to Krispy Meal, the chef may not get the much-deserved bonus. This is not a good reward system and might lead to attrition.
Question 27.
(Fitzgerald and Moon Model)
Learning Horizons is an educational institute that conducts courses for students in accounting, law and economics. The institute is partially funded by the government. The institute aims to provide quality education to students of all backgrounds. The institute admits students who can fund their education privately as well as those who get sponsorship from the government. Knowledge base is another educational institute in the same city providing courses similar to Learning Horizons. It is entirely private funded college where students arrange to pay for their own fees. It can be taken as a peer institution for comparison purposes.
Information about their operations for the year ended March 31, 2019 are as follows:
(1) Both Learning Horizons and Knowledgebase offer their courses that last the entire year. AH of them are regular classroom lectures conducted through the week.
(2) Budget and actual fee rate structure for the year are the same. Information about the fees for each course are as follows:
Budget and Actual Fees in ₹
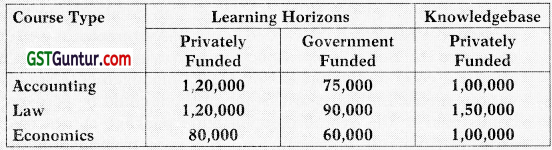
(3) Salary details for lecturers and administrative staff are as follows:
Salaries in ₹
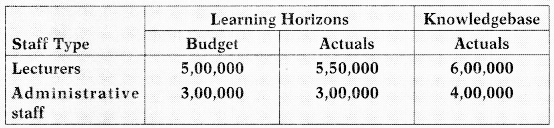
(4) Budgeted costs for the year based on 8,500 students per annum for Learning Horizons are as below:
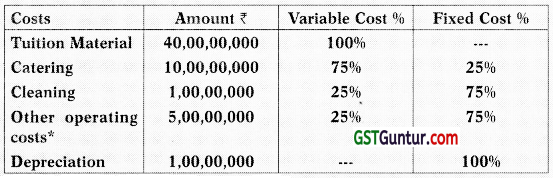
(5) Actual costs (other than salary costs) incurred during the year:
| Costs |
Learning Horizon |
Knowledgebase |
| Tuition Material |
42,00,00,000 |
40,00,00,000 |
| Catering |
10,00,00,000 |
13,00,00,000 |
| Cleaning |
1,00,00,000 |
1,50,00,000 |
| Other Operating Costs* |
6,00,00,000 |
5,00,00,000 |
| Depreciation |
1,00,00,000 |
1,50,00,000 |
(6) Keeping in line with latest technological developments, the manage-ment of Knowledgebase is introducing on-line tuition support by its lecturing staff. Learning Horizons on the other hand offers distance learning course. A general feedback from prospective students has revealed that some students would like weekend courses since during the wreek they focus on their regular jobs. Also, some students have requested for intermediate qualification, in the event that they dis-continue the course halfway due to inability to complete the course or for other personal reasons.
(7) Both Learning Horizon and Knowledgebase have a policy to have a lecture staff of 50 throughout the year. When there is a shortfall in teaching staff available, instead of recruiting a fulltime lecturer, Knowledgebase substitutes the requirement with freelance staff for lectures. The cost of freelance staff is much lower than regular staff.
(8) Appendix with further details:
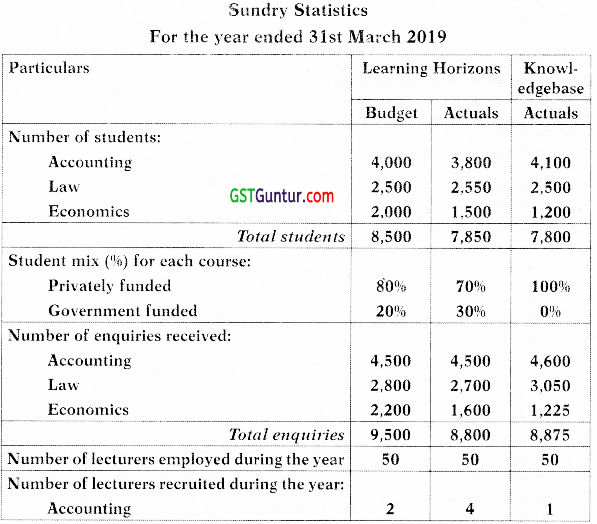
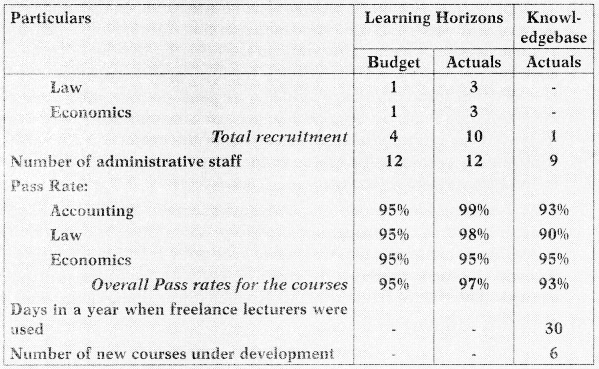
You are the management accountant of Learning Horizons. The results for the year are to be reviewed next week by the management. To assess performance, you want to prepare the report as per the Fitzgerald and Moon model.
Required
(i) Using the “Results” dimension of performance as per the Fitzgerald Moon model prepare a variance ANALYSIS of Learning Horizons actual and budgeted financial performance. Also, based on the information given in the problem, collate the actual financial figures for Knowledgebase, use it as a basis to prepare ANALYSIS of competitiveness of Learning Horizons and Knowledgebase.
(ii) Using the “Determinants” dimension of performance as per the Fitzgerald Moon model EXPLAIN
(a) Quality of service
(b) Flexibility
(c) Resource utilization
(d) Innovation
(iii) Course fees set by the government for various subjects cannot be increased beyond an average of t 75,000 per student. If the costs are maintained within this budget, the government can provide more sponsorship or grants in future,
ADVISE a method that the management of Learning Horizons can use to resolve this. [Nov. 2018 RTP]
Answer:
(i) Analysis of the “Results” dimension of performance as per the Fitzgerald and Moon model
Financial Performance of Learning Horizons and Knowledgebase:
The original budget had been prepared for 8,500 students, while actual enrolments are 7,850 students. At the very onset, reasons for lower enrolments have to be found and analyzed. For comparison of actual and budget, the budget of Learning Horizons has to be flexed to scale. Hence the budget needs to be scaled down to 7,850 for preparing a variance analysis.
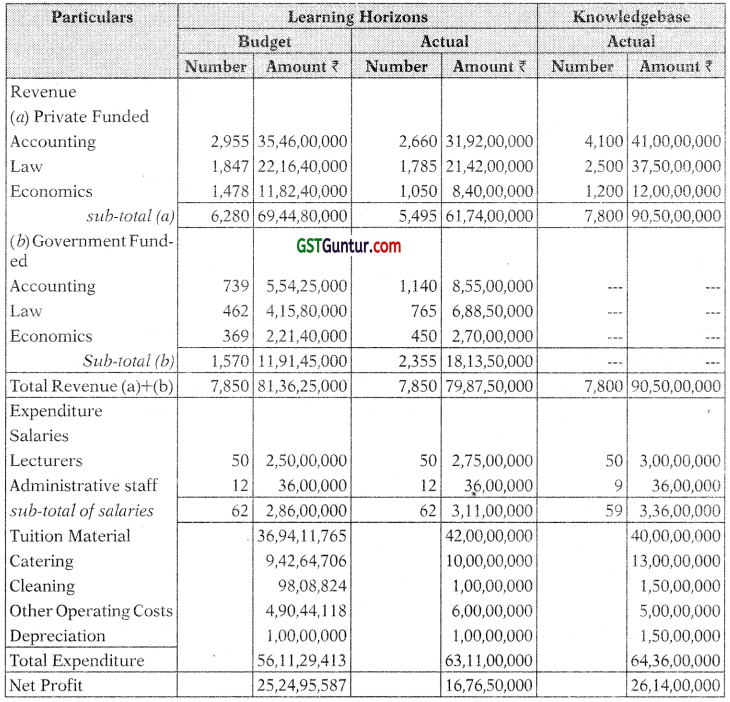
(1) Original revenue budget is for 8,500 students. Actual enrollments are 7,850 students. For comparison, the budgeted revenue has also been adjusted to 7,850 students. The mix between private and government funded students is 80:20 as per the budget. The adjusted student strength is allocated between the courses based on the original budget student strength.
For example, out of the total strength of 7,850 students, based on the budget ratio, 8096 are taken to be privately funded. This works out to 6,280 students. The strength for flexible budget for accounting course will be = (6,280 × 4,000/8,500) = 2,955 students. Likewise, the strength for flexible budget for other courses is calculated in a similar manner.
(2) The budgeted expenses are for 8,500 students. Actual students are 7,850. For comparison, variable costs in the budget have been adjusted for 7,850 students. Fixed costs remain the same. For example, tuition material has a budget of ₹ 40 crore for 8,500 students. This is 10096 variable, therefore adjusted budget for 7,850 students would be ₹ 40 crore /8,500 × 7,850 students. The total budgeted cost for 7,850 students is therefore 37 crore.
Semi-variable costs in the budget, are separated as fixed portion and variable portion for the purpose of recalculation. For example, catering cost is ₹ 10 crore for 8,500 students, of which ₹ 2.5 crore is fixed. The balance ₹ 7.5 crore is for 8,500 students are is variable. The budgeted cost per student is therefore ₹ 8,823. For 7,850 students, the variable cost works out to ₹ 6.93 crore. Adding the fixed cost, the total budget for catering for 7,850 students is ₹ 9.43 crore.
Likewise, the budgeted cost for cleaning and other operating expenses is calculated in a similar manner.
Analysis of Actual Financial Performance with respect to Budget
(a) Originally the student strength was expected to be 8,500 in comparison to an actual number of 7,850. The reason for this shortfall in enrollment should be analyzed by looking into non-financial performance measures.
(b) On the revenue side, actual revenue of ₹ 80 crore is marginally lower than the adjusted budget of ₹ 81.4 crore. Since the budget and actual course fee rates are the same, the reason for this difference is on ac’ count of the mix between the private and government funded students. Actual enrollments had a greater ratio of government funded students, for which the fees are lower. As per the flexed budget, government funded students were expected to be 1,570 versus an actual of 2,355, higher by 5096. Reasons for the change in student mix from a budget of 80:20 to actual mix of 70:30 has to be analyzed.
(c) On the expenditure side, actual costs of ₹ 63 crore is 1296 more than the corresponding budget of ₹ 56 crore. The increase for salaries over budget is because a higher market rate that has to be paid for a lecturer. Given that Knowledgebase also pays a higher rate, the budget may need to be amended to reflect a more realistic salary rate. The other major variance is on account of the tuition materials procured for the students. While the budget for 7,850 students is only ₹ 37 crore, the actual expenditure is ₹ 42 crore. Reasons for this large variation has to be analyzed. Reasons could reflect the quality of education imparted. If in reality better quality study materials costs more, the management has to decide whether they would be willing to incur this additional cost. This might have a further impact on the fees charged to privately funded students and the management may also want to ask for increase in the government sponsored fee rate.
(d) Overspend is noticed in other operating costs as well, actual cost is ₹ 6 crore versus ₹ 4.9 crore budget. As mentioned in the problem, 75% of this cost is fixed in nature, amounting to ₹ 3.75 crore (75% of ₹5 crore original budget). This portion of the cost should remain the same irrespective of variation in student enrolments. The remaining portion of the budget ₹ 1.15 crore is variable. The actual spend is ₹ 6 crore, of which ideally ₹ 3.75 crore would be fixed. If there is any variation in fixed cost, it should be looked into. If justified, future budgets need to be adjusted to reflect the higher cost. The remaining variable portion should also be analyzed to understand the reason for the higher spend.
(e) Overall, the impact of lower revenue and higher cost, has resulted in a shortfall of ₹ 8.48 crore (34% shortfall) as compared to the adjusted budget for 7,850 students. Action should be taken by further studying other parameters like competitor’s performance and other non-financial factors like quality of education, pass rate, innovation.
Competitive Performance of Learning Horizons and Knowledgebase.
The average revenue and cost per student for Learning Horizons and Knowledgebase are as below:
Average Revenue and Cost per student
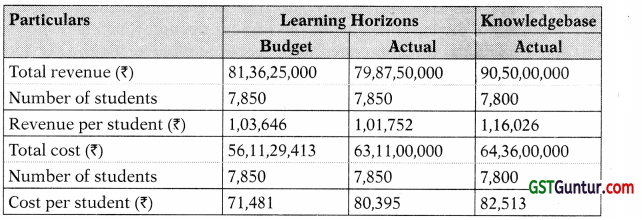
The cost per student at Learning Horizons is marginally lower than Knowledgebase. However, the revenue per student at Knowledgebase is much higher. Analyzing the components further
(a) Student Mix: Knowledgebase has higher revenue by more than 10 crore, almost 13.3% higher compared to Learning Horizons. Reasons could be on account a higher fee rate structure at Knowledgebase as compared to Learning Horizons, where part of the fee structure is government funded at a lower rate.
(b) Course Rate: Learning Horizons charges ₹ 1,20,000 per year for its accountancy course which is higher compared to Knowledgebase’s rate of ₹ 1,00,000 per year. This might be a reason for a higher enrolment at Knowledgebase of 4,100 students compared to Learning Horizons enrolment of 3,800 for the same course. The management has to verify if this higher rate is sustainable.
(c) Course Rate: Learning Horizons charges ₹ 1,20,000 for its law course compared to ₹ 1,50,000 at Knowledgebase. However, despite being lower, the enrolment for the course is almost the same. The management has to look at non-financial parameters related to quality, in order to improve enrolments for this course.
(d) Course Rate: Learning Horizons charges ₹ 80,000 for its economics course compared to ₹ 1,00,000 at Knowledgebase. Consequently, it is able to have higher enrolment for its economics course.
(e) Compared to Learning Horizons, Knowledgebase is incurring ₹ 2 crore lesser on tuition materials. As pointed out earlier, Learning Horizons must try to find out reasons for its higher cost and try to economize on this expense, if required.
(f) Knowledgebase has been using freelance staff for 30 days in a year to keep its expenses lower. Therefore, although it has a higher pay scale for its lecturers, it uses a lower cost resource to meet its teaching staff requirements. Compared to 1 new recruitment by Knowledgebase, Learning horizons has 10 new recruitments, during the year. Knowledgebase has substituted any shortfall in teaching staff by hiring- freelancers during the year. At the same time, non-financial aspects like quality of education need to be assessed while using the service of freelancers.
(g) The other indicator of competitive performance, the take up rate, the rate of conversion of enquiries from prospective students into enrollments for the cpurse. Reference to the budget here is the original budget prepared for 8,500 students, which represents the capacity that Learning Horizons wants to achieve.
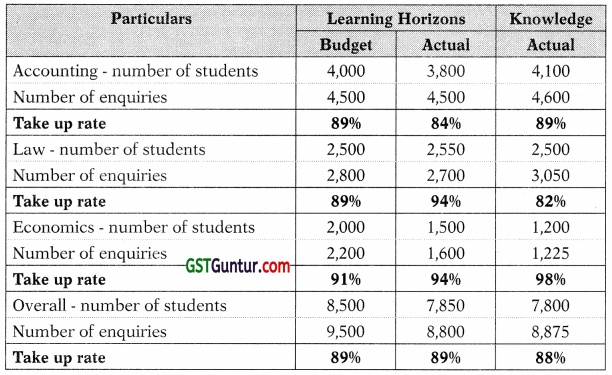
The take up rate is lower for accounting course at Learning Horizons as compared to Knowledgebase. As explained in point (b), this may be attributed to the higher rate that Learning Horizons charges privately funded students. The higher rate should be justifiable.
The take up rate for law is higher compared to Knowledgebase. As explained in point (e) this could be due to the lower fee rate. Higher enrolment could indicate the popularity of the course. At the same time the comparative pass rate may have to be looked into to judge the quality of the course.
The take up rate for economics is marginally lower than Knowledgebase. However, overall enrolment for this course is much higher compared to Knowledgebase, possibly to the substantially lower rate offered for the course. The management could look at better publicity to improve the take up rate.
(ii) Analysis of the “Determinants” dimension of performance as per the Fitzgerald and Moon model
Quality of Service
The pass rate for each course indicates the quality of course offered. Summarizing from the problem:
Pass rate
|
Learning Horizons |
Knowledgebase |
|
Budget |
Actual |
Actual |
| Accounting |
95% |
99% |
93% |
| Law |
95% |
98% |
90% |
| Economics |
95% |
95% |
95% |
| Overall Pass rates for the course |
95% |
97% |
93% |
The targeted pass rate of 95% has been met in all courses, thereby it indicates that a satisfactory level of education is being imparted. In comparison with Knowledgebase the pass rate for all courses is higher, which is a good indicator. This could be a reason to justify the use of full time staff instead of substituting it with freelancer staff.
In the case of accountancy, the management can use the higher pass rate to justify the higher course rate, which may lead to better enrollments for the course. In the case of law, it has the potential of becoming a very popular course, lower course fee with higher pass rate. This can be used to improve enrollments. Li the case of economics, the pass rates are at par.
The management may use the lower course fee to attract students else may find other ways to make the course more attractive to have higher enrollments.
Feedback from current students and the institute’s alumni also provide value information about the quality of the courses and opportunities to improve.
Flexibility
The management of Learning Horizons has to consider the feedback from current and prospective students in order to bring in flexibility to their services. While long distance learning offers some flexibility, the management has to look at alternate channels of delivery like online lecture support by faculty similar to the model that Knowledgebase has developed. Also, offering weekend courses could help improve enrollments. Providing the option to get an intermediate degree gives flexibility to students who are not able to cope up with the course. While this cannot be a main objective of the institute, it still can maintain its motto of imparting quality education for students of all backgrounds.
Resource Utilization
The main resource of an educational institute is its staff. Management of Learning Horizon has to look at the teacher student ratio and compare it to benchmarks of peer institutes. Learning Horizons is having a higher recruitment of 10 lecturers for the year as compared to a budget of 4 recruitments for the year. Reasons for the same need to be looked into. One reason could be a higher turnover ratio among lecturers due to lower salary paid in comparison to the market rate. In comparison, Knowledgebase has a more stable staff, having a recruitment of only 1 lecturer during the entire year. This might be due to the use of freelance teaching staff. Learning Horizon can explore options of using freelance teaching staff to meet its teaching needs, without compromising quality of education.
Innovation
From the information provided, Learning Horizons has a better quality of service in terms of pass rates. However, Knowledgebase planning to offer 6 new courses in the future. Learning Horizons has to explore options to improve on its current course offerings in order to maintain its market share.
(iii) There is a limit to fees sponsored by the government. Currently, government funded revenue is ₹ 18 crore, almost 23% of the total revenue of 80 crore. Average actual cost per student, referring to the table above, is 180,395. Since, the government is unwilling to spend more than ₹ 75,000 per student, the management could look at target costing methods to resolve this issue. This reduction of ₹ 5,395 per student can be achieved by identifying opportunities to economize on costs. If feasible, the cost per student can be calculated for each of the courses, to identify where these economies can be achieved. This drive should encompass the administration and support services too. Thus, using target costing approach, the cost can be reduced below ₹ 75,000 to make government funded education profitable, within reasonable limits.
Question 28.
Case Study (Building Block Model)
Bhalla & Singh LLP (BS LLP) is an accounting firm in form of limited liability partnership with 20+ branches across India, in all major cities. BS LLP offers to its customer services in accountancy, assurance, tax consultancy, business advisory services. Since the country is passing through economic slowdown, hence large numbers of business are entering into either internal/external reconstruction; resultantly advisory services are in huge demands. The industry of accounting practices in India is mature, despite some of statues enforced recently.
As part of performance analysis, at BS LLP; partners for each service domain collectively meet with top officers, on monthly basis. Following performance related data (belong to latest financial year) was considered in one of recent conducted partner meeting.
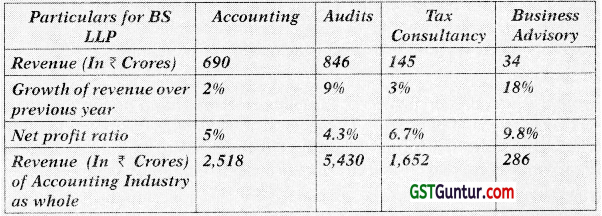
Remuneration structure at BS LLP
- Partners are getting fixed contractual payment apart from share in
- Non-Partners are getting fixed salary apart from variable pay depending upon rating from their immediate boss and peers.
Client Relation Officer who is working parallel to marketing team, first time participated in monthly performance evaluation meeting and presented following data which contain rating from clients of BS 4 LLP. It is decided that these rating will also he added in performance
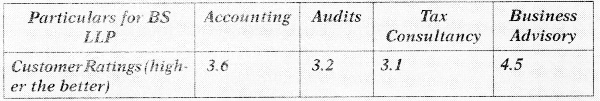
Required
YOH are newly appointed management consultant with experience in non-f nance performance evaluation techniques. During discussion at lunch table, managing partner (Mr. Singh) explain the above process of performance analysis to you. You quoted about your past experience of implementing non-financial performance evaluation techniques, including Performance Prism, Balance Scorecard and Building Block. Building block sounds interesting to Mr. Singh, he asks you to:
(i) LIST essential components of any performance management system.
(ii) DESCRIBE Building Block Model of performance management.
(iii) EVAL UATE theBS LLPs’existing performance management system from perspective of 3 essential aspects of Building Block Model.
(iv) ADVISE the main improvements that introduction of a Building Block approach can bring to BS LLPs’ performance management system.
Answer:
(i) Essential Components of Performance Management System
Performance management system which is considered as a key aspect of management accounting and must contain following components-
- Establishing functional and divisional organisation’s structure along with determination the level of decentralization.
- Establish responsibility centres and identify the person responsible for performance of each such centre.
- Establishing the system to identify KPI against which performance will be measure and establishing the yardsticks.
- Review system in order to compare the actual against standards and required corrective action.
(ii) Building Block Model
Building Block model of performance management is developed by Fitzgerald and Moon as a framework to improve performance measurement in service businesses.
The model suggests that performance systems should be based on three concepts:
dimensions, standards, and rewards.
Dimensions (these are critical success factor): There are six areas upon which company needs to focus in order to improve its performance. The model also suggests that the dimensions can be divided into two sets-
Results – Competitiveness & Financial Performance.
Determinants – Quality of Service, Flexibility, Resource Utilization and Innovation.
Note – Improvement in results can be ensured By improving performance in determinants.
Standards (these are key performance indicator): Second aspects of Building Block Model are to establishing the standards or determining the yardstick level. Model also suggests the three properties which must be possessed by performance measure, these properties are-
- Ownership,
- Achievability and
- Fairness.
Rewards: In order to encourage the workforce, so that they can achieve the standards established; model also suggests three properties which every reward should possess. These properties are-
- Clarity,
- Controllability and
- Motivation.
(iii) Evaluation of Existing Performance Management System
The existing performance management system at BS LLP doesn’t focus upon determinants specified by Building Block Model. Prima facie it is apparent from the performance matrix used by partners in their monthly meeting that performance is evaluated based upon financial performance only. Let’s evaluate existing performance management system further
Dimensions
The existing performance management system at BS LLP is allowing to consider the results in reference to:
(i) Financial performance – it measures net profit margin and change/increase in revenue over previous year and (ii) Competitive performance – revenue of BS LLP can be compared with industry revenue (segment wise) to calculate market share.
The matrix used by existing performance management system doesn’t contain j any major information from which performance level of determinants can ‘§ be measured. But recently at BS LLP customer rating is used, which can be taken as KPI for quality of service.
Standards:
Presently it seems BS LLP is measuring segment wise performance against performance of industry (based upon revenue) apart from measuring net profit and growth.
Ownership:
Since organisation structure is not clearly defined in the case above, hence ownership for each of dimension stated above can’t be identified in existing performance management system.
Achievability & Fairness:
In order to ensure achievability of standard established and fairness of same, presently it seems BS LLP is measuring segment wise performance against performance of industry (based upon revenue), whereas measure net profit and growth against standard established internally.
Reward System:
Although non-partners at BS LLP are getting variable component of their remuneration/rewards based upon their rating by immediate boss and peer, but the criteria of rating are not clearly defined and weight is also not mentioned for boss rating and rating by peer. If such criteria are not ration may cause de-motivation among staff.
Whereas partners are getting fixed remuneration apart from share in profit earned. Here in given case it is not clear whether profit of respective division or entity as whole, BS LLP. It is obvious that, if partners are getting reward based upon measure, which they can’t control they may be de-motivated. This may also not improve the performance of bad performing division, because they are also getting reasonable amount as share in profit due better performance by other departments.
(iv) Advise to Improve the Performance Management System
First and foremost, improvement will be consideration of all the dimensions of performance as per building block ensuring that all the critical success factors for performance should be measured. This will help BS LLP considering the importance of flexibility, resource utilization and innovation. Flexibility is important from the prospective from delivery of service, the manner and timing and of delivery.
Since staff is the key resource at BS LLP, hence essential it is to ensure optimum and effective resource utilization. In order to measure the productivity of the staff, hour charged as percentage of total available hour/total hour paid can be computed. This ratio will also signify the peak and off period.
Although the scope of innovation is not much available in accounting g firms, but still use of IT took can improve the utility for client. Moreover, innovation can be seen as offering new range and category of services.
Further, while identifying the parameter for evaluating performance; the Building Block model will help to set the standards against which performance is needed to be measured. Such standard should be achievable and fair, which should encourage the motivation among staff. Such standard may be financial and non-financial. Building Block Model will not only set the fair standard, but also help in establishing the mechanism that how such standard should be established.
Building Block will also help in reviewing the rewards system, in order to j motivate both Non-Partner Staff and Partners at SB LLP. Reward should be based upon those criteria for which worker is responsible or has control, so partner at SB LLP must get the share in divisional profitability and nonpartner worker must get the variable based upon their productivity (which < can be measure either by self-appraisal or 360° degree.
Question 29.
Case Study
Mrs. KMes is a retired dedicated mom taking care of her family and doing every bit to give the best of the upbringing to raise her son. Back in Mrs. Kates graduation days, career in accounting business and economics used to grow but there is a drastic change since those times.
It was then not so troublesome task to clear the graduation and get an alluring job. One could easily leap in and land up to a nice little 9 to 5 job as what we say. Life was easy as no one was busy. Records were all in the real physical books which were disappearing in modem tunes with the advent of internet and it is the Mac generation. Eyes were less strained and brain at placidity. No emails to check and no formalities to make. No exaggerations of staying late in office to get rewards and promotions. Moreover, people were easy to deal with, they had patience to listen till end and would react after giving a deep thought.
Days changed, months passed and went thereby a couple of decades when Mrs. Kates had a full-grown son, Mr. Dude needing to be admitted to a college in this rapidly changing and booming era. She wanted Dude to be in a college that had “history of good academics”, focusing on all round development of student, also meeting the needs of being flexible for a busy student life. She was low on her budget and therefore wanted someone or if the college itself could help her in financing the college education of her son. She was born and brought up in a small town called Doltapur and lived there all along her life. She was lucky to go on a 5 days tour outside of her country, visiting metropolitan cities of United States like New York and California. She was taken aback by the speed and transcendency of the states she visited. She wanted her son to learn some aspects of that life so that he could adjust with the fast pace and stride with passing time. Therefore, Kates started looking for education opportunities in her nearby city called Vilaspur which was just couple of miles away. There were two eminent colleges in the city each providing accounting, economics and taxation courses. Dude had Utile interest in economics, so Kates did not force him to jump in.
Dayawan College of Commerce (DCC) and Hridyam Commerce Institute (HCl) stood in direct competition to each other and met most of the characteristics expected of by Kates. She was excited to know about them and that they had a well renovated huge college campus where student outside of the city could stay and accomplish their education goals. The city was expensive and so were the colleges. Now she started pondering about the educational cost and began to seek sources that could lend her son educational assistance. To the much of her try she came to know from her close friends, that DCC took in students with weak financial standing but with strong academics. Actually, the college was named after the founder Dayawan Desai who was a great social activist of his time and during the last few years of his life he vouched to build a great co-ed college in his city for lower middle-class students who get left behind only because of their economic condition. The efforts from his history and the legacy created successful businessmen and women, tax consultants and economic scholars. HCI College on the other hand was also down to earth and did not bias among lower and higher class. They charged relatively low fees compared to DCC was popular among youth and gave great professionals who after their graduation from the college pursued further studies.
From last few years, many students were complaining about the rapidly increasing tuition rates, to which they went on a student strike demanding rate cut. Colleges had been very specific in relation to quality and touted that teaching fees and academic development cost had been increasing enormously which had to be substantiated by increase in costs of books and tuition. Failing all attempts, many students decided to switch to a mix of part time lectures and part time job through which college cost can be met and the burden on their families can be balanced. They required college to plan the class schedules innovatively so that students’ studies do not get hampered and at the same time they can continue their jobs. Both of the colleges were trying to come up with online courses and distance learning materials to assist their students in the event their student failed to attend any lectures. In addition, HCI is also planning on hiring additional freelancers to work with students during evening time to groom their skills and assist them do well in their studies.
The reward system of the colleges is not clear and there is less information on how teachers are being motivated to serve the students to the best of their interest. However, college image and brand totally depend on the efforts of the teachers/professors. The total revenue generated in the city from college business is around ₹ 500 lakh. The revenue generated by DCC in the most recent year is ₹ 180 lakh and by HCI is ₹ 110 lakh.
Dude developed a solidarity among his class friends and decided to go to DCC as this was the college where his other friends were wanting to go. However, Kates was concerned that Dude could spoil his career if he concentrated on picking things other than his studies. She wanted someone to guide her based on facts and figures of both the colleges so that an informed decision could be reached. She had modest savings from her job and wanted to spur her son to value those and understand the sheer importance of her precious student life which once gone will never be back. To harness all the information she had, and relying on your omnipotent knowledge, Kates went to you and provided you with facts (Annexure) about the two colleges.
In a nerve-racking voice, she remarked would you need any other information for your research to be extensive and serving my purpose? She continued, it was her serendipity to have gone through many troubles and find such detailed information and that she will try to gather more if she could. You in a calming and consoling voice said her that information was more than needed and it was really appreciative of her to pull in so much detail. It was all her love and care for her son that transpired on to the papers. She went by thanking you for considering her case and agreeing to help her son, Dude to make an informed choice.
Now you began contemplating of what could be done and exactly which models to be employed to get the job done and render a research driven analytical advice. After a day of pondering, you recollected of having learned the Fitzgerald and Moon’s “Building Block Model” and started to gather all the facts she provided. Now you gave a thought, that basically there are two questions to be answered for her enquires to be resolved.
Required
(i) Could ‘building block model’ be applied to her case and if yes EX-PLAIN the model in brief?
(ii) EVALUATE the performance of the two prominent colleges.
Annexure
DCC and HCI facts and figures for the most recent year 2019
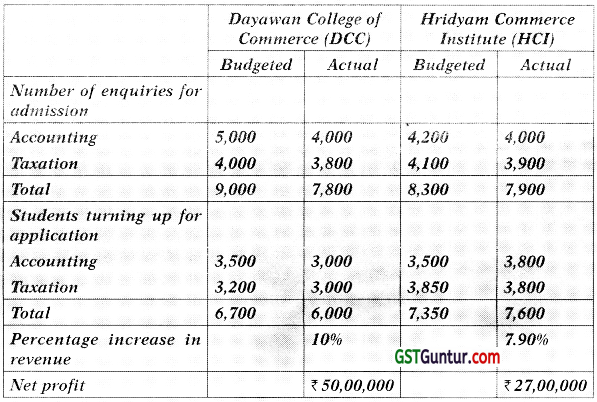
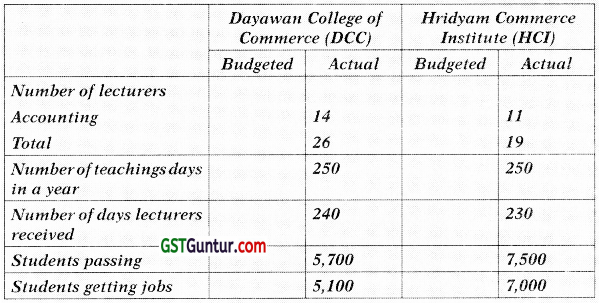
Answer:
(i) Fitzgerald and Moon’s building block model commonly known as building block model is a performance management theory model developed by Fitzgerald and Moon. This model has been built on the premise that service industries could employ this model to evaluate 5 their already in place performance standards and make hence forth g; improvements or could start from scratch building performance measurement criteria using this model. Since both colleges are engaged in f rendering educational services to students, they very well fall within the ambit of service industries.
This model is named as building block since it has been built on three blocks which are namely:
Dimensions
Think “Dimensions” as both financial and non-financial goals of any organization since both these goals serve as the factors critical for its long run success. Dimension commonly means attributes to be measured and here we measure two financial attributes and four non-financial attributes of any organization which can be enumerated below:
Dimensions
- Financial (Results): Competitive performance Financial performance
- Non-financial (Determinants): Quality Flexibility Resource Utilization Innovation
Standards
Think standards as targets that are to be achieved based on which performance attributes as listed will be measured. For the standards to be agreeable and acceptable by the concerned department or the responsible individuals, such standards must possess three features which are ownership, achievability, and equity.
Rewards
Think rewards as source of motivation that can drive the staffs to work wholeheartedly towards the achievement of set targets, so that the organization can successfully achieve both its financial and non-financial goals in the long run. Now the reward structure/system again should possess three qualities which are clarity, motivational and controllability.
(ii) Mrs. Kates wants us to evaluate two prominent colleges of Vilaspur city and come up with some conclusion. Going by the facts provided by Mrs. Kates it appears that both the colleges are doing well over all. However, the exact position of the colleges can be known from a detailed analysis of both qualitative and quantitative information available to us. This means we have to count both the financial and non-financial goals of each organization to precisely state how have been doing.
Financial performance can be measured by percentage increase in revenue and net profit margin. DCC remains the best performer on absolute revenue and profit although it performs so inadequately on other measures. This suggests that it may not be making the necessary investment in service and quality to satisfy the students’ needs,
Competitiveness can be measured bv relating number of students enquiring and finally turning up as an applicant, i.e. how successful the organization is at converting enquiries into applications. The take up rate for HCI is higher as compared to DCC. This could be due to relatively low fees charged by HCI.
This can also be assessed in terms of sales growth, market share and growth in customers. We cannot measure year on year growth for revenue and profit as prior year data is not available, but we can compare present market share which is greater for DCC.
Quality of college tutoring can be measured by relating number of students passing out of total students and then by comparing students getting job from total students passing. In this aspect HCl is a lot better college than DCC.
Flexibility means responsiveness to changed demand and here we notice HCI is planning to hire freelance lectures to help students during their evening time once they are off from their work. This aspect is really appreciative and suggests a farsightedness of the college management.
Resource utilization means the productivity of the service staffs and in this case, they are lectures/professors. This aspect can be measured using the relation between teaching days available and number of days actually served. DCC has higher resource utilization ratio compared with HCI.
On the other hand, we apprehend some form of staff shortage in HCI when considering the total number of students served in HCI comparative to DCC.
Innovation suggests coming up with new and innovative mode of service delivery in context with the changing demand/ environment. In present case we know that most of the students are working simultaneously to meet their college education cost. In regard to this situation, there is a need to bring in more online courses and distance courses, virtual classes so that time cannot be the barrier in learning. Both colleges are striving for the same and they stand in close competition as this regard.
Considering both the financial and non-financial goals of each college we can claim that HCI delivers a superior quality service, flexibility, making innovative attempts at comparatively lower price to meet the emerging needs of the students, which acts as a competitive edge over its direct competitor DCC.
Workings
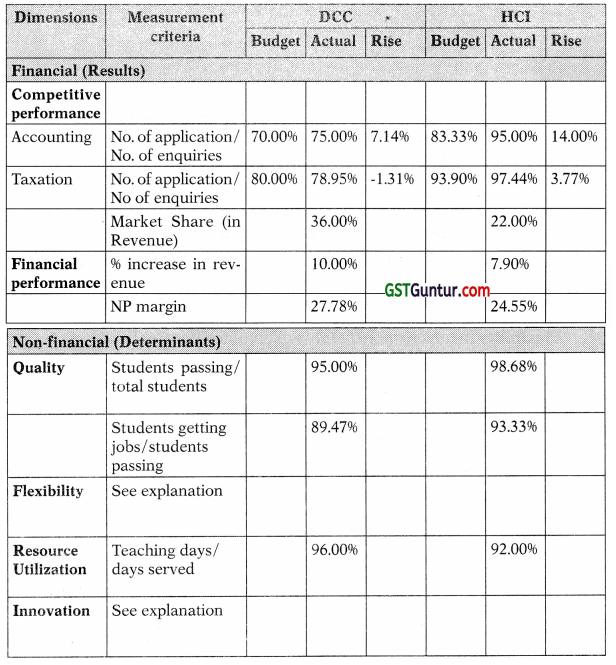
Note:
We do not get into discussing the standards and the rewards block of the model since Mrs. Kates was not able to provide much college information on these aspects.
Question 30.
Case Study (Performance Prism)
Galaxy Limited is in the business of logistics and distribution. In 2002, Galaxy limited had implemented Balance Scorecard as a performance measurement & management system. The balanced scorecard measures performance across Financial, Customer, Business and Innovation per-spective. The implementation of Balanced Scorecard had the following impact –
- The company’s financial performance improved substantially.
- The complaints from customers regarding poor service reduced.
- The company has pioneered in innovation in the field of door to door delivery of goods.
All these led to improvement in profitability of the company. The share prices are trading at life time highs. Since the ultimate objective of a commercial organisation is to maximise shareholder’s wealth, the CEO of the company is extremely pleased with the affairs at the company.
Of late, the company has witnessed high employee turnover ratio. Though the company has a formal exit interview process for the resigning employees, the inputs received from these interview is rarely considered in improving the HR practices. One of the common feedback from employees who left the company was that there is too much pressure to perform and improve | customer service without adequate support of systems and processes.
Also, the truck drivers who move consignment from one city to another have been on strike thrice in the last one year demanding better pay and working conditions. These drivers are generally hired on contractual basis. They are not entitled to any retirement benefits. The drivers have been insisting that they be taken as permanent employee and are given benefits applicable to employees of the company.
The above two issues were discussed in one of the board meetings. The directors wondered if they had the right performance measurement mechanism to address the issues. The company is doing great financially but must also ensure that the employees and other stakeholders are taken care of apart from shareholders. The board is also concerned that they have too much of data and reports to look at on performance management as the current measurement is done on a monthly basis. However, the alignment of such reports to the overall strategy of the company is missing.
Required
RECOMMEND an alternative performance measurement mechanism which considers all stakeholders instead of just shareholders and employees.
Answer:
Issue
Galaxy limited use Balance Scorecard to measure performance. Balance scorecard focusses on the financial, customer, business and innovation perspectives. The company has been doing great on financial parameters and customer satisfaction parameters. However, of late the company has been facing issues related to high employee turnover and dissatisfaction of the truck drivers.
The board of directors is also concerned about the volume of performance measurement data and alignment of performance measurement with the strategy of the company. An alternate performance measurement mechanism is Performance Prism.
Performance Prism
Performance Prism is considered to be a second-generation performance management framework conceptualized by Andy Neely and Chris Adams. The following are the factors which make Performance prism should replace the models like Balanced Scorecard –
- Organisations cannot afford to focus on just two stakeholder group Investors and Customers. Other stakeholders group like employees,
suppliers, government etc. should not be forgotten. This is important for sustainable growth of companies both profit oriented and non-profit oriented.
- Most of the performance measurement models do not focus on changes that could be made to the strategies and processes. The underlying assumption is that if right things are measured, the rest will fall into place automatically.
- Stakeholders expect somethings from the organisation. The organisation also must expect contribution from the stakeholders. There is a ‘ Quid Pro Quo’ relationship between the stakeholders and organisation.
Another problem highlighted by Andy Neely and Chris Adams was that i management are measuring too many things. They believe that in doing so they are controlling the organisations well. The problem with increased measurement is that the management starts micro-managing things and lose sight of the strategic direction. This negatively impacts the organisation in the longer run.
The performance Prism aims to measure performance of an organisation from five different facets listed below:
- Stakeholder Satisfaction
- Stakeholder’s Contribution
- Strategies
- Processes
- Capabilities
Stakeholder Satisfaction
The first facet of prism focuses on stakeholder’s satisfaction. Though balanced scorecard also focuses on stakeholder’s satisfaction, it is primarily concerned with the shareholders and customers and ignores other stakeholders. This is precisely the issue at Galaxy limited where the shareholders and customers are happy with the company, other stakeholders are not.
The company must identify all stakeholders and determine relative importance of each of the stakeholders. The company can use Mendelow’s matrix to identify key shareholders in terms of power and interest of stakeholders. A stakeholder group which has high power and high interest (say a trade union) must be kept satisfied. The key stakeholders for a company are:
- Investors – They want return on investment.
- Customers – They want good quality products at cheap prices.
- Suppliers – They want better price for products.
- Government – They want revenues and development.
- Society at large – They want employment opportunities.
Each of the stakeholders group exercise different level of power/influence on the company. The interest of each stakeholder group in the company also differs. Based on the power and interest of the stakeholders, the company must appropriately perform activities for stakeholder’s satisfaction.
After identification of the stakeholders, the company must identify the requirements of each of the stakeholders group. What must the company do to ensure stakeholder satisfaction?
Galaxy limited must ensure satisfaction of the two stakeholders highlighted above. The company must take steps to improve employee satisfaction and reduce the employee turnover. The company must also address the issues related to truck drivers and involve them in a dialogue. The impact of not keeping these stakeholders group satisfied is that the company might suffer financially in the longer run.
Performance measure – Employee Turnover Ratio, Average employment duration of employees, Number of strikes by truck drivers etc.
Stakeholders Contribution:
In the second facet of Performance Prism, the organisations identify the jg contribution required from the stakeholders. The organisations must then define ways to measure the contribution of stakeholders. This aspect is different from traditional measures where the organisations were just concerned with what they could contribute to the stakeholders.
The company would take steps to provide better service to its customers, In return the customers must contribute in terms of profits and revenues to the company. There is a ‘Quid Pro Quo’ relationship as described earlier, In case of Galaxy limited, the company could improve the employee satisfaction with better pay, training and growth opportunities. In turn, the j employees must perform better to contribute to the company as a whole. Similarly, the drivers must be given better working conditions and in turn, they should contribute towards improving efficiency and on-time deliveries.
Performance Measure – Efficiency of Employees, Productivity, On Time deliveries by Truck drivers.
Strategies
In the strategies facet of the Prism, the organisation should identify those strategies which the organisation would adopt to ensure that
- The wants and needs of the stakeholders are satisfied.
- The organisation own requirements are satisfied by the stakeholders.
After the company identifies strategies, the performance measures must be put in place to confirm that the strategies are working. The various aspects to be considered appropriate communication of strategies, implementation of strategies by managers and continuous evaluation of appropriateness of strategies.
Galaxy limited might come out with a strategy of to retain employees by means of better pay and growth opportunities within the company. This strategy can be called successful if the higher pay ensures that employees turnover is reduced. As a strategy, the company can start to hire drivers on the payrolls of the company.
Performance Measure – Number of employees leaving the organisation after getting pay hike, Efficiency of deliveries after Truck drivers are put on employment of company.
Processes
After identifying the strategies, organisations need to find out if they have the correct business processes to support the strategy. The various business processes can have sub-processes. Each process will have a process owner ^ who is responsible for functioning of the process.
The organisations must develop measures to evaluate the how well the | processes are working. The management must be careful to evaluate most S important processes instead of evaluating all the processes. Porter’s Value Chain analysis can be used to identify and evaluate various processes in the organisation.
Galaxy limited could devise a recruitment process which results in transparency in hiring and pay of employees. The process could be owned’ by the Human Resources Manager. The working condition of drivers can be improved by providing structured training and working conditions.
Capabilities:
Capabilities refers to the resources, practices, technology and infrastructure required for a particular process to work. The company must have right capabilities in order to support the processes. The company must identify performance measures to set how well the capabilities are being performed. While Galaxy limited might choose to increase the salaries of employees, an important question to answer is whether the company has financial capability to do so.
Conclusion
The facets of Performance Prism are interlinked and must support each other. The company must first identify the stakeholder wants and what the company wants from those stakeholders. The required strategies for these are identified and the processes to achieve the strategy followed by identifying the capabilities to perform these processes.
Question 31.
(Benchmarking)
PHL, South Asia’s premier express air and integrated transportation & distribution firm, offers a wide range of innovative supply chain services including Express Distribution, 3PL and Consulting. PHL offers innova-tive logistics solutions to its customers, enabling them to focus on their core competencies. The firm adds maximum value to businesses at every level, right from providing world-class warehousing support to ensuring time-definite deliveries of goods anywhere in Country ‘X’. The following information is available:
(1) Each warehouse of PHL is solely responsible for all customers within a specified area. It collects couriers from customers residing within ambit of its own area for delivery both within the specific area covered by the warehouse and elsewhere in India.
(2) After collections of couriers, a warehouse forward them for delivery outside its own area to the warehouses from which the deliveries are to be made to the customers.
(3) Therefore, each warehouse must integrate its deliveries to customers to include:
- couriers that it has collected within its own area; and
- couriers that are transferred to it from other warehouses for delivery to customers in its area.
(4) Each warehouse’s revenue is based on the invoice value of all couriers collected from customers in its area, irrespective of the location of the ultimate distribution warehouse.
(5) Each warehouse costs consist its own operating costs plus some allocated proportion including centralised administration services (i.e. salary, legal & professional fees etc.) and distribution centre costs.
(6) The management team and all employees of each warehouse are paid incentives which remains payable quarterly. The bonus is based on the achievement of a series of target values by each warehouse.
(7) Internal benchmarking is used at PHL as to provide sets of absolute standards that all warehouses are expected to achieve.
(8) The Annexure exhibit the target values and the actual values achieved for each of a sample group of four warehouses situated in City SG, City HK, City NY, and City NZ.
The target vaiues consist of:
(i) Warehouse revenue and profitability;
(ii) Courier delivery services and customer care; and
(iii) Credit period control and administrative efficiency.
Incentives are based on a points system. It is also used as a stimulus for each warehouse improving the operational effectiveness. One point is awarded in case where the target value for each item in the Annexure is either achieved/exceeded, and a zero point where the target is not achieved.
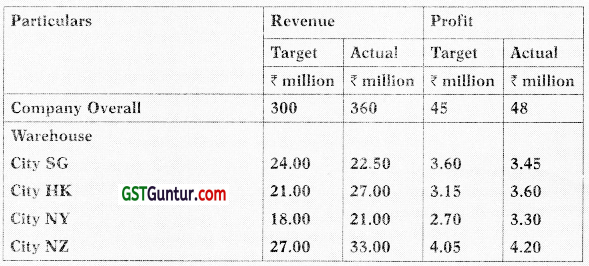
In order to calculate points of each warehouse, actual profit as a % of actual revenue must exceed the target profit as a % of target revenue. Courier Delivery Services and Customer Care
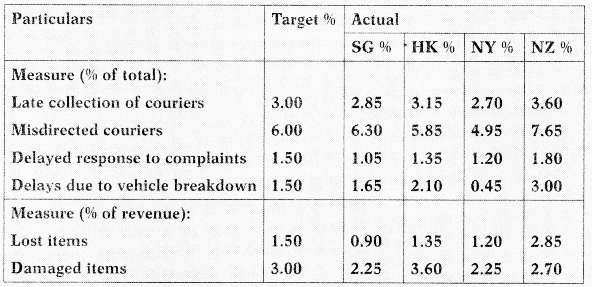
Note: PHI. operates ail year round.
Required
Prepare a report for the directors of PHL.
(i) ANALYSE the comparative performance of the four warehouses.
(ii) ASSESSEE PHL from perspective of financial performance, service quality, resource utilisation, flexibility, innovation, and competitiveness; and
(iii) EVALUATE the performance measurement system at PHL. [MAY 2019RTP]
Answer:
Report
To: The Directors of PHL
From: Management Accountant
Subject: Warehouse Performance
Date: 11th May 2019
(i) NY has achieved the best performance with (12) points. SG and HK have given a reasonable level of performance with (8) points each. NZ I is under performed earning only (4) out of the twelve points.
NY is the only warehouse which has achieved both increased revenue and increased profit over targets.
In the courier delivery services and customer care, NY has achieved all (6) of the target standards, SG (4); HK (3). The data of NZ indicates, the need for investigation due to achievement of only (1) out of six targets.
In respect of the credit control and administrative efficiency, HK and NY have achieved all (4) standards and SG has achieved (3) of the four standards. Once again, NZ is the ‘bad performer’ and achieved only (2) of the four standards. (Refer points table)
(ii) The terms mentioned in the question might be seen as representative of the dimensions of performance. The analysis of dimensions may be translated into results and determinants.
Results are the outcome of decisions and actions taken by management in the past. Measurement of the results may be done by focusing on financial performance and competitiveness. Financial performance may be measured in terms of revenue and profit as shown in the points table. The points system shows which warehouses have achieved or exceeded the target. Besides, liquidity is another criterion for the measurement of financial performance. The total points in table showed that HK and NY warehouses appear to be the best performer in aspects of credit control. competitiveness may be assessed in terms of sales growth or in terms of market share or increase in customers etc.
The determinants are the factors which may be seen to contribute to the achievement of the results. In other words, Determinants refer to the forward-looking dimensions of Fitzgerald and Moon model, for example- what areas of future performance are most important for PHL to achieve positive financial and competitive results? Quality, resource utilization, flexibility and innovation are the determinants of future success and they are also the contributors to the achievement of competitiveness and financial performance.
In PHL a main quality issue seems to be courier delivery services and customer care. Points table shows that the NZ warehouse has a major problem in this area and achieved only (1) point out of the six available.
Resource utilisation for PHL is critical to its financial success and may be measured by effective and efficient use of drivers, vehicles, and financial resources. To some extent, such measurement can be seen in the data relating to courier delivery services and customer care. For example, the reason of late collection of couriers from customers may be a shortage of vehicles and/or drivers. Such shortages might be due to sickness, staff shortage, problems of vehicle availability, vehicle maintenance etc.
Flexibility may be an issue like varied range of service as to meet different segment of customer is unavailable. Possibly, a short-term sub-contracting of vehicles or collections or deliveries may help in overcoming late collection problems.
The points table i.e. ‘target vs. actual’ may be considered as an example of innovation by PHL. This gives a comprehensive set of measures providing an incentive for improvement at all warehouses. The points table may demonstrate the extent of achievement or non-achievement of PHL strategies for success. For instance – the firm may have a customer care commitment policy which identifies factors that should be achieved on a continual basis. For example, timely collection of couriers, misdirected couriers re-delivered at no extra charge, prompt responses to customer claims and compensation for customers.
(iii) The performance measurement system used by PHL is simple to use. However, it may be looked upon measuring the right things since the specific measures used in points table encompass a range of dimensions designed to focus the organization on factors essential for PHL’s success and not restricted to traditional financial measures.
At PHL, internal benchmarking has been used to provide sets of absolute standards that all warehouses are expected to achieve. This will help to ensure a continuous focus upon the adoption of ‘best practice’ at all warehouses. Benchmarks on delivery performance give importance to quality of service whereas benchmarks on profitability i.e. target profits focus solely upon profitability.
Incentive schemes have been used at PHL, linking the achievement of firm targets with rewards. It might happen that the profit incentive would act as a booster to each warehouse management team. However, what is required for the prosperity of PHL is a focus of management on the determinants of success rather than the results of success.
Workings
Warehouse – Points Table
for the year ended 31 March 2019
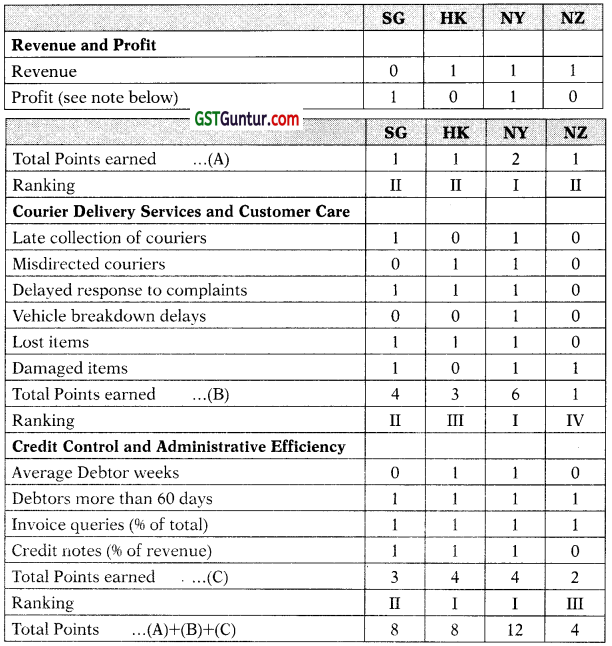
(a) Profit Points Calculation
Actual Results e.g. SG = 3.45/22.50 = 15.3% (1 point); HK = 3.60/27.00 = 13.3% (0 point)
(b) Debtors more than 60 days (96 of total)
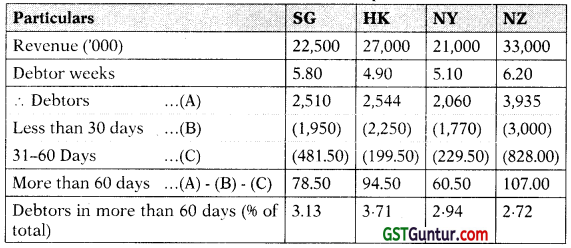
(c) Value of credit notes raised as a 96 of revenue e.g. SG = ₹ 67,500/ ₹ 2,25,00,000 = 0.30%
Question 32.
Case Study (Performance Measurement in the Not for Profit Sector)
West Coast community operates Homelessness Services (HS) on a not-for-profit basis as a local solution to local housing needs. The primary objective is to meet the accommodation needs of persons within its locality targeting those living in the low/middle income groups and senior citizens,
Accommodation is basically furnished; it consists of a small house, with kitchen, bathroom, bedroom/(s), and a sitting room. HS manages 450 such houses across various localities. Exclusive Services (ES) is a profit-seeking organisation which provides rented accommodation to the public. ES manages 200 such houses across localities similar to HS operations.
Income and Expenditure accounts for the year ended 31st March 2019 were as follows:
|
Hs (₹) |
ES (₹) |
| Rent Received |
1,02,98,600 |
1,09,98,000 |
| Less: |
|
|
| Employee Costs |
24,00,000 |
38,00,000 |
| Planned Maintenance and Substantial Repairs |
34,19,500 |
10,41,000 |
| Running Repairs |
23,91,600 |
6,38,000 |
| Miscellaneous Operating Costs |
15,27,500 |
11,75,000 |
| Insurance, Property Taxes, and Interest etc. |
13,15,500 |
18,75,000 |
| Operating (Deficit)/Surplus |
(7,55,500) |
24,69,000 |
Operating Information in respect of the year ended 31st March 2019 was as follows: House and rental information: .
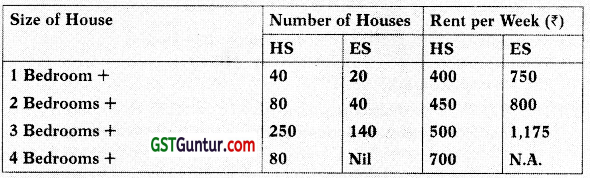
HS had certain houses that were unoccupied during part of the year. The rents lost as a consequence of unoccupied properties amounted to ₹ 18,17,400. ES did not have any unoccupied houses at any time during the year.
Employees were paid as follows:
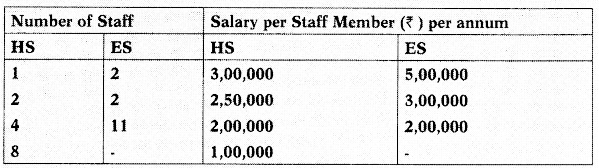
Planned maintenance and substantial repairs undertaken:
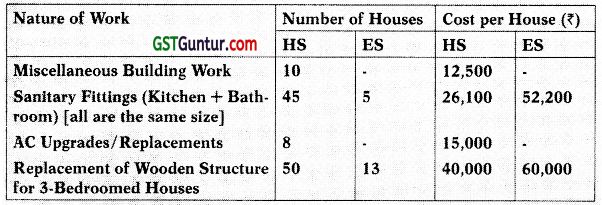
Running Repairs Information:
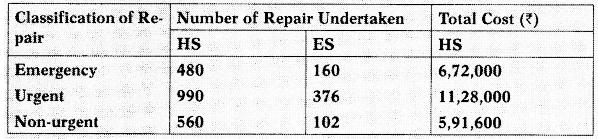
Each repair undertaken by ES costs the same irrespective of the classification of repair.
Required
(i) Critically EVALUATE how the management of Homelessness Services could measure the ‘Value for Money’ of its service provision during the year ended 31 March 2019. (10 Marks)
(ii) IDENTIFY, 2 performance measures in relation to Flexibility and Service Quality (dimensions of performance measurement). (4 Marks)
(iii) ANALYSE, 3 performance measures relating to ‘Cost and Efficiency’ that could be utilised by the management of Homelessness Services when comparing its operating performance against that achieved by Exclusive Services. (6 Marks) [March 2018 MTP; MAY 2018 RTP]
Answer:
(i) For commercial enterprises, generating profits is a very important objective. Likewise, not-for-profit enterprises have certain cultural, social or educational objectives for which they are created. Regard-less of the type of organization, it is important to know whether the internal operations meet certain performance benchmarks, that will ensure that the organization achieves its objectives in a better manner. Moreover, even if the organization does not operate for profits, it is important for it to be “cost effective”. Resources (including money) should be used optimally to achieve intended outcomes. For example,
HS can use this benchmarking tool to look into the following questions:
(a) Does the organization function in an efficient and cost effective manner?
(b) Does the estate management make best use of the buildings to achieve the objectives of the organization?
(c) Does the estate management function manage upkeep of buildings in terms of repairs and improvements in an effective manner?
(d) Are the tenants satisfied with the service provided by the estate management and the suitability of the accommodation for their needs?
“Value for Money (VFM)” is an assessment made based on the criteria % of economy, efficiency and effectiveness.
Economy involves minimising resource consumption while meeting specified requirements of quality and quantity. Minimize the cost of resources/required inputs (implies to spend less) while ensuring that the desired quality of service is achieved. For HS, inputs could be purchases made for maintenance and repair work like sanitary fittings, AC, wooden structure for the houses etc., while resources could be the labour employed to carry out these services. HS should aim at purchasing required quality of inputs at the least possible price. Skilled labour needed for this job should be procured at the lowest pay scale possible. Procuring these at lower cost leads to savings for HS. At the same time, HS should ensure that cost cutting/saving does not come at the cost of quality. Lower quality, implies inferior service levels, which ultimately will compromise HS social commitment to provide quality housing to needy members of its community.
Efficiency involves maximising the ratio between resources (input) | and the output of goods, services or other results.
The focus of efficiency is on the process of rendering service. The objective of efficient operations is to maximize output using minimum resources. Improved productivity means that resources procured are used in an optimal way (implies spending well).
In the case of HS, one of the resources is the labour employed for repair and maintenance work. Efficiency (productivity) measured would be the relationship between the employees available and the repair work performed by them. If the pool of employees do more repair work than the benchmark set, productivity is higher. This also closely ties up with economy (cost) of operations. If the given pool of employees (resources), who are paid optimum salary (cost), cater to more repair and maintenance work, economy of operations is achieved due to higher productivity of operations. In case these activities are outsourced, efficiency and economy can be achieved by calling for tenders. Select the tender that provides maximum work for least cost.
In addition, HS may explore options for efficiencies from business process improvements, shared services as well as further efficiencies with in assets management.
Effectiveness involves ensuring that the outcome achieves the desired policy aims and objectives. Have the objectives been achieved, how does the impact of the actual output/service compare with its intended impact? (implies to spend money wisely to achieve desired objectives). In the case of HS, effectiveness could be assessed based on the following questions
(a) Are the housing needs of the targeted community members met?
(b) Are the tenants satisfied with the accommodation?
(c) Given its social cause, are the staff friendly, courteous and hospitable to the customers?
(d) Do the housing accommodations comply with safety standards and other legal requirements?
Each measure is inter linked with the other. For example, HS has re-placed sanitary fittings in the kitchen and bathroom in 45 houses for ₹ 26,100 each, costing a total of ₹ 11,74,500. Compared to ES that has spent ₹ 52,200 on each house for sanitary fitting replacement. For the cost of ₹ 11,74,500 ES could have replaced fittings in only 22 houses (₹ 11,74,500/52,000) as compared to HS ability to replace fittings in 45 houses.
Therefore, HS decision has been economical, getting more work done for same cost. At the same time, this does not indicate whether the fittings replaced by HS are of similar or better quality as compared to ES. ES could have used better quality fittings that last longer, enhance customer experience, safety etc. The spending by ES could have been more effective than HS because it helps achieve the desired objective of customer satisfaction, safety and lesser running cost for maintenance. Therefore, to achieve economy, HS may have compromised on effectiveness.
Benchmarking is a good method of measuring performance it enables a comparison of the process, costs etc. with those of a close competitor. Services will be expected to use benchmarking information to learn from best practice, change procedures and processes to achieve enhanced methods of working, and reduce unnecessary expenditure.
However, benchmarking of performance against ES is not ideal. The performance of HS can be better measured by adopting benchmarking against similar charities whose primary objective is the provision of j accommodation to the communities in which they operate.
Thus, HS must have permanent membership of the House Bench-marking Organisations, which helps social housing property-owners to compare the costs of service delivery, resources, and key performance indicators across all areas of the business. For example, the management of HS can enquire about a norm in respect of the repair charges, sanitary charges or wood structure replacement charges etc. of similar non- profit seeking organisations.
Further, benchmarking should be conducted annually to analyse all areas of the business and is used to identify high performing, low cost services. Using the annual benchmarking exercise results, the HS can plan to target those areas that are low performing and high cost. Overall, HS should have strong commitment to value for money, which needs to be reflected in the business plan and in service-delivery plans, By applying these principles HS would be able to achieve the optimum utilisation of resources, which will in turn lead to extra capacity and allow HS to provide better services.
(ii) The Building Block Model proposed by Fitzgerald and Moon, gives six j dimensions of performance measurement including service quality and flexibility.
Service Quality
Service quality is the measurement of how well a delivered service conforms to the customer’s expectations. As a not for profit organization, HS provides housing services to cater to the needs of lower and middle income groups as well as senior citizens in the local community. Although service is provided at a concessional rate compared to its commercial peer ES, quality of HS’ service needs to be judged based on certain parameters that were promised by the organization to its tenants. These could be used as parameters to assess service quality. Some of them could be:
- Behaviour, attitude, proactivity of staff employed by HS.
- Quality of basic amenities provided.
- Availability of on-site service for the residents.
- Safety within and around the residential unit.
Data for assessment of quality can be collected from feedback of tenants, analysing the number and nature of complaints made by tenants, tenant retention rate/loyalty etc. Feedback form tenants can be taken on specific issues or could be general in nature.
Flexibility
Flexibility is the ability of the organization to adapt to customers’ requirements. This can be measured through service delivery time, promptness in responding to customer requests, ability of employees to perform different kinds of work etc. In the case of HS, the following performance measures can be used to assess the flexibility:
- The average waiting time for a tenant for a house to become available. Lower the wait time better the flexibility as it indicates that there are sufficient housing units available for rental accommodation.
- Following change in requirements, ability to meet the tenant’s re-quest for another house of a different size. This indicates whether the range of housing units offered is sufficient (flexible) to cater to the tenants’ changing demand.
- Waiting time for undertaking repairs of an emergency nature, once notified by a tenant. Lower the waiting time during emergencies indicates the availability of appropriate-personnel to carry of the repairs on short notice.
(iii) The management of HS could use the following performance measures
An organization should aim at achieving results with maximum efficiency at the least possible cost. Efficiency measures the relationship between the input resources utilized and the output service achieved. Few of the measures that HS could use to compare performance with ES are:
The Average Employee Cost per week per house
Here, the resource (input) are the employees, which is 15 in case of both HS and ES. The employees at HS cater to 450 houses as compared to 200 houses catered by ES. Therefore, HS is more efficient as compared to ES.
Likewise, cost of resources to HS is the employee cost, for which the pay structure and remuneration policies are different in both the organizations. HS has the ability to hire most of its resource at an annual salary of ₹ 100,000, which is the least level in the pay structure, Comparatively, ES also hires cheaper labour but at a slightly higherpay level of ₹ 200,000 annual salary. Therefore, the total cost of labour is higher by ₹ 14,00,000 (58%) for ES as compared to HS.
To compare the figures on a common factor, the employee cost can j be calculated per week per house.
|
HS |
ES |
The Average Employee Cost per week per house
[₹ 24,00,000^/(450@ × 52)] and [₹ 38,00,000^/(200@ × 52)]
^ Employee cost from the income and expenditure table
@ Number of houses (given): HS = 450; ES = 200 |
₹ 102.56 |
₹ 365.38 |
The average employee cost per week per house of ES is ₹ 365.38 (2.46 times) more than of HS. It can be concluded that HS is both efficient, in terms of being able to cater more houses with same number of employees, as well as cost effective due to the use of cheaper labour.
The Average Day to Day Repair Cost per week per house
Here, the resource (input) is measured in terms of the cost spent on repairs to maintain the rental houses. Running repairs are generally do not add much value to the rental houses. Therefore, lesser the repairs, higher the efficiency. From the income and expenditure table, it can be seen that HS has spent ₹ 23,91,600 as running repair cost for 450 houses versus ES that has spent ₹ 6,38,000 for 200 houses. To compare them on a common factor, the average repair cost per week per house has been calculated.
|
HS |
ES |
The Average Day-to-Day Repair Cost per week per house
[₹ 23,91,600^/(450@ × 52)] and [₹ 6,38,000^/(200@ × 52)]^ Running repair cost from the income and expenditure table @ Number of houses (given): HS = 450; ES = 200 |
₹ 102.21 |
₹ 61.35 |
The average day to day repair cost per week per house for ES is ₹ 40.86 less than that of HS (-40%). This may be due to the fewer repairs required and the fact that there is no extra cost required for emergency and urgent repairs. The cost of repairs whether emergency, urgent or non-urgent to ES is the same, ₹ 1,000 [₹ 6,38,000/(160 + 376 + 102)] whereas the cost of emergency repairs to HS is ₹ 1,400 (₹ 6,72,000/480), urgent ₹ 1,139 (₹ 11,28,000/990) and for non-urgent repairs it is ₹ 1,056 (₹ 5,91,600/560).
ES’s low cost of repairs (which is identical for all types of repairs – emergency, urgent and non-urgent) may have been achieved through entering into a contractual agreement for repairs. HS should also think of entering into such contracts in order to save money.
Percentage of Rent Lost
Occupancy of rental houses indicate whether the capacity (in terms of houses rented) is being optimally utilized. Lesser the vacancy better the efficiency in terms of capacity utilization. This represents opportunity cost of not letting out the property.
|
HS |
ES |
Percentage of Rent Lost (= Rent Lost/Gross Rent) [(₹ 18,17,400/₹ 1,21,16,000]
Gross Rent = Rent Earned + Rent Lost
= ₹ 1,02,98,600 + ₹ 18,17,400 = ₹ 1,21,16,000 |
15% |
— |
ES did not have any unoccupied properties at any time during the year; it has 10096 occupancy. This shows that ES’s properties are in high demand. On the other hand, HS has lost rent worth ₹ 18,17,400 through unoccupied properties; this is about 1596 of the gross rent receivable.
The management of HS should identify the reasons why the houses remained unoccupied when the occupancy rate is 10096 for an organisation like ES, a peer organisation should be used to benchmark the performance.
Question 33.
Case Study (Value for money framework not for profit sector)
The town of Sliver Sands is located along the coast of the Caribbean Sea. Known for its beautiful coastline and pleasant weather, the town attracts a lot of tourists from all around the worid. The town has two beaches that are maintained by the local government and can be used by the general public. In order to preserve the natural ecosystem, other beaches on the coastline are not accessible to the general public. Tourism is the main source of livelihood for its residents. Consequently, cleanliness of beaches is of paramount importance in order to sustain and develop this industry. The local government has recently employed a contractor to clean up the beaches using beach cleaning machines. The contractor has been selected through a competitive tendering / bidding process. The contractor uses sand cleaning machines that are pulled by tractors. Sand is scooped onto a conveyor or screening belt. It is either raked through (combed using prongs) or sifted through (filtered), in order to separate the waste from the sand. The cleaned sand is left behind on the beach while the waste is removed. Majority of the litter comprises of plastic waste (bags, bottles etc.) while some portion also includes sea weed, glass, aluminium cans, paper, timber, and cardboard. A detailed log is kept by the contractor about the stretch of beach that has been cleaned, time taken for the clean-up, number of tractors used etc. This log is also checked and signed by a local government official. This record is used to process payments at the end of the month.
In addition to contracting with the vendor to clean machines, the local government has also placed bins at various locations on the beach for the public to dispose their waste. The town’s municipality workers clean these bins every morning. Again, detailed logs of the man power and other resources employed is kept by the responsible department. In addition, the government has opened a mobile messaging system, whereby the public can message the government department if they find litter anywhere in the beach. Depending on whether it is from overflowing bins or buried debris in the sand, the municipality workers or the contractor will take action to clear it within 24 hours. A detailed log of these operations is also maintained. Patrons can also suggest measures for improving cleanliness on the beaches.
Due to its importance to the economy, the local government has allotted substantial budget for these operations. At the same time, it is essential to know if this is sufficient for the purpose of keeping the beaches clean Therefore, the government wants to assess whether the town is getting “good value for money” from this expenditure. The “value for money” concept can be looked at from three perspectives:
(i) economy, (ii) efficiency and (iii) effectiveness. The Internal Audit (IA) department that has been requested to undertake this study, has requested for guidelines on whether the audit should focus on economy and efficiency of the beach cleaning operations or on effectiveness of the same. Economy and efficiency audit assess whether the same level of service can be procured at lower cost or resources while effectiveness audit assess whether better service can be procured at same cost.
Depending on the outcome of the audits, if required, policy decisions like requesting for additional funding from the state government, alternate policy measures like levying penalty for littering etc. can be taken.
Required
Prepare a letter addressed to the IA department.
(i) RECOMMEND guidelines to assess economy and efficiency of beach cleaning operations. (6 Marks)
(ii) RECOMMEND guidelines to assess effectiveness of beach cleaning operations. (4 Marks)
(in) IDENTIFY challenges involved in assessment of effectiveness? (4 Marks)
(iv) RECOMMEND general guidelines, how the audit team may conclude the audit based on the combined outcomes of economy, efficiency, and effectiveness? (6 Marks) [May 2018 RTP/Oct 2018 MTP]
Answer:
1. Date 14- Oct -2018
Dear Sirs,
Re: The economy, efficiency and effectiveness of beach cleaning activities
(i) Economy and efficiency audit of an operation focuses on the consumption of resources and the output achieved. Economy assessees the financial aspects of the activity i. e. are the objectives of the activity being achieved at reasonable cost? Efficiency assessees the volume of input consumed to derive the desired output i.e. are the resources and funds being consumed to get maximum output?
To look at Economy of Operations, cleaning expenses need to be bifurcated into payments made to the contractor and the expenses of emptying waste from bins. Any further sub-categories of these expenses, like labour, material, disposal van expenses etc. also need to be collated from the accounting or cost records. These then have to be compared to the budgets that were approved by the government of Silver Sands. The competitive tendering process can be reviewed to ensure that the contractor getting the order is offering the required quality of service at the lowest price. If the quality of cleaning has been achieved, by staying within budget, the operation is economical. However, if the actuals exceed the budget, the government has to compare them with cost of similar cleaning activities carried by neighbouring towns. On comparison, if Silver Sands operations are expensive compared to other towns, it indicates that not only are the operations uneconomical they may not be efficient either.
Efficiency of Operations can be determined by checking the log records maintained for beach cleaning by the contractor and municipality workers. These would have detailed of activities carried out and the resources utilized for each of them. For each of these services (beach cleaning and emptying out bins), the cost drivers can be identified and certain metrics can be developed for analysis. For example, the cost of running the tractors can be divided by the total number of tractors operated to get the cost of operations per tractor or alternatively, by the kilometres of beach cleaned to arrive at a tractor-kilometre rate. While analysing these activities, certain operational considerations have to be given. For example, certain stretches of the beaches may take more time or resources to clean due to issues like rocks or soft sand. Therefore, if resources for operations disproportionate for certain parts of the beaches, the cost of maintaining those stretches need to be worked out. Data to get this information will depend on the extent of detailed maintained in the logs. This information has to be tracked over some period of time in order to understand trends in operations and related expenses.
The data collected from the mobile messaging system should also be investigated. How often and in what stretches of the beach are complaints frequent or maximum? Reasons for these lapses need to be taken from the contractor (for beach cleaning operation) and the concerned department (for emptying bins) in order to find out whether resources are being employed properly.
On this basis, deviations and exceptions should be investigated. The local government can then decide if there can be alternate sites along the coastline that may be more economical and efficient to operate.
(ii) An audit about Effectiveness of Operations would focus how the actual cleanliness of beaches compares with the desired level as laid out in the policy initiative. To assess whether performance has been met, clear guidelines and metrics have to be defined during policy implementation.
To begin with, it should be clear as to what constitutes litter. From an operational angle, it would be difficult to clean out every bit of paper lying on the beach. However, it is possible to pick up every soft drink aluminium can. Hence, the government authorities must be clear on what constitutes litter? Which are the refuse that must be cleared within exception (example food refuse, animal droppings, glass bottles, tin cans, trash bins etc.) and tolerance level for certain other types of litter (e.g. Paper, seaweed etc.) that may get left behind even after cleaning. Quantity of waste collected would be the indicator to make the above assessment.
Certain other parameters like safety standards can also be defined. Safety problems could be cuts from sharp objects like glass, incidents of vector borne diseases in the area or health problems from polluted sea water. Assessment has to be made whether these standards have been met.
For this, the primary source of information about cleanliness would be feedback from the beach patrons. These could be in the form of complaints received directly or those through the mobile messaging system would provide data to work out the metrics. This would be an indicator of “customer satisfaction”. Other inputs could also be the suggestions given by the patrons about ways to improve cleanliness on the beach.
Observation by making surprise visits to inspect the beaches immediately after the cleaning operations would also provide sufficient evidence about the effectiveness of operations.
(iiii) Challenges Involved in assessment of effectiveness would be:
(a) Defining standards about what constitutes litter and acceptable level of cleanliness? These are subjective guidelines, the percep-tion of which may differ from person to person.
(b) Beach patrons also play an important role in making this initiative effective. There has to be a conscious civic sense of duty not to litter, failing which this initiative will most likely be ineffective. Therefore, while measuring performance for effectiveness, col-lection of more litter does not necessarily indicate effective operations. More litter requires more cleaning and more resources, therefore is actually not a positive indicator of effectiveness. On the contrary, in the long run, lesser litter collected to maintain desired level of cleanliness would be a good indicator of effectiveness.
(iv) The outcome of the audits can indicate achievement any or none of the three parameters of economy, efficiency and effectiveness of the beach cleaning operation. To form an integrated conclusion based on the different outcomes of individual audits, the audit team may consider the following guidelines:
(a) Has the objective of the cleaning operation been achieved as per the guidelines in the relevant policy? i.e. have the operations been effective?
(b) If the answer to (a) is yes, are the expenses within budget. If so, then the operations are economical and efficient. Given that the operations have been effective at the same time economy and efficiency have been achieved, the team can conclude that the cleaning operations policy has been a success. A cost-over run can also be justified if the operations have been effective. In that case, the audit team has to conclude whether all expenses incurred are indeed justified and that the resources have been put to the best possible use. If not, can the operations be made more economical or efficient?
(c) If the answer to (a) is no, the operation has not been effective, then is the difference from the target marginal or huge? If the operations have not been entirely effective, but only by a marginal gap say 95% success, then analysis of expenses can be made similar to the point (b) mentioned above. However, if the operations have been ineffective to a larger extent, then the cleaning drive initiative has been ineffective. The government has to look at alternate solutions of tackling the problem. These could include imposing heavy penalty for littering, requesting for more funding from the state government to employ better resources etc.
Therefore, it can be seen that achievement of one objective does not automatically lead to achievement of other objectives. A holistic approach would be needed to draw conclusions about the performance of the cleaning operations.
Should you have any further queries, please do not hesitate to ask.
Yours Faithfully
Management Accountant
Question 34.
(Value for Money Framework Not for Profit Sector)
Cure Hospital is running under private-public-partnership (PPP) model – providing treatment for non-communicable diseases. ABCO Hospitals Limited is the private partner which runs a chain of hospitals on profit basis in major cities in India. The public partner is the State Government. Cure Hospital is a not- for-profit hospital.
Private partner is to invest in Upgrading and equipping the facility and responsible for operational management and service delivery. Government to provide physical space and other infrastructure in “as is where is” condition, provide support facilities and hospital amenities, Private partner assumes the entire responsibility, for a full range of investment operation and maintenance functions. Private partner has\the authority to make daily management decisions.
The hospital is funded to a great extent by the State Government and a fixed level of funding is received from the government each year out of the State budgetary allocation. It is up to the hospital to allocate this fund to different areas such as doctors and other staff salaries, medicines and all other costs required to run a hospital.
Cure Hospital’s objectives are:
- to give prompt access to high quality medical treatment for patients.
- to provide free treatment to poor patients in line with government policy of inclusive development.
- to provide value for money for the taxpayer-measured by the 3 Es framework of Economy, Efficiency and Effectiveness.
- to contribute to medical science by developing innovative ways to deliver treatment to patients.
Except select surgeries, all services are free for poor patients that are below poverty line (BPL) card holders. 40% beds are reserved for poor patients. Free out patient department (OPD) services to poor. CT Scan and MRI diagnostics are free for poor patients, subsidised rates for others. Cure Hospital also runs a generic medicine shop inside the hospital premises which sells medicines to all patients at discount ranging from 40% to 56% – the only shop of this kind in the city.
WHO has agreed to provide financial and technical support to the neonatal care unit The hospital enabled it to obtain five accreditation certificates from various leading authorities on different aspects of hospital management.
Feedback is taken from each in-patient about the quality of service provided by the hospital and the satisfaction level is taken in l to 10 pointscale. I being the least satisfied and JOrepresents totally satisfied. In a recent meeting of the managing committee of the hospital, discussions were held about inadequate performance measurement systems in place to assess whether the hospital is achieving its objectives and that insufficient attention is given to the importance of non-financial performance indicators.
A four member team consisting of a performance management expert and three senior doctors was created to give their advice in these aspects.
The four member team met with doctors, staff and other stakeholders at length and breadth. Some of the conversations were as below: Doctor A: I think the hospital always deliver value for money. We have always achieved our total financial budgets.
Doctor B: We work here much longer hours than doctors in other hospitals, often without being paid for working overtime.
Doctor C: There is not enough government and private partner funding to recruit more doctors and paramedic staff.
Doctor D: Number of out-patients has increased considerably. Earlier an out-patient had to wait for an average period of 2 hours 20 minutes and now the same has increased to 3 hours.
Senior Doctor K: I do not know how much time we spend developing innovative ways to deliver treatment to patients though, as most of the performance data we doctors receive relates to financial targets.
In-patient H: Incompetent paramedic staff, poor quality of food and bed linen. Staff M: Management undermines our role in running the hospital
Recent performance data of the hospital vis-a-vis national average are as follows:
|
Cure
Hospital |
National average of other PPP run hospitals |
| Number of doctors |
80 |
76 |
| Average doctors ’salariesper mon th including overtime |
₹1,20,000 |
₹ 1,60,000 |
| A verage doctors ’salaries including overtime as per budget |
₹1,20,000 |
₹ 1,25 000 |
| Number of in-patients treated |
8,360 |
6,369 |
| Average satisfaction rating of in-patients |
6 |
9 |
| Number of pa tien ts readm i tied for trea trnent of the same ailment within short period of time after discharge from the hospital |
627 |
128 |
| Average staff satisfaction rating (0% represents totally dissatisfied and 100% represents totally satisfied) |
16% |
86% |
| Number of out-patients treated |
76,212 |
63,318 |
Required
(a) EXPLAIN why non-financial performance indicators are particularly important to measure the performance of “not for-profit” organisations such as Cure Hospitals. (4 Marks)
(b) EVALUATE whether Cure Hospital is delivering value for money for each of the components of the value for money frame work.
(12 Marks)
(c) The CEO of the hospital intends to introduce a nominal fee for out-patient treatment given to poor patients and remove subsidised rate of CTScan and MRI diagnostic for other patients in order to achieve its objectives in a better way. EVALUATE the proposal of the CEO. (4 Marks) [Nov. 2019 Exam]
Answer:
(a) Cure Hospital has been formed in a public-private partnership to provide quality healthcare to the public, with focus on the poorer sections of the society. Healthcare service is provided for free, except for select surgeries. A sufficient portion of its capacity (hospital beds) is reserved entirely for Below Poverty Line (BPL) patients. Generic medicines are provided at a discounted price, to make them more affordable. World Health Organization (WHO) has decided to fund its neo-natal unit. With all this information, it can be summarized that Cure Hospital has been formed “not-for-profit” objective, attending to a social cause of providing quality healthcare to the economically poorer sections of the society.
Cure Hospital has been formed in partnership with ABCO Hospitals Ltd. and the State Government. The State Government has provided physical space, infrastructure, other support facilities and hospital amenities. ABCO Hospital, the private partner has the entire responsibility of taking care of allocation of funds, investment, operations, and maintenance functions. Daily management decisions are also handled by the private partner.
Since the Government has provided substantial funding and facilities to Cure Hospital, it owes a fiduciary responsibility of reporting the financial measures to its stakeholders, the government in this case. At the same time, financial measures alone are not enough to assess the performance of not-for-profit organizations. Due to its objective of public service, measurement of appropriate non-financial metrics are equally important. The reasons are:
(i) Benefits cannot be quantified: Cure Hospital essentially provides public healthcare service to the economically weaker sections of the society. Due to political, legal, and social reasons, not-for-profit organizations like Cure Hospital cannot be shut down merely for not being economically/financially viable. Therefore, financial measures are less relevant. Due to its non-financial objective, appropriate non-financial measures become more important. For example, the benefits of saving lives cannot be quantified in financial terms.
(ii) Benefits may accrue over long term: The expenditure incurred in one year may yield benefits over several years. For example, the investment in an Intensive Care Unit (ICU) facility may accrue of multiple years. Neonatal care unit have been given financial and technical support from WHO which will give long term benefits to hospital.
(iii) Measurement of utilization of funds and expenditure: In the case of Cure Hospitals, many hospital services are free, allocation of capacity is aimed at providing free service to the BPL section of the society, medicines are provided at discounted rates. There-fore, Cure Hospital does not have a substantial revenue stream to earn from its patients. It gets a fixed budget allocation from the State Government, while ADCO Hospital allocates these funds for various investments and expenditures. The assessment whether the spending have been appropriate is a key challenge. Defining cost per unit would be subjective since it could be cost of patients arriving at the hospital or cost of patients successfully treated at the hospital. Either figure could be tweaked to make it seem that the objectives are being met. The management may resort to rampant spending simply to meet the expenditure targets. Therefore, non-financial measure need to be put in place help stakeholders scrutinize whether the objectives for which funds have been given are being met.
(iv) Multiple objectives: Not-for-profit organizations have multiple objectives. It may be unclear which are the most important. Cure Hospital aims at providing high quality treatment to its patients while also developing innovative ways to deliver treatment to its patients. Both objectives are equally important and inter-related, Non-financial measures provide better information about how each of these objectives have been met.
The benefits of organizations like Cure Hospital are non-financial in p nature. Except for providing fiduciary information to the stakeholders, all other objectives of Cure Hospital can be measure only using non-financial measures.
(b) Value for money for Cure Hospital would comprise of the 3Es: Economy, Efficiency and Effectiveness.
(i) Economy: Has the desired output (and quality of service) been achieved at the lowest cost?
The medical resource at Cure Hospital in terms of doctors is 80, higher than the national average of 76 at other centers. Doctor’s salaries would be a significant expenditure for Cure Hospital. The average doctor’s salary at Cure Hospital (including overtime) is ₹ 120,000 per month, this is within the budget figure as pointed out by Doctor A. The salary is lower than the national average at other PPP run hospitals, where doctors earn ₹ 160,000 per month. Therefore, economy of money is being achieved at Cure Hospital.
The relatively lower levels of salary could be due to differences in levels of experience or that the doctors at Cure Hospital work overtime without getting paid (as pointed out by Doctor B). This may be one of the reasons why staff satisfaction is only 16% compared to 86% in other centers.
(ii) Efficiency: Has maximum output been achieved with the minimum resources?
Treating patients is the key objective of Cure Hospitals, while doctors are the main resource to deliver it. The number of patients treated per year is a good measure of efficiency achieved.
Cure Hospital treats 84,572 patients (in house patient 8,360 + outpatient 76,212) while the national average at other centers is only 69,687 (in house patient 6,369 + outpatient 63,318). Cure Hospital has 80 doctors as compared to 76 national average. Therefore, each doctor at Cure Hospital treats 1,057 patients (84,572 patients/80 doctors) as compared to 917 patients (69,687 patients/67 doctors) at other centers. Resource utilization of its pool of doctors is higher in Cure Hospital Doctor C mentions that there is not enough funding to hire more doctors and paramedic staff. Therefore, there is a constraint on the limited resources of doctors and support staff. This might be the reason, why each doctor at Cure Hospital works longer than colleagues at other centers.
Therefore, while efficiency in terms of number of patients treated by each doctor is high, there are other hidden costs that need to be taken into account. Few such costs could be low employee morale, higher waiting time of patients to receive treatment. This impacts the effectiveness of service provided.
(iii) Effectiveness: Has Cure Hospital achieved its mission or objective? Cure Hospital has the objective of providing high quality medical service to its patients. Better quality of treatment would ensure that re-admission for treatment of the same ailment within a short span of time would be minimal. Number of such re-admitted patients in much higher at 627 at Cure Hospital as compared to 128 at other centers. Assuming all such re-admissions to be in-house patients, this return of patients for medical care for the same ailment within a short span of time is 7.50% compared to the national average of 2.01%.
Prompt medical treatment can also be questioned since the waiting time of patients to receive treatment has increased from 2 hours 20 minutes to 3 hours.
Senior Doctor K points out the time spent on delivering innovative care to patients may be limited due to financial constraints and overwork staff.
All this would have resulted in dissatisfaction among patients, whose survey indicates a score of 6 against a national average of 9. This shows that objective of Cure Hospital is not being met effectively.
To summarize, Cure Hospital is achieving economy by maintaining lower salaries for doctors. Out-reach to patients is also high as compared to national average. However, due to limited availability of resources, doctors and staff are overworked. While it does well on the efficiency aspect, it comes with a hidden cost in terms of dissatisfaction among patients and employees and low quality of medical care. Therefore, medical treatment is not effective, which is an important aspect in the value for money framework.
(c) Proposal to introduce nominal fee for out-patient treatment given to poor people and remove subsidized rate of CT scan and MRI for other patients.
Cure Hospital is a not-for-profit organization that aims at providing quality health care to the economically weaker sections of the society. It gets its primary funding from the State Government. It does not generate and is not aimed at generating substantial revenue from its patients. The CEO has proposed to introduce nominal fee for out-patient treatment given to poor people and remove subsidized rate of CT scan and MRI for other patients. However, this would not help Cupe Hospital achieve its objective.
The given problem seems to suggest severe constraint in the resources available to meet its objectives thus impacting effectiveness of treatment. Each doctor treats 1,057 patients in a month as compared to the national average of 917 in a month. Number of patients, especially the out-patients is much more than national average. Overworked doctors combined with limited staff resources is the main hurdle that Cure
Hospital faces in effectively achieving its objectives. Cure Hospital is a not-for-profit organization. Therefore, generating nominal fees to achieve its objectives would not help its purpose. Instead, it can apply for higher budget allocation from the government.
This can help it procure good quality resources such as experienced doctors by paying them higher salaries including overtime. Better qualified doctors can help provide not just better treatment but also innovative ways of treatment to patients. Improved/enhanced facilities could reduce the waiting time for medical care, enabling prompt medical service.
Improved service would result in better treatment, lowering the cases for re-admissions for same ailment within a short span of time. This improves the effectiveness of medical care provided at Cure Hospital. Better service would improve patient satisfaction. Quality medical care would provide a better case for Cure Hospital to sustain its operations in the long-run. The State Government may also more favourably consider any justifiable future budgetary increments.
Overall, the management of the hospital seems to be indifferent to the opinions and needs of the staff. The CEO’s decision has a very short term outlook that does not co-relate with the organization’s objectives. By trying to off-set a limited revenue stream to achieve its objectives shows that the management’s style of working needs improvement. Conceptually correct brief explanation is sufficient for each step.
Question 35.
Performance Measurement in Not for Profit Sector
Olderhelp India is a leading charity working with and for the disadvantaged elderly for over 5 decades. Olderhelp advocates for their needs for universal pension, quality healthcare, action against elder abuse and many more. Olderhelp collects donations and funds and utilises them for the welfare of elders. The governing body of Olderhelp has setup four performance objectives for the three months to 30 Sep. 2020:
- to achieve a level of donation of ₹ 30,00,000
- to keep advertisement cost not more than 3% of donation
- to keep welfare cost more than 85% of donation
- to achieve 90% of respite care requested from the community
Actual results were as follows:
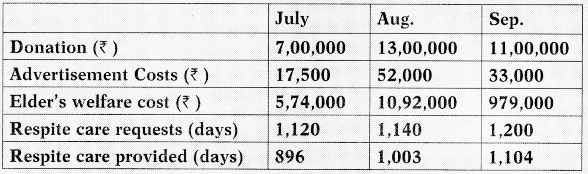
The aim is to serve elder needs in a holistic manner, enabling them to live active, dignified and healthier lives.
Requirement
Prepare a statement to assist the manager in evaluation performance against objectives and comment on the performance. [Nov. 2020 Exam; Oct. 2020 MTPj
Answer:
Statement Showing Performance
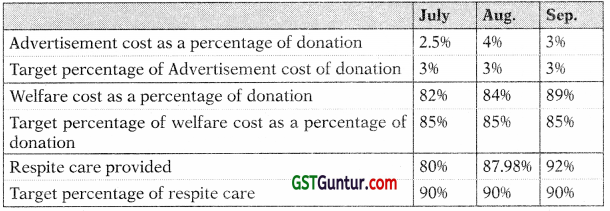
Comment
Total donation received ₹ 31,00,000 (= ₹ 7,00,000 + ₹ 13,00,000 + ₹ 11,00,000) have exceeded the target ₹ 30,00,000. Though there is no fix trend of receiving fund while it is noticeable that there were special fund raising activities in Aug. which generated highest receipt.
Advertisement costs have been within the target of 3% in July and Sep. but exceeded the target in Aug., more information is needed to establish why this occurred.
For the month of July and Aug. the welfare cost are less than the target, j while for the month of September Olderhelp have exceeded the target of expenditure of cost.
The improvement in the respite care provided by Olderhelp has been steady and for the month of September the target has exceeded.
Question 36.
The world fame Taj Mahal is situated on the banks of Yamuna River In the city of Agra, Uttar Pradesh, known for Its beautiful design and Is counted as one of the Seven Wonders of the World; the city attracts a lot of tourist from all around the world. The Tourism is one of the main sources of livelihood for its residents. Consequently, cleanliness and maintenance of garden area within the Taj Mahal campus is of prime importance in order to sustain and develop this industry.
The local government has recently employed a contractor to clean and maintain the garden area within the Taj Mahal campus. The contractor uses cleaning machines pulled by horses to avoid pollution. The contractor has been selected through an online competitive tendering/bidding process. Majority of the litter comprises of plastic waste (bags, bottles etc.) while some portion also includes glass, aluminium cans, paper and cardboard. A detailed log is held by the contractor about the waste that has been cleaned, time taken for the clean-up, number of horses used, etc. This log is also checked and signed by local government officials. This record is used to process payments at the end of the month.
In addition to contracting, the local government has also placed bins at various locations within the campus for the public to dispose their waste. The Nagar Nigam’s workers clean these bins every morning. Again, detailed logs of the man power and other resources employed are kept by the respective department. In addition, the government has- started a mobile messaging system, whereby the public can message the concerned department if they find litter anywhere in the campus. Depending on whether it is from overflowing bins or scattered waste, the Nagar Nigam’s workers will take action to clean it within 12 hours. A detailed log of these operations is also maintained. Patrons can also suggest measures for improving cleanliness on the above mentioned areas.
Due to its importance to the economy, the local government has allotted substantial budget for these operations. At the same time, it is essential to know if this is sufficient for the purpose of maintaining the cleanliness of the campus. Therefore, the government wants to assess whether the, city is getting, “good value for money” from expenditure. The “value for money” concept can be looked at from three perspective’s: (i) economy, (ii) efficiency and (iii) effectiveness. The internal audit department that has been requested to undertake this study has requested for guidelines on whether the audit should focus on economy and efficiency of the Taj Mahal campus cleaning operations or on- effectiveness of the same. Economy and efficiency audit assess whether the same level of service can be procured at lower cost or resources while effectiveness audit assess whether better service can be procured at same cost.
Depending on the outcome of the audits, if required, Policy decisions like requesting for additional funding from the state government, alternate policy measures like levying penalty for littering etc, can be taken.
Required
(i) RECOMMEND guidelines to assess economy, efficiency and effectiveness of Taj Mahal and campus cleaning operations.(8 Marks)
(ii) IDENTIFY challenges involved in assessment of effectiveness. (6 Marks)
(iii) RECOMMEND general guidelines, how the audit team may conclude the audit based on the combined outcomes of economy, efficiency and effectiveness. (6 Marks) Nov. 2020 Exam]
Answer:
(i) Economy, efficiency and effectiveness are three dimensions of value for money. Economy and efficiency audit of an operation focuses on the consumption of resources and the output achieved. Whereas effectiveness audit of an operations focuses on the comparison of outputs achieved with the desired level of output.
Economy
The Dimension of economy assessees the financial aspects of the activity i.e. are the obj ectives of the activity being achieved at reasonable cost?
To look at economy of cleaning and maintaining (of the garden area inside the campus of Taj-Mahal) operations, the cleaning expenses need to be bifurcated into different cost centres such as payments made to the contractor, the expenses of emptying waste from bins, and mobile messaging system. At this stage only the competitive ten-dering process may be reviewed to ensure that the contractor getting the order is offering the required quality of service at the lowest price, similar way bins are procured at lowest possible price etc.
Further sub-categories of these expenses into cost head such as labour, material, disposal van expenses etc. also need to be collated from the cost records. (This will help in comparison over a period as well).
Then afterwards, these shall be compared to the budgets that were approved by the local government of Agra. If the quality of cleaning has been achieved, by staying within budget, the operation is economical. However, if the actuals exceed the budgeted, then government shall make comparison of cost with cost of similar cleaning operation. On comparison, if found that cost incurred by Agra local government is more; then the cleaning operations are said to be non-economical and these may not be efficient too.
Efficiency
Efficiency assessees the volume of input consumed to derive the desired output i.e. are the resources and funds being consumed to get maximum output?
Efficiency of cleaning and maintaining operations can be determined by checking the log records maintained for cleaning operation by the contractor and municipality workers. These would have details of activities carried out and the resources utilized for each of them.
For each of these services (be it cleaning and maintaining garden or emptying out bins or mobile messaging system), the cost drivers can be identified, and certain metrics can be developed for analysis. For example, cost of cleaning per square metre of garden can be computed or cost of emptying each bin can be computed or cost to respond each call.
While analysing these activities, certain operational considerations have to be given. For example, certain stretches or corners of the garden (where landscaping structure is complex) may take more time or resources to clean. Cost of emptying and re-clean the bin used for dry and wet waste may be different. Therefore, if resources for operations are disproportionate for certain parts of the gardens, then multiple categories of garden shall be formed and cost for each category need to be worked out. But data to get this information will depend on the extent of details maintained in the logs. This information has to be tracked over some period of time in order to understand trends in operations and related expenses.
The data collected from the mobile messaging system should also be investigated. Frequency and area of the campus regarding which complaints are frequent or maximum? Reasons for these lapses need to be taken from the contractor (for cleaning the garden) and the concerned Nagar Nigam workers (for emptying bins) in order to find. out whether resources are being employed properly.
Effectiveness
As mentioned earlier that effectiveness of cleaning and maintaining operations would focus on how the actual cleanliness of garden area inside the campus compares with the desired level as laid out when budget was allocated. To assess whether performance has been met, the target.
To begin with, it should be clear as to what constitutes litter. From an operational angle, it would be difficult to clean out every bit of dry leaf (falling from tree) lying on garden floor. However, it is possible to pick up every plastic bag or bottle or empty soft drink can. Hence, the government authorities must be clear on what constitutes litter? and tolerance level for each types of litter e.g. tolerance level of aluminium can and dry leaves will be different, because few of dry leaf may left behind even after cleaning. Quantity of waste collected would be the indicator to make the above assessment.
Certain other parameters like safety standards can also be defined. Safety problems could be cuts from sharp objects like glass. Assessment has to be made whether these standards have been met.
For this, the primary source of information about cleanliness would be feedback from the patrons. These could be in the form of complaints received directly or those through the mobile messaging system would provide data to work out the metrics. This would be an indicator of “customer satisfaction”. The measure for can be how many mobile messages are responded within the time-cap of 12 hours. Other inputs could also be the suggestions given by the patrons about the ways to improve cleanliness.
Observation by making surprise visits to inspect immediately after the cleaning operations would also provide sufficient evidence about the effectiveness of operations.
(ii) Challenges Involved in assessment of effectiveness would be:
- Defining what constitutes litter?Jhcsc are subjective guidelines, the perception of which may differ from person to person. One can consider dry leaves that have been fallen from trees as litter other may not.
- Establishing the tolerance level of waste (litter) or acceptable level of cleanliness? High amount of subjectivity is also involved in determination of level.
- Frequency of cleaning and when to measure the effectiveness, it is obvious the cleanliness will not be at same level throughout the day.
- Certain forms of litter out of operational control such as animals’ or birds’ dropping, are they also considered as part of litter or ignored when effectiveness is measured. Basically, what matrix of desired objective contain is critical to determine the level of effectiveness.
- Indicator of effectiveness- There has to be a conscious civic sense of duty not to litter, failing which this initiative will most likely be ineffective. Therefore, while measuring performance for effectiveness, collection of more litter does not necessarily indicate effective operations. More litter requires more cleaning and more resources, therefore is actually not a positive indicator of effectiveness. On the contrary, in the long run, lesser litter collected to maintain desired level of cleanliness would be a good indicator of effectiveness.
(iii) The outcome of the audits can indicate achievement of any or none of the three parameters of economy, efficiency and effectiveness of cleaning and maintaining (of the garden area inside the campus of Taj-Mahal) operations. To form an integrated conclusion based on the different outcomes of individual audits, the audit team may consider the following guidelines:
(a) Has the objective of the cleaning operation been achieved as per the guidelines in the relevant policy or whitepaper (based upon which budget is allocated)? i.e. have the operations been effective?
(b) If the answer to (a) is yes, are the expenses within budget. If so, then the operations are economical and efficient. Given that the operations have been effective at the same time economy and efficiency have been achieved, the team can conclude that the cleaning operations policy has been a success.
A cost-over run can also be justified if the operations have been effective. In that case, the audit team has to conclude whether all expenses incurred are indeed justified and that the resources have been put to the best possible use. If not, can the operations be made more economical or efficient?
(c) If the answer to (a) is no, the operation has not been effective, then next question is
→ is the difference from the target is marginal or huge? If the operations have not been entirely effective, but only by a marginal gap say 95% success, then analysis of expenses can be made similar to the point (b) mentioned above. However, if the operations have been ineffective to a larger extent, then the cleaning drive initiative has been ineffective. The local government has to look at alternate solutions of tackling the problem. These could include imposing heavy penalty for littering, requesting for additional funding from the state government to employ better resources etc.
Therefore, it can be seen that achievement of one objective does not automatically lead to achievement of other objectives. A holistic approach would be needed to draw conclusions about the performance of the cleaning operations.
Question 37.
Case Study (Ethical & Non- Financial Considerations)
Nutty Bites produces many edible snacks that are very popular especially among children. Peanuts, Peanut oil are essential ingredients in many of its products. They are currently facing this ethical issue –
“Medical studies have indicatedpeanut allergic reactions are on the rise. The prevalence is more profound among children. Reactions can range from hives around the mouth to potentially life threatening reactions when exposed even to the slightest trace of peanuts. There is growing media campaign to force companies like Nutty Bites to make disclosure about the presence of peanut on its package labelling”
Nutty Bites is a mid-size company that has a growing market. Risk to peanut exposure can come not just from the presence of peanuts in its products. Some of its bought-in ingredients (raw material input) are cooked in peanut oil. There are risks of “cross- contamination” amongst products. Let us say, an equipment has been used produce cookies that has peanuts. Next, the equipment is used, without being cleaned, to produce chips that does not have peanuts as an ingredient. Some portion of the peanuts/ peanut oil could contaminate that specific batch of chips produced. Since labels of chips would not mention “peanuts” as an ingredient, it poses a potential risk of causing allergic reaction to a customer unaware of this contamination.
Management of Nutty Bites has called for a meeting to discuss this issue. “The issue need not be addressed at all. After-all Nutty Bites is doing nothing against the law” is the opinion of many members on the board of the company. *
Required
(i) EXPLAIN why Nutty Bites should attempt to address this issue.
(ii) STATE potential benefits that business can garner by addressing this issue.
(iii) RECOMMEND, with reasons, the avenues available to Nutty Bites to address this ethical issue.
(iv) EVALUATE the recommended solutions. [Nov. 2019 RTP; Nov. 2021 RTP]
Answer:
(i) Modern organizations have a moral duty of care to a wider range of stakeholders not just its owners/investors. In this case, it owes a duty of care to anybody who consumes its products. The presence of peanuts or peanut oil makes it a potential “health hazard” to some consumers. Food safety is a fiduciary duty that Nutty Bites owes to the society. Corporate Social Responsibility (CSR) is the duty an organization has towards a wider community.
(ii) Addressing this ethical issue will help Nutty Bites to become a morally responsible organization. The long-term benefits to its business could be as follows:
(a) Avoid bad publicity that could potentially damage its reputation and brand image.
(b) Avoid potential legal action for tort, committing a civil wrong.
(c) Operating environment within the business is more ethical, giving a sense of well-being to its employees.
(iii) Following could be some of the responses that Nutty Bites could take to address the issue:
(a) A clear warning in the ingredients box that the factory uses peanuts while manufacturing some of its products. This should be included even in products that do not contain peanuts, to avoid any harm due to risk of cross-contamination. Customers who suffer this allergy, would then be aware of the potential risk of consuming products of Nutty Bites. Protection from potential lawsuits counters any loss of business for Nutty Bites.
(b) Segregate areas to have separate processing lines for products with peanuts/peanut oil and those without it. If possible, have segregated staff for the two production* lines in order to avoid the risk of cross-contamination. If this is not possible, staff have to be well trained on the risks of cross-contamination. Gloves need to be provided while handling material during production of food products. This should be changed each time staff handle production changes from “peanut variety” to the “non-peanut variety”.
(c) Equipment should be thoroughly cleaned while switching pro-duction from one variety to another. Fewer changeovers in the production cycle, that is producing products in larger batches, reduces the number of switches during production of different varieties of food products.
(d) Storage of peanut material should be well segregated and monitored to avoid contamination.
(e) If Nutty Bites has the resources, it could invest in pharma companies that are finding a medical solution to this problem. The food industry could benefit from research and development of treatments to address this life-threatening allergy. A break-through would address a societal problem, while also having a positive impact for growth of Nutty Bites.
(iv) Risk of product safety is an important issue that needs constant re-view. Review would be of the production process, storage, material handling as well as ingredient of purchased raw materials. The benefit of constant review is that Nutty Bites can immediately identify danger of contamination. For example, is a supplier of raw material changes the production of the ingredients to include peanut/peanut oil, then Nutty Bites can be immediately aware of the change due to its review process. In case of any future litigation, Nutty Bites could defend itself by proving that it had a robust review process in place.
On the other hand, constant review requires time and money, with an ever-present possibility of contamination. It is not feasible to ensure complete safety. Reviewers/quality inspectors could become negligent once the process is well established. This could lead to instances of contamination, even with a review process in place.
To conclude, Nutty Bites is morally responsible to spread awareness that some of its products may contain allergy causing peanuts/peanut oil. It should streamline its storage and production process to avoid risk of cross-contamination.
Question 38.
Case Scenario (Ethical & Non-Financial Considerations)
Sprinter Sportswear is a multi-national company with that has a market i presence in 23 countries. Yet, the company does not own even a single factory. Production has been entirely outsourced to 175 factories locat- ed in places where cost of operations is low. Factories cater entirely to Sprinter’s procurement demands. These factories operate independently, Sprinter plays no role in their operations. Procurement from this supplier network is the stored at distribution centers from where dispatches are made to wholesalers of sportswear and apparel.
Recent news reports from some of the Third World foreign countries have (indicated that high child labour employment. Child labour although against the law in these countries is resorted in order to keep cost of operations low. Factories in these countries do not directly employ children. Instead they subcontract the work to contractors. These contractors in turn hire children illegally without the local knowledge of local law enforcement authorities. In addition, working conditions in these factories are very unhygienic and oppressive.
Sprinter initially turned a blind eye to this problem, since it only acts as I a customer of these factories. Sprinter, as a company, has done nothing illegal as part of company operations. However, increased focus given to corporate social responsibility, has forced the Board members to consider taking action against such factories.
Required
(i) DISCUSS why Sprinter sportswear should attempt to address this issue.
(ii) SUGGEST some of the actions that the company can take to address this issue. [Nov. 2019 RTP]
Answer:
(i) Work can be outsourced to locations to countries on the other side of the globe, in order to achieve low cost advantage. A company may not be directly responsible for faulty practices of its suppliers. However, modern organizations have a moral duty of care to a wider range of stakeholders who may not directly be related to the company. In this case, it owes a duty of care towards employees hired by factories within its supply chain. The issue it is dealing with relates to exploitation of child workers by factories, perpetrated by sub-contracting work to third party workers. While Sprinter sportswear has not done anything, illegal, it owes moral responsibility towards these children. Children have a right to education, because of which child labour is illegal in most countries. Since children are employed directly on account of the work that has been outsourced, Sprinter should attempt to address this issue. Also, any negative news about how its products are made, could impact its business.
(ii) Sprinter should aim to make its products responsibly. Some actions it can take are:
- Sprinter can develop a Code of Conduct that details the acceptable standards of conducting business. These standards could relate to hiring practices, of which it can specify that workers should be above a particular age to be employed for manufacturing a product. Others could relate to workplace environment, safety, and environment sustainability. Sprinter should insist that suppliers implement these Codes of Conduct along with other complying with laws. It should insist that the supplier be open to periodic inspection by Sprinter to ensure compliance with standards as per its Code.
- Sprinter can set up an audit teamthat regularly audits factories on the pre- sourcing and follow-up stages. Sprinter should do business only with those factories are complying with its standards. Any offenders to the Code of Conduct in the follow-up stages, should be appropriately be liable to penalty or termination of contract for serious offenses.
- Sprinter can list on its website location wise suppliers from whom it procures its products. It can even give information about products made by each of its suppliers, average age, worker diversity etc. This will enable watch groups to know who the suppliers are and warn the company if there are any labour issues within these factories.
Question 39.
Case Study (Ethical & Non-Financial Considerations)
Star Limited is in the business of manufacturing copper rods. The copper rods are sold to various cable wires manufacturers across the country. The growth in economy, especially the power sector, has led to a sharp increase in demand of cable wires and copper rods. The company is considering an opportunity to set up its own copper wire manufacturing plant and gain f a share of cable wire’s market. A detailed study was carried out to under- stand the market of cable wires, market growth, competitive landscape, financial feasibility etc. The Chairman has asked the Director of Finance to review the financial feasibility study and highlight concerns, if any.
The following paragraphs contain summarised information of financial study carried out:
- The project of setting up a new cable wire manufacturing plant is expected to yield a Met Present Value of ₹ 200 crores considering a project life of 20 years. The initial cost of setting up the plant is ₹ 500 crores which is readily available with the company. The project would yield an IRR of 17.5% which is higher than the IRR of other plants under operation.
- The plant would employ about 70% of labour on contractual basis, These labours would mostly comprise immigrants from neighbouring countries. The feasibility study has assumed that the immigrants la- hours would be paid 15% less wage than that paid to other workers. I However, the wage paid to immigrants would still be higher than the minimum wage requirements. The contribution to retirement funds is also not considered in the project evaluation. The company feels that immigrant workers would not stay beyond a period of a year and thus there is no requirement to contribute to retirement funds.
- The existing plants of the company do not have free space available and hence the company will need to buy land adjacent to its existing plant. A part of the proposed land to be acquired falls under the forest reserve area where no commercial activity is allowed. The company officials are in liaison with the government officials to get the land parcel approved. A certain amount of the value of land would be paid to certain government officials through a consultant. This cost is not a part of the project evaluation report.
- The new plant would also produce certain chemically harmful waste which would be disposed off into a nearby river after treatment. The company however does not have any technology to treat the waste fully. A new treatment plant would cost about t 100 crores.
The finance director has forwarded the entire report to you for comments.
Required
(i) LIST Various non-financial and ethical consideration in decision-making,
(ii) EVALUATE the impact of the various issues in the financial study and give your RECOMMENDATION.
Answer:
Issue
Star Limited manufactures copper rods and is considering commencing a new plant for manufacturing of cable wire. A financial evaluation has been carried out and the project appears to be financially viable. The project has a positive NPV of ₹ 200 crores and an IRR of 17.5%. Though the project is financial viable, there are certain concerns relating to the project.
Non-Financial and Ethical Consideration in Decision Making
Capital Budgeting or Investments decisions are generally made based on the various financial evaluation like Net Present Value, Internal Rate of Return, Payback Period etc. The financial considerations in capital budgeting | decisions are important because the end objective of every for-profit business is maximisation of shareholder’s wealth. However, an important aspect of capital budgeting is that investment decisions cannot be purely based on financial analysis; there are other soft non-financial aspects of the investment appraisal that need to be thoroughly looked into. Some of the non-financial considerations that a company factors for capital budgeting or investment decisions are listed below:
Environmental Factors
Environmental factors like pollution, deforestation, impact on climate and weather, greenhouse effects etc. must be considered by companies while selecting a project for implementation. Any project which adversely affects the environment is not taken positively by common public and environmentalists. A lot of projects have been stalled or delayed due to the protests by pro-environment groups leading to cost and time overrun. The government through ministry of environment could impose penalties on projects which are violating environmental norms or green norms.
Staff Motivation
Staff motivation and satisfaction is another important factor which companies might consider while choosing projects. If, for example, a company decides to implement automation in its plants for operations which would result in redundancy in labour, the overall staff motivation would come down, Staff and workers would resort to strikes and lockouts to protest against such decisions. The company should adopt a participative approach while taking such decisions considering the impact it would have on the labours.
Government Regulations
The companies must comply with relevant government regulations while % implementing projects. Some projects might be profitable and yield excellent returns. However, if the profits and cashflows are generated by violating government regulations, it could be harmful in the longer run for the company and its brand. The companies must ensure that all relevant laws and regulations are complied with.
Availability of Resources
The evaluation of any project must also consider availability of key resources like raw material, manpower, logistics infrastructure, electricity etc. If there is any constraint on any of the key resources at a future date, a financially viable and excellent project could well turn into a failed project. It is thus important that the requirements and availability of key resources are analysed in advance.
Availability of Project Site
Site selection involves measuring the needs of a new proj ect against the merits of potential locations. This indicates the practice of new facility location, keeping in mind proj ect requirements. A wrong or unsuitable proj ect location may mar the very benefits of a financially lucrative investment proposal.
Corporate Social Responsibility
Corporate social responsibility refers to “the ethical principle that an organisation should be responsible for how its behaviour might affect society and the environment”. The companies do not function in silos but are a part of the larger society and environment. They have a responsibility towards the society and environment to use the various resources judiciously and ensure a sustainable development. Companies are expected to uplift the well being of the society at large and to not harm the environment through operations. The aspects of corporate social responsibility must also be considered while deciding the project to be implemented.
Ethics
Ethics are a set of guiding moral principles for individuals and corporates. Every company has a duty of care to various stakeholders (shareholders, employees, suppliers, customers etc.). A company is expected to act in a fair and transparent manner and be honest in all its dealings with stakeholders.
Issues in the Financial Study
As discussed earlier, the project is financial viable with a very good NPV and IRR. The amount required to build the plant is also available with the company. Financially, the project must be accepted. However, there are certain non-hnancial issues which must be addressed before a decision to build the plant is taken.
Payment to Labour and Ethics
As explained earlier, every company has a duty of care to all its stakeholders and the stakeholders must be treated fairly. Labours are a key stakeholder for the construction and running of the plant. The company has chosen to pay 15% lower wage to immigrant workers and not contribute anything towards their retirement benefits.
The company is paying a higher wage to the labours than required by law and hence there is nothing illegal in such payments. However, the company must not discriminate between workers who are doing same nature of work just because the workers are immigrants. The reputation of the company might be affected because of the lower wages paid to immigrants. There is a possibility that these labours go on protests and strikes or decide not to work for the company.
The company has also decided not to contribute to retirement funds for these workers. This could have a legal implication as well. The financial impact of paying wages at par with other workers and contributing to the retirement fund for immigrant workers is not known. However, the company should reconsider this decision and pay all the workers the same level of wages. The company should also contribute to the retirement fund of employees.
Availability of land and bribery
The existing plant does not have sufficient space to build a new plant and hence the company is planning to acquire additional land which falls under the forest reserve area where no commercial activity is allowed. The company is in liaison with government officials to get the land acquisition approved. The company would also be paying bribes indirectly to the government officials to get the land allotment approved.
The payment of bribes to government officials, whether directly or indirectly would be unethical. The company could face litigation for acquiring land by unfair means and in future, there is a possibility of such allotments being cancelled. The company’s reputation would also be dented if news of bribery is published by the media. The company also has a responsibility towards the environment and must contribute towards a sustainable development. The society at large would not take acquisition of forest land by unfair means positively. This impact the overall goodwill and brand image of the company.
The company must evaluate if land at other sites can be acquired for construction of the plant. Such acquisition would be at a higher cost but would be beneficial to the company in the longer run.
Chemical waste and technology
The proposed plant is likely to emit chemically harmful waste which would pollute the environment. The technology available with the company can treat such waste partially. The company has to incur an additional cost of ₹ 100 crores to build a new treatment plant. This means that the NPV of the project would be reduced by ₹ 100 crores and IRR would also be lesser if the new treatment plant is built.
As discussed earlier, the company must operate in a socially responsible manner and consider implication of its action on the environment. The pollution caused by plants affects the surrounding environment and might lead to protests by local residents. Sometimes such protests are backed by NGOs as well. The commissioning of environmentally sensitive projects is difficult at times and can cause project delays as well.
The company should consider acquiring a new chemical waste treatment plant to ensure that there is no discharge of harmful waste from the company’s plant. Though, there is an additional cost involved in building a i new plant, it is important that the society at large perceives that the company is operating in a socially responsible manner. The company operates in a I society and is an integral part of it and hence, it has certain responsibilities towards the society as well.
Conclusion
The ultimate objective of a company is to maximise shareholder’s wealth. The company must, however, operate in a socially responsible manner in achieving the objective of wealth maximisation. The company has a duty of care to other stakeholders like employees, society at large etc. In some cases, there may be conflict between different stakeholder’s objectives. For instance, a new waste treatment plant would be good for the environment and society at large but would be adverse for shareholders as an additional cost of ₹ 100 crores would be incurred. The company must definitely consider non-financial factors along with financial factors while deciding on whether to build a new plant or not.
Question 40.
Case Study (Balance Scorecard; Linking of financial & non-financial measure performance)
Fair Limited manufactures and sells motor vehicles in India and different parts of the world. The company has its head office in New Delhi and three regional offices. The manufacturing plants are situated in Pune and Bhubaneshwar. The company has over 10,000 employees who are paid a fixed salary and a performance related pay (PRP).
The PRP is determined using the financial performance as a measure. The performance of departments which are profit centers is based upon the revenues and profits the departments generate. The performance of cost centers is based upon the cost savings against the budget.
Of late, the company has identified critical issues with the motor vehicles manufactured and sold in the market. In the last one year, itself, the company has recalled more than 2 lakh vehicles owing to quality issues like faulty gearbox, issues with axle, braking systems etc. The company was also penalized for selling vehicles which does not meet the emission norms.
The board of directors carried out an internal review of these frequent recalls and issues with the vehicles. In most of the cases, it appeared that the recall of vehicles was on account of lower quality of material and parts used. A couple of critical quality and emission checks were ignored to dispatch more vehicles in the limited time, leading to higher sales and profits. The board is concerned with the reputational risk with the issue related with recalls. The company was consumer’s most trusted brand for last three years in a row. It is unlikely to win the award this year due to negative feedback from customers. The board wants to win the trust of the customers back and be profitable as well.
Required
You are the advisor to the board* The board seeks your advice on the following aspects:
(i) STATE advantages and disadvantages of using financial measure as a performance measure.
(ii) ADVISE an alternative performance measure which includes non-fi- nancial measures as well.
(iii) IDENTIFY 2 critical success factors and 2 Key Performance Indicators for the performance measure chosen in (ii).
Answer:
What is the issue?
Fair limited is into manufacturing of motor vehicles. The company has used financial measures for performance. Of late, the company has faced quality related issues leading to vehicle recalls. The company has also been penalized for violating emission norms. Since the company has been using financial measures only, it appears that non-financial aspects related to quality have been ignored. The company has adopted the principle of profit at any cost which can be seen from use of low quality materials and parts as well as skipping key quality checks.
Financial Performance Measure
Financial performance measures focus on financial results or aspects. These . measures focus on the profits made by a business or a unit of business. They ; also include costs saved against budgets. Various financial performance indicators include – growth in revenue, profitability, variance from budget, Return on Capital Employed etc.
In the case of Fair limited, the performance of employees is done on the basis of financial performance indicator. When performance is evaluated on financial parameters, the employees and managers tend to focus only on profitability in anticipation of higher bonuses and pays.
The problems related to quality issues in vehicles produced by Fair limited might be linked to the use of financial performance measure. Low quality parts are used to save costs and improve profitability. The quality checks prior to sales were also skipped to sell more vehicles with limited resources, This is an apparent case of compromise in quality for seeking higher profits and revenues. In light of above, the advantages and disadvantages of financial performance measures are given below.
Advantages
- Focus on financial objectives and is linked to the overall objective of wealth creation of shareholders
- Such measures are objective.
- Quantification of results is possible.
- The measures are comparable across companies of a particular industry.
- The framework to measure financial performance is established in most of the cases.
Disadvantages
- Focus on short term profits and Ignores long term sustainable growth.
- As can be seen in the case of fair limited, the company has compromised quality for short term profits. This is harmful to the company in the longer run.
- This measure can be distorted by inflation. A 5% growth in sales might be good but if the inflation is 6%, the real growth is negative.
- Financial information might be manipulated to show a better performance.
Non-financial performance measures use measures other than financial to measure performance of employees and departments. The advantages of non-hnancial measures are :
- Non-financial measures help business to measures every area whether § financial or non-financial. Financial measure would not be able to S: suitably measure areas like performance of IT department.
- It focuses on qualitative aspects as well.
- These measures take a long-term view unlike financial measures where employees tend to take a short term view.
The disadvantages of Non-Financial measures are:
- These require huge amount of information to measure each area of performance and might lead to shift of focus from core goals and values.
- These can be subj ective as non-financial measures cannot be generally quantified.
- Non-financial measures like measures of quality are difficult to measure.
Balanced Scorecard
An alternative performance measure which focuses on both financial and non-hnancial measures is the Balanced Scorecard. It outlines four key areas :
- in which company and divisional performance should be measured to focus on both the short and long term needs of the organisation. The key idea is that managers are to be appraised on a variety of measures which include non-hnancial measures so that their focus is both long and short term.
- As discussed earlier, it appears that managers at Fair limited have ignored long term sustainable growth and qualitative factors and focused on short term profits and sales. This is one of the key disadvantages of a financial measure of performance. The company can start measuring performance both on financial as well as non-financial aspects. This would ensure that employees are not short sighted on profits alone.
The four areas or perspectives in a Balanced Scorecard are –
Financial Perspective
Financial perspective focuses on financial performance of the business and divisions. The various financial measures used by companies are profitability, revenue growth, cost control etc. This is currently being used in Fair limited to measure performance.
Customer Perspective
This perspective views organizational performance from the point of view the customer or other key stakeholders that the organization is designed to serve. These could include measures like customer sat-isfaction index, percentage of returns, percentage of goods delivered on time etc.
Internal Business Perspective
This perspective views organizational performance through the lenses g of the quality and efficiency related to product or services or other key f business processes. The measures under internal business perspective i could be number of defective products produced, production perfor- I mance per unit of time etc.
Training and Development/Learning and Growth Perspective
This perspective views organizational performance through the lenses of human capital, infrastructure, technology, culture and other capacities that are key to breakthrough performance. The key measures could be number of new products produced, amount invested in training and development etc.
In each category/Perspective, the organisation must follow through from the business strategy, to ensure they are focused on the longterm direction of the business. Clear objectives should be set under each category according the SMART criteria (Specific, Measurable, Achievable, Relevant and Time-bound), measured at the end of the period, and lessons learnt from actual results to help to improve performance in future periods and keep the organisation on track to achieve its strategic goals.
Applying Balanced Scorecard to Fair Limited
The issues related to quality have arisen at Fair Limited as the managers and divisions focused on profits at the cost of quality. The recall of vehicles was primarily on account of use of sub-standard parts. The company should consider using non-financial measures as well as a performance measure. Balance scorecard can be effective tool to apply financial and non-financial measure.
The company must take steps to put focus on quality related aspects as well as financial aspects. A proper application of various Key Performance Indicators under the respective Critical Success Factors can help the company overcome the current issue.
Critical success factor (CSF) is a management term for an element that is necessary for an organization or project to achieve its mission. It is a critical factor or activity required for ensuring the success of a company or an organization. These are the key areas in which the organisation has to do well if they are to remain competitive and profitable. The critical success factors have to be linked with the overall strategy of the organisation.
Key Performance Indicators (KPIs) are the ways in which the organisation’s se performance for the CSF can be measured. It is a measurable value that % demonstrates how effectively a company is achieving key business objectives. Organizations use KPIs to evaluate their success at reaching targets.
The Critical Success Factors and Corresponding KPIs for Fair limited for each of the perspective in the balanced scorecard is given below:
| Perspective |
Critical Success Factors |
Key Performance Indicator , |
| Financial |
- Be the Most Profitable Company in Motor Vehicle Industry.
- Become the No. 1 Company by in terms of Market Share in five years.
|
- Profitability ratios.
- Revenue growth.
- Variance to budget.
- Number of vehicles sold.
|
| Customer |
- Be No. 1 Choice of Customers.
- Implement Zero Recall Policy.
|
- Number of vehicles sold vis-a-vis those sold by competitors.
- Number of recalls of vehicles.
- On time delivery of vehicles.
|
| Internal Business |
- Total Quality Management.
- Zero Idle Time at Factory.
|
- Number of defective cars produced.
- Number of cars returned by customers as faulty.
- Number of hours spent in waiting tty labours at assembly line.
|
| Training and Development |
- Upto Date Technology used in Manufacturing Facilities.
- Skill Development for Labour and Supervisors.
|
- Amount spent in research and development year on year.
- Number of training hours undergone by workers and supervisor.
- Number of new model of vehicles launched.
|
Question 41.
(Critical Success Factor)
Osaka Tea Co. manufactures and distributes finest quality black tea to hotels, restaurants and retailers. The company has wide presence in tea market. It has become one of the largest premium brands. The customers are very happy with the finest quality of tea.
Osaka Tea Co. never compromise with the quality of the tea. The aim of the company is to deliver finest black tea to keep the customers happy. It has tied up with big tea estates for procurement of finest tea leaves directly from the estate for processing in its own plants. The tea leaves go through various processes like plucking, withering, brushing, oxidising, grading, drying, sorting and shaping etc. Then these are packed in beautiful plastic jars for distribution to the hotels, restaurants and retailers.
During the meeting of the management, it has been decided to reduce the price per kg by 5% to increase the volume of sales. The following variances pertain to last month’s operations, arose as a consequence of implementation of above decision:
| Sales Price Variance |
24,500 (A) |
| Sales Volume Variance |
20,600 (F) |
| Purchase Price Variance |
15,500 (A) |
| Labour Efficiency Variance |
14,300 (A) |
| Fixed Cost Expenditure Variance |
11,100 (A) |
Required
(i) IDENTIFY the ‘Critical Success Factor’ for Osaka Tea Co. (1 Mark)
(ii) EVALUATE the management’s decision with the ‘Overall Corporate Strategy ’ and ‘Critical Success Factors ’. (9 Marks) [Nov. 2020 exam]
Answer:
(i) Osaka Tea Co. manufactures and distributes finest quality tea. It is one of the largest premium brands, having wide presence in tea market. Therefore, “quality” is most critical success factor of Osaka. There are other factors which cannot be ignored such as price, delivery options, attractive packing etc. But all are secondary to the quality.
(ii) Osaka Tea Co. manufactures and distributes finest quality tea to hotels, restaurants, and retailers. It is one of the largest premium brands, having wide presence in tea market. It is important to note that premium brands are built on the premise of offering high symbolic value to a very selective segment of consumers that are more focused on high status associations than the underlying price, d In this case scenario adverse price variance indicates that firm has purchased raw 1 material ie. tea leaves at higher price which may be due to buying of finest-qualifity material to try to build strong brand image for its products in alignment with current strategy i e. product differentiation. Similarly, adverse Efficiency Variance T may have been due to following several processes which are taking longer time than normal to maintain the quality level. However, Osaka’s costs would rise, to substantiate this a premium pricing would be required.
It is also important to note that adverse sales price variance and favourable sales volume variance, indicates that market is price sensitive. However, the net impact of the same is negative on the profitability. Osaka then could no longer make a profit simply by pricing its products e.g. reduce the price per kg by 5%. Osaka is intending to expand its market to retail market and street shops by reducing the price which is opposing its current strategy.
In this scenario, it is important for Osaka to have a perception of exclusivity in alignment with present strategy. Therefore, management should monitor the trends of variances on regular basis and take appropriate action in case of evidence of any decline in quality (ie. Critical Success Factor).
Question 42.
Ethical and Non-Financial Considerations ABC Limited specializes in the manufacture of chemical intermediE a very competitive business environment. ABC is a public listed company, with majority of its shareholders being institutional investors like mutual funds, banks and insurance companies.
It is located in a water scarce zone in Tamil Nadu. There are restrictions on the tapping and usage of groundwater under the relevant laws. Penal provisions of the law will apply in case of violations. The production process requires water and the amount of water that the company can draw is limited to 19,000 kilo-litres (1 Kilo-litre is 1,000 litres). Purchase of water is not an option as availability is highly erratic and exorbitant on cost. The company manufactures two types of chemicals “A” and “B” and these are sold in kilograms. The company is in the process of making the business plan for the year 20YY.
Based on the actual operating data for 20XX and taking into consideration the inflation and possible price increases that it can obtain from the market, the following product costing details have been arrived at:
| Product |
A |
B |
| Capacity Volume kg. (not inter-changeable) |
8,25,000 |
9,30,000 |
| Selling Price per kg. |
₹ 2,000 |
₹ 1,000 |
| Variable Cost per kg. |
₹ 1,500 |
₹ 650 |
| Water (litre/kg.) |
12.5 |
10 |
Under the relevant income tax laws prevalent, companies with a turnover of ₹ 250 Cr. (Crores) or less are taxed at a lower rate of 25% as against the normal 30%. The company intends to keep its sales for 20YY equal to ₹ 250 Cr. or slightly lesser to avail this concessional income tax benefit. With capacity constraints, the company has calculated that It would be still beneficial for the company to stick to ₹ 250 Cr. as only a marginal increase in turnover is possible over ₹ 250 Cr.; after a higher tax @ 30%, the PAT would be still lower than the PAT arrived at after doing just ₹ 250 Cr. and availing the lower income tax rate.
CFO asked management consultant to work out the volumes in kg. of products “A” and “B” which would give an optimal (maximum) contribution given the constraints on capacity, water usage and turnover to avail the concessional income tax benefit.
Consultant work out with the following product mix using linear programming. She also proposes another mix which does not meet the constraint on water usage where the company could end up drawing excess water than permitted by 113 kilo-litres but would result in an increase of ₹ 30 lacs in contribution. She says that ft Is easily possible to do this by managing reporting to the water authorities.
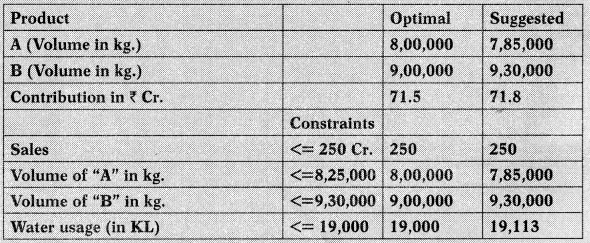
Required
The CFO is not satisfied with the calculations. He wants you (Sr. Finance Manager) to come up with a proper DISCUSSION. [Nov. 2020 RTP]
Answer:
Primary goal of investor -owned firms is shareholder wealth maximisation, which translates to stock price maximisation. Management Consultant’s plan is looking good for the ABC as there is a positive impact on the profitability (₹ 30 lacs) of the company. Also, ABC operates in a competitive environment so for its survival, it has to work on plans like above.
There is second side of coin that cannot also be ignored i.e. business ethics. It is easily possible to manage drawing of excess water, but it is not an ethical practice as the company has responsibilities towards use of natural resources like water and protecting the environment.
Besides, a whistle-blower complaint to the water authorities can land the company into trouble in terms of penalties, a financial impact and also such penalties are disallowed for income tax purposes. It is possible that such a violation may be reported in the media causing disrepute to the name of the company. It can also make investors in the share market stay away from the company as it has ethical governance issues. The company will face challenges in obtaining other government approvals when it will plan expansion as this violation may have to be reported on the applications seeking approvals.
Overall
May be ABC would able to earn profit due to this plan in short run but it will tarnish the image of the ABC which would hurt profitability in long run. Therefore, before taking any decision on this plan, ABC should analyse both qualitative and qualitative factors.
Question 43.
(Case Study) (Financial and Non-financial performance consideration)
Marcus Neo-Fashion Limited (MNFL) is leading brand in fashion world. Company is dealing in both fabric and readymade garments. Since the company was established long ago, hence has well established SOPs. Management at MNFL is highly concerned with performance and productivity.
In order to determine and appraise the performance, MNFL conducts fortnightly meeting of heads of different responsibility centres apart from quarterly master meeting. In master meeting each of such departmental head need to present report for his department on following aspects-
Performance Matrix Dashboard at MNFL
| Criteria |
Indicators |
| I |
Average Capital Employed in department with detailed information of source and nature (working or permanent capital) |
| II |
Revenue and Earnings |
| III |
Output (in terms of No. of units and per employee productivity) |
| IV |
Existing Clients and New Customer added with data on market share |
In one of recent such master meetings, which was chaired by CEO, newly appointed VP-HR quoted ‘Intellectual capital is as critical as financial capital in order to ensure smoothening, success and sustainability of any business’ hence employee where so ever lagged in technical skills, it is essential and important to work on his skills in order to enhance the productivity. VP-HR said at MNFL ratio of skilled, semi-skilled and unskilled worker are 1:2:6, which needs to be worked at. He also insists to roll-out new wage policy which should support ‘Performance Related Pay’. He said, ‘I don’t know much about enterprise performance, but I strongly believe that performance indicators must include performance of employees in term of their skill and knowledge’.
Immediately VP-Finance said existing performance matrix is essentially focused EV / EBIT and returns on capital hence sufficient from prospective of performance appraisal. Hence there is no major need to consider impact and effect of human capital. He also added that entities revenue is growing @ of 14% and earning is growing at 12% which 4% on higher side then industry. He said present rate of ROI is 11.5% which is better than industry average of 9%; and Market Cap is also doing well.
VP-Finance countered by VP-Pianning & Operations, according to him ‘skilled labour will be added advantage in order to developzed’ culture e., zero accidents, zero defects, zero delays, zero inventory, zero breakdowns,
zero changeovers, zero waste’. He also said skilled labour can also add value by incorporating innovations. He quoted presently average defect rate is 1.5% of total production.
On this VP-Marketing add ‘skilled employee means better process and better processes leads to competent value chain which can serve highly customised product; hence preconceived quality (conformance to customers need) leads to strong brand equity.
Chief Information officer support VP-Marketing and VP-HR by quoting the position of brand can be improved by product development. Newly developed product will meet and set, latest style; statement in market; eventually help MNFL to acquire new customers within existing marketing without Incurring much on advertisement or sales and promotion. Skilled labour can easily bring innovation to the product.
Required
Post conclusion of meeting, CEO requested you (Management Accountant)
(i) DESCRIBE performance management indicators,
(ii) DISCUSS need of non-financial performance indicators at MNFL.
(iii) TABULATE role of non-financial performance indicators considering the indicator or measures suggested by VP-HR and Chief Information officer.
(iv) Briefly EXPLAIN different models of non-financial performance indicators that MNFL can apply.
Answer:
(I) Perfonnance Management Indicators
Performance Management System plays a ky role in developing strategy; it is require measuring the current performance and establishing standard. For performance measurement, certain indicator can be established & such indicator may be
- Financial Performance Indicator e.g., ROI, EPS and EBITDA
- Non-Financial Performance Indicator e.g., Balance Scorecard Performance indicator having objectives of
- Evaluating the achievements of organisation objective
- Compensate manager .
(ii) Need of non-financial performance indicatots
Since financial performance indicators are profit oriented onk, hut strategy needs to be sustainable aparl from profitable. Hence in order to overcome the inadequacy and unjustif iable nature of financial performance indicators, non-financial performance indicator need also to be used. Hence opinion framed by VP-Finance is not tenable that revenue and earnings growth of 14% and 12% respectively, apart from ROI is 11.5% is sufficient to evaluate performance.
Non-Financial Performance Indicators are sustainable action-based indicators. For example, employee training/health & safety will increase the profit & let them feel empowered, hence NFPIs are equally important to consider. Similarly putting effort in research and development to yield innovative product will result in high brand image & high intellectual property rights.
(iii) Role of Non-Financial Performance Indicator (NFPI)
As already stated, Non-Financial Performance Indicator consider non-monetary aspects of performance such as-
- Skill, Attrition and Job Satisfaction of Human Resource
- Quality of Product
- Brand Equity
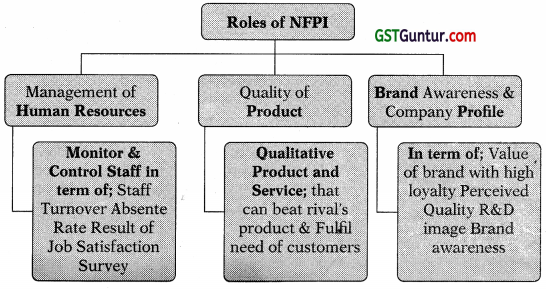
(iv) Different Models of Non-Financial Performance Indicators that MNFL can apply
Top bosses at MNFL wish to consider non-financial indicators apart from financial indicators, hence following models of non-financial performance indicators can be applied-
Balanced Scorecard (By Robert Kaplan and David Norton in 1990)
Balanced Scorecard can equip, MNFL with a management system (which is more than just measurement system) that is better, in terms of ensuring availability of information to business manager to make better decision and evaluation thereof, by establishing goals and measures in regard to four perspectives-
Innovation, Learning and Growth Perspective – Suggested by VP – HR
Internal Business Process Perspective – Suggested’by VP – Operation and Planning
Customer Prospective – Suggested by VP – Marketing and Chief Information Officer
Financial Perspective – Already under consideration
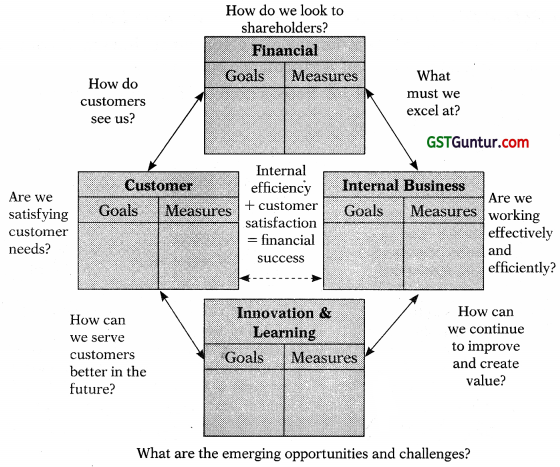
Innovation, learning & Growth Perspective:
- Employee training & corporate culture attitudes in order to ensure individual and corporate improvement.
- People are main resources in an organisation because they are only repository of knowledge.
- It constitutes essential foundation for success of any knowledge worker organisation (learning and growth).
- Learning is something more than training. Purpose is to improve ratio of skilled, semi-skilled and unskilled worker (1:2:6); not by hiring but by inculcating learning into exiting workforce.
Internal Business Process Perspective
- This perspective refers to internal business process.
- This perspective allows the manager to know how well their business is running.
- This perspective needs to be carefully designed/explained by those who know these processes most intimately.
Customer Perspective
- Recent management philosophy has shown on increasing realisation of the importance of customer focus.
- Customer Satisfaction is very important for any business, because if customer is not satisfied, then will find other supplier to fulfil their need.
- Customer base should be categorised and analysed.
Financial Prospective
- Kaplan and Norton don’t disregard the traditional needs of financial data.
- Ensuring availability of accurate financial data on timely bases is one among the priority of management – process of storing and retrieving financial information should be centralised and automated.
- There may be needed to include additional financial data such as risk assessment and cost aspects.
Expected benefit to MNFL of implementation of balance scorecard includes holistic approach, overall agenda, objectivity, management by objective, feedback and learning and system approach.
Performance Pyramid (By Lynch & Cross) Performance Pyramid which ! contains hierarchy of financial and non-financial performance measures, can help MNFL in considering customer and market as part of performance indicators apart from financial aspects. There are the 4 level of pyramid.
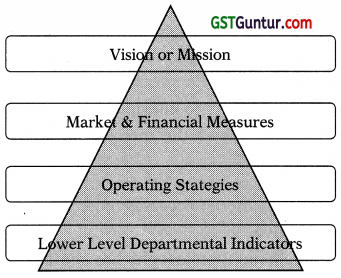
Level 1
Corporate Vision and Mission defines how organisation will achieve long term success & competitive advantage.
Level 2
In order to achievement of Corporate Vision and Mission the focus is on-
- Market Related Measures .
- Financial Measures
Level 3
Operating Strategies become guiding force to achieve strategic objective, which includes Customer Satisfaction, Increased Flexibility and High Productivity.
Level 4
Status of level 3 driving forces can be monitored using the lower-level departmental indicators such as Quality, Delivery, Cycle time and Waste etc.
Note – There is drawback of pyramid that it does tend to concentrate largely on shareholder & customer.
Building Block Model (By Fitzgerald and Moon)
Building Block Model an approach to performance measurement in business services. There are three blocks Dimensions, Standards and Rewards.
- Dimensions are Critical Success Factors (CSFs)
- Standards are Key Performance Indicators (KPIs) and
- Reward is essential in order to keep workforce energetic and motivated – hence should be performance related.
MNFL can use the Building block model to identify the CSFs and then determine the KPIs. These both CSFs and KPI will become the part of performance matrix at MNFL.
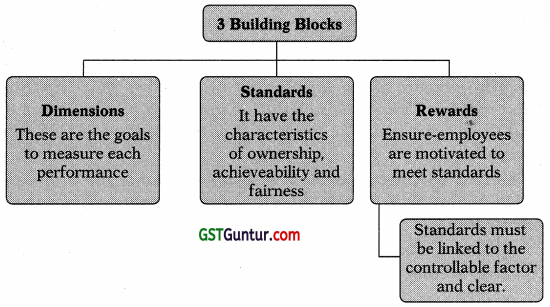
Performance Prism (By Andy Neely and Chris Adams)
There is limitation of balance scorecard that is only two set of stakeholders, which are shareholder and customer. MNFL can overcome that limitation of balance scorecard by using Performance Prism model.
Performance Prism framework can help the top bosses at MNFL to consider wide range of stakeholders including activities, communities, consumers, employees, legislators, regulators and suppliers with five focus areas.
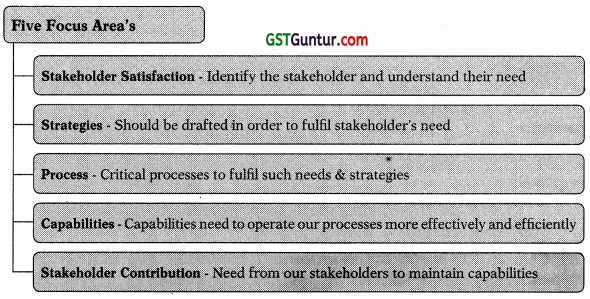
Question 44.
ConaPrecise Solutions (CPS) manufactures switchgear and specifically designed the electricity boards, which are sold to customer through wide-spread retailers and distributors network across the country.
CPS enjoys the high reputation among the stakeholders, specifically workers. The attrition rate at CPS is relatively lower than of other players in the industry; reason for low attrition rate is employee friendly policies, specifically in regard to sharing of profit and employee participation in decision making. Cona Precise Solution applied a profit-sharing plan around three years ago. The terms of profit share plan of CPS can be read as follows-
1. The CPS will be responsible to make available the profit share pool, which will be equivalent to the minimum of following of three limits-
a. 30% of Earning before taxes, to the extent it is excess of the minimum acceptable target profit margin, or
b. 0.75% of Gross Revenue, or
c. Absolute amount of ₹ 2.5 Crores
2. Minimum acceptable target profit margin will equivalent to the average of last three year’s net operating profit of industry group.
3. The individual employee will be participated in profit share pool in proportion to ratio of that employee salary to the total salary of all employee of that division.
Additional Information for year just closed are-
1. CPS’s earning before tax is ₹ 40 Crores.
2. Net operating assets employed by CPS are ₹ 120 Crores.
3. During the year, CPS records the revenue of ₹ 360 Crores.
4. Total relevant payment of salary for the year was ₹ 42 Crores.
5. Industry’s average last three year’s net operating profit rate is 8% of net operating assets.
Required
(i) EXPLAIN profit sharing plan, as performance management tool and group incentive plan.
(ii) COMPUTE the will the amount to be make available as profit sharing pool by CPS.
(iii) Mr. Vineet Shukla, who is one of the employee of CSP and eligible to participate in profit share plan, if his annual salary is 36 lakhs, then COMPUTE the amount of his profit share.
(iv) Synthesise profit sharing plan of CPS, in order to highlight major limitation.
Answer:
(i) Profit Sharing Plan
Profit Sharing is a group incentive arrangement where cash bonus is paid to worker or employees, calculated based upon the reported profit of concerned division (responsibility centre) of entity or of entity as a whole. Since profit sharing is based upon the profit, hence can be said a compensation plan based upon short – term performance. Profit share plan must define the percentage of profit to be shared and who are eligible employees for participation and what will the ratio of participation by each employee/worker in the bonus pool and formula for computing each of these percentage or ratio. The criteria for participation in share may be score or salary/ wage.
Profit share plan may be used to boost the motivation among the employees to enhance and promote their performance, hence profitsharing plan can be considered as performance management tool. Profit sharing plan can also be considered as pre-stage of Kaizen Costing.
(ii) Amount of profit-sharing pool will be equivalent to the minimum of following of three limits-
30% of Earning before taxes, which are in excess of the minimum acceptable target profit margin,
30% of ₹ 40 Crores – 8% of ₹ 120 Crores
₹ 12 Crores – ₹ 9.6 Crores
₹ 2.4 Crores
or
0.75% of Gross Revenue, 0.75% of ₹ 360 Crores
₹ 2.7 Crores
or
Absolute amount ₹ 2.5 Crores
So, Amount of profit-sharing pool will be ₹ 2.4 Crores.
(iii) Share in profit sharing pool of Mr. Vineet Shukla
The individual employee will get share in proportion to ratio of his salary to the total salary of all employee of that division.
Profit Sharing Pool × \(\frac{\text { Individual Employee’s Salary }}{\text { Total Gross Salary }}\)
2.4 Crores × \(\frac{0.36 \text { Crores }}{42 \text { Crores }}\)
= ₹ 0.0205714 Crores ie., ₹ 2,05,714
(iv) Profit Sharing is a group incentive arrangement, where each member of group will participate in profit sharing pool in ratio of either score scored by him/her in reference to total score; then it is valid. But if share of profit-sharing pool is calculated based upon wages likewise in case of CPS, then a worker who may be under performing getting the share despite his performance is not acceptable; In similar way, an efficient worker may not get due reward/share. Hence major limitation of profit-sharing plan is due to inherent nature of it.
Question 45.
XEE Ltd. is a company which manufactures two types of material for engineering applications. It makes these two types of materials in two production lines: Line 1 and Line 2. Line 2 has a different process and is easier in terms of ‘getting this fixed at the customers end and has longer life (1.5 times the life of Line 1 product).
These are sold in kg. Line 1 has a capacity to produce 6,50,000 kg. per annum and Line 2 has a capacity to produce 2,40,000 kg. per annum.
The company management has given a directive to the CEO, CFO and the Sales Head that in no circumstance the Contribution Margin to Sales shall fall below 40%.
Currently, Line 1 is running at about 92% capacity (3 shifts) and Line, 2 at about 33% capacity (1 shift).
The Capacity, costs and profitability data for the year 2018-19 are as follows:
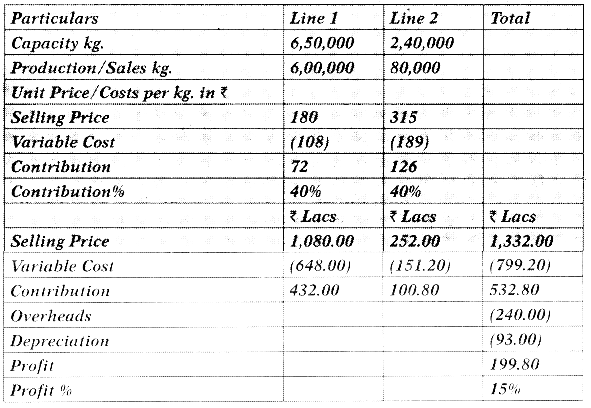
Scenario 1
At a meeting of the CEO, Sales Head and the CFO; the Sales Head informs the team that there is a potential of a one-time 80,000 kg. of Line 2 product order from a large customer who can commit on delivery schedules for the whole of 2019-20 kg. at a price of ₹ 250 per kg.
The Sales Head also informs that the new customer is aware of the price of product from Line one, the fact that the line capacity is full and the Line 2 product can deliver life which is 1.5 times of the Line 1 product.
The Sales Head also informs that he may have to reduce price by ₹10 per \ kg. for the existing customers i.e., from ₹ 315 per kg. to ₹ 310 per kg.
To a question from the CEO that this would involve additional overheads, – the CFO checks on his laptop and informs that for an additional shift of operation of line 2, the incremental overheads would be ₹ 6.20 Lacs p.a. y- per shift (shift supervisors, lighting etc.) and depreciation will increase by ₹ 16.00 Lacs p.a. per shift.
The CEO poses the following questions to both the CFO and the Sales Head:
1. Given that the order is one time, what will happen to the fixed overheads committed in 2019-20 and the loss of profits due to re-duction in price to existing customers which cannot be increased in the subsequent years?
2. The CEO is also concerned about the reduction in contribution % from the management stipulated 40%. To address the issue the CEO asks both the CFO and the Sales Head to come up with an acceptable pricing for Line 2 for the new one-time customer. He indicates to them that the price should be such that the % to Sales to Profit achieved in 2018-19 is maintained.
3. Further, the CEO mentions that the new customer should also be convinced of the price to be quoted. He also mentions that the sales from Line 1 for 2019-20 will be at the same level (6,00,000 kg.) and at the same price. There are no changes in costs (both variable and fixed) too.
Required
You are the deputy to the CFO and you are requested to come up with RECOMMENDATIONS on:
(i) Ideal Price to be quoted for the new customer with reasons to be proposed by Sales Head to the new customer to convince him to accept the price so quoted.
(ii) Reasons to be mentioned to the management on why the price to be so quoted is acceptable despite the fact that it would result in a lower contribution margin % than that prescribed by the management.
(iii) Recommend a strategy in consultation with the Sales Manager to make up for the fixed overheads and loss of profits due to reduction in price for the existing customers of Line 2 product for subsequent years.
(iv) Also arrive at a price to the new customer at or below which it does not make financial sense to quote and get the order from the new customer with explanations.
Scenario 2
In a different scenario where volumes for the year 2019-20are assumed to be exactly same as in 2018-19 but price of raw material has increased
2. A price increase by ₹ 12 kg. for each of the products will result in a drop in contribution % below 40% for both the products. Calculations indicate that the contribution margin can be retained at 40% if the prices are increased by ₹ 20 per kg.
Required: You are requested to indicate which price increase; ₹ 12 per kg. or ₹ 20 per kg. has to be obtained from the customer and why?
Answer:
Scenario 1
(i) The ideal price would be ₹ 260 per kg. to be quoted to the customer. While the customer has asked for a price of ₹ 250 per kg., the price of ₹ 260 per kg. is still beneficial to the customer as the life of Line 2 product is 1.5 times Line 1 product priced at ₹ 180 per kg.
1.5 times 180 is ₹ 270 and the customer would benefit even at a price of ₹ 270 per kg. but is getting a good bargain at ₹ 260 per kg. This has to be explained to the customer to get him accept the price of ₹ 260 per kg. as against ₹ 250 per kg. sought by him.
(ii) At this price while the contribution for Line 2 product drops to about 34% but the overall Profitability at profit level is maintained at 15%. The reason for profitability remaining at 15% despite the drop in contribution to about 34% is because overheads and depreciation increase only incrementally and the accretion to contribution at the price of ₹ 260 form the new customer is at ₹ 56.80 lacs is far higher than the incremental overheads plus depreciation which is ₹ 22.20 lacs (₹ 6.20 lacs + ₹ 16.00 lacs). This has to be explained to the management.
(iii) As this is a one-time order, the company would be saddled with ₹ 6.20 lacs (predominantly manpower supervision cost) and a loss of contribution of ₹ 4.00 lacs due to sale of Line 2 product at ₹ 5 less per kg. in subsequent years too. Also, a price once reduced cannot be increased easily. To make up for this, the Sales Head should sell at least 15,000 kg. of Line 1 product. This is arrived at by dividing ₹ 10.20 lacs (₹ 6.20 lacs + ₹ 4.00 lacs) by contribution per unit of Line 1 product which is 72,14,167 kg. (₹ 10.20 lacs/72), rounded off to 15,000 kgs. for which capacity is available (50,000 kgs.) within the 3rd shift. Depreciation cost for the 2nd shift will not be incurred as Line 2 will be back to single shift operation after 2019-20.
(iv) The incremental costs are the variable costs plus loss of margin on existing customers plus the incremental overheads and depreciation totalling to ₹ 26.20 lacs. If these are recovered, then there is no loss. The price to be obtained will be ₹ 221.75. This will be variable cost of 1189 per kg. plus 132.75 per kg. which is 126.20 lacs divided by 80,000 kgs. At this price there is no loss or gain but it is not worth the effort of running the 2nd shift. If the customer is a hard negotiator and has alternatives, the price to be accepted for reasons other than profits (for example gaining a big customer where there is a possibility of big orders in future) cannot be less than ₹ 221.75.
Scenario 2
With a raw material price increase at ₹ 12 per kg., no customer will pay more than ₹ 12 per kg. as the XEE Ltd. will have to justify. Though there is a fall in contribution %, to there is no loss to the company as the price increase in variable costs amounting to ₹ 12 per kg. is fully recovered.
Workings
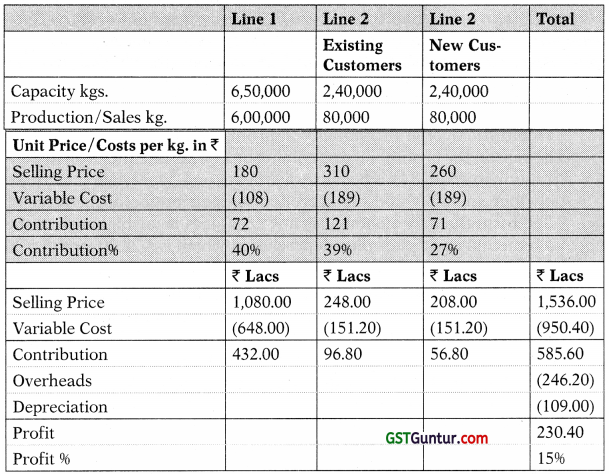
The price of 260 per kg. has been derived as follows:
Assume the price to new customer be “X”. Hence
Sales less Variable costs less Overheads less Depreciation = 15% of Sales
(1,080.00 + 248.00 + X × 0.80) – 950.40 – 246.20 – 109.00
= 15% of (1,080.00 + 248.00 + X × 0.80)
Or 22.40 + 0.80X = 199.20 + 0.12X
Or 0.68X = 176.80
Or X= 176.80/0.68 = 260
Question 46.
(Balance scorecard; EVA)
NFC Limited is a company engaged in the manufacture and supply of forgings and castings for automotive and industrial applications. Automotive contributes to 60% of its revenues while the balance (40%) can be traced to industrial applications which amongst others include, Power, Oil and Gas and General Engineering. The company hasanR&D set-up which includes new product development. The company recently concluded successfully a Long- Term Settlement with the workmen with an increase in productivity numbers in terms of output per man per day more than offsetting the increase in wages offered to workmen. The company has just completed (October 2018) its strategy and business planning exercise for Calendar year 2019 and beyond. The following is the data on 2018 (estimate) and the business plan for 2019.
| Balance Sheet |
Estimate 2018 |
Budget 2019 |
| Million |
Million |
| Equity |
3,000 |
3,000 |
| Reserves (Opening) |
1,000 |
2,250 |
| Transfer (Current year surplus) |
1,250 |
730 |
| Debt @10% (pre-tax) |
2,000 |
1,500 |
| Trade Creditors |
600 |
700 |
| Total |
7,850 |
8,180 |
| Plant and Machinery |
4,000 |
3,500 |
| Inventories |
1,500 |
1,630 |
| Debtors |
1,600 |
1,770 |
| Cash |
750 |
1,280 |
| Total |
7,850 |
8,180 |
| Profit and Loss Account |
|
|
| Sales |
9,000 |
10,800 |
| Less: Expenses |
6,000 |
7,000 |
| Less: Depreciation |
500 |
500 |
| Less: Interest |
200 |
200 |
| Profit |
2,300 |
3,100 |
| Less: Tax @ 30% |
690 |
930 |
| Profit After Tax |
1,610 |
2,170 |
| Less: Dividend and Dividend Distribution Tax |
360 |
1,440 |
| Transfer to Reserves |
1,250 |
730 |
Assumptions /objectives drawn up in the making of the strategy and business plan document are as follows:
1. To improve shareholder value by attempting to grow EVA substantially over 2018.
2. To de-risk exposure to few sectors further by looking at other diverse applications through new technologies, tie-ups etc. This could be in the areas of Defense and Aerospace or even new areas like Electric Vehicles which would be the future in the mobility space.
3. To keep investing in R&D to ensure that the company keeps pace with changes in technologies and in meeting customer requirements by developing new products in accordance with their needs
4. Financials:
a. An increase of 20% in Sales has been assumed over 2018. This includes an expected market growth of 12%, 3% from a new product “NP” to a large manufacturer (a new customer) for 9 months in 2019. It is expected that the new customer will approve the product by March 2019 (3 months from January 2019 when the approval process will start) so that 9 months sale can be realized. It normally takes 5 months for the approval. The company expects the balance 5% growth from normal new products, new customers, improved service levels in terms of delivery etc. Capacity is sufficient, also aided by the productivity improvement from the Long-Term Settlement with the workers.
b. Inventories: A reduction in number of days inventory held by 5 days has been budgeted. Without this reduction, the inventories would have been 11,800 Million as against ₹ 1,630 Million budgeted.
c. Debtors: A reduction in number of days sales outstanding by 5 days has been budgeted. Without this reduction, the debtors would have been ₹? 1,900 Million as against ₹ 1,770 Million budgeted.
d. Expenses have been budgeted at ₹ 7,000 Million taking into consideration cost savings. It should have been ₹ 7,500Million taking into consider action, ncreased activity levels (Sales), cost inflation including the wage increase from the Long-Term Settlement but without cost savings.
e. No reduction or increase in creditors budgeted except for the increase in activity levels (Sales).
f. Repayment of debt ₹ 500 Million on 31st Dec. 2019.
Required: Your superior, the CFO of the company has asked you to:
(i) PREPARE a Balanced Score Card for Calendar year 2019 including objectives to be included for achieving long term goals of the company. He informs you that the company wants to use EVA as an overall performance measure and a driver to achieve improved shareholder value.
(ii) The CFO also wants you to indicate metrics where possible and but ignore weightages for the perspectives and clearly EXPLAIN the inclusion of the objectives in each perspective of the balance scorecard.
(iii) You have therefore been also entrusted with the task of PREPARING the Economic Value Added (EVA) with assumptions for the previous year 2018 (estimate) and also for the budget year 2019 and ensure that this forms the predominant basis for the balanced scorecard. Cost of Equity is 14%.
Answer:
(i) Balanced Score Card
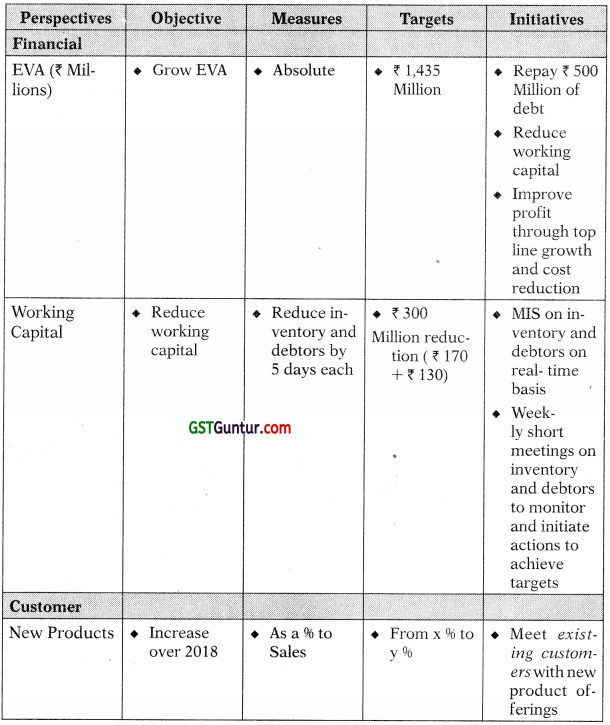
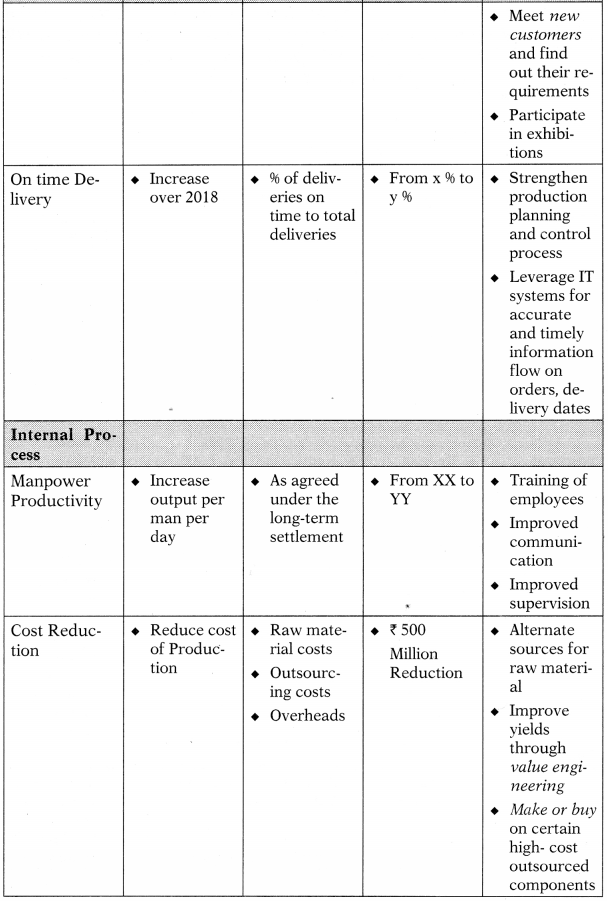
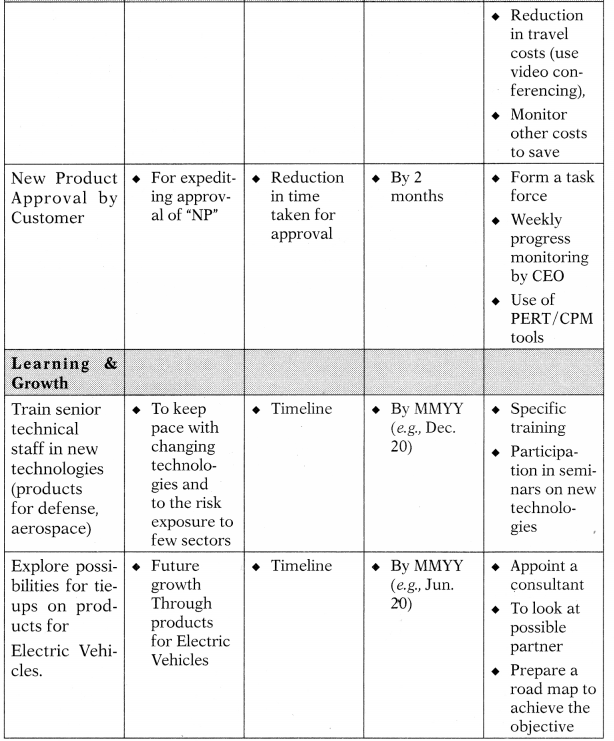
(ii) Rationale for each of the above perspectives:
a. EVA has been included under “Financial Perspective” as this is what the company intends to drive the same and it is a good measure of shareholder value as it takes into consideration cost of equity which a normal profitability metric ignores. Working Capital is included, as (an improvement in the working capital measure would affect cost of capital and hence EVA.
b. New products and improvements in delivery times have been included under “Customer Perspective” as these have to be driven to achieve the sales volumes beyond normal industry growth. This will ultimately improve sales, profits and hence EVA.
c. Manpower productivity and cost reduction have been included under ; “Internal Perspective” as these have to be monitored and further efforts taken to reduce other costs to achieve the cost reduction planned to finally achieve the profits required to deliver the EVA.
d. As the balanced score card is just not a short-term measure, initiatives on new products, technologies and new markets have been included in the “Learning and Growth” perspectives to plan for long term sustained growth and to ensure that the company stays relevant in a changing business environment.
(iii) EVA Calculations
| Particulars |
2018 (Est.) Million |
Budget 2019 Million |
| PAT |
1,610 |
2,170 |
| Add:Interest adjusted for tax {Intercst × (1-0.3)} |
140 |
140 |
| NOPAT |
1,750 |
2,310 |
| Capital Employed (see assumptions below) |
|
|
| Equity (1496) |
3,000 |
3,000 |
| Reserves |
1,000 |
2,250 |
| Debt (1096) |
2,000 |
2,000 |
| Cost of Capital |
|
|
| Equity (1496) |
420 |
420 |
| Reserves (1496) |
140 |
315 |
| Debt (10%X(I -0.3)} |
140 |
140 |
| Cost of Capital |
700 |
875 |
| EVA (NOPAT – Cost of Capital) |
1,050 |
1,435 |
Assumptions
For 2018 estimated, Capital Employed is opening equity, reserves and debt. I Similarly, for budget 2019, for calculating Capital Employed, opening equity, reserves have been considered.
Economic and accounting depreciation were assumed to be the same.