Chapter 14 Business Model Analysis – CS Professional Valuations and Business Modelling Study Material is designed strictly as per the latest syllabus and exam pattern.
Business Model Analysis – CS Professional Valuations and Business Modelling Study Material
Question 1.
Explain Working Capital Management through business modeling with practical example. (June 2019, 5 marks)
Answer:
Working capital management refers to a company’s managerial accounting strategy designed to monitor and utilize the two components of working capital, current assets and current liabilities, to ensure the most financially efficient operation of the company.
The primary purpose of working capital management is to make sure the company always maintains sufficient cash flow to meet its short-term operating costs and short-term debt obligations.
Working capital management commonly involves monitoring cash flow, assets, and liabilities through the ratio analysis of key elements of operating expenses, including the working capital ratio, collection ratio, and the inventory turnover ratio. Efficient working capital management helps maintain / the smooth operation of the operating cycle (the minimum amount of time required to convert net current assets and liabilities into cash) and can also help to improve the company’s earnings and profitability.
Management of working capital includes inventory management and management of accounts receivable and accounts payables. The main objective of working capital management include maintaining the working capital operating cycle and ensuring its ordered operation, minimizing the cost of capital spent on the working capital, and maximizing the return on current assets investments.
![]()
For many Firms, the analysis and management of the operating cycle is the key to healthy operations. For example, imagine the appliance retailer / ordered too much inventory – its cash will be tied up and unavailable for spending on other things (such as fixed assets and salaries). Moreover, it will ) need larger warehouses. Will have to pay for unnecessary storage, and will have no space to house other inventory.
Imagine that in addition to buying too much inventory, the retailer is lenient with payment terms to its own customers (perhaps to stand.out from the competition). This extends the amount of time cash is tied up and adds a layer of uncertainty and risk around collection.
Now imagine our appliance retailer mitigates these issues by paying for the inventory on credit (often necessary as the retailer only gets cash once it sells the inventory). Cash is no longer tied up, but effective working capital management is even more important since the retailer may be forced to discount more aggressively (lowering margins or even taking loss) to move inventory in order to meet vendor payments and escape facing penalties. Taken together, this process represents the operating cycle (also called the cash conversion cycle). Companies with significant working capital consideration must carefully and actively manage working capital to avoid inefficiencies and possible liquidity problems.
In our example, a perfect solution could look like this:
- If the retailer bought excess inventory on credit with short repayment terms
- Economy is slow, customer aren’t paying as fast as was expected
- Demand for the retailer’s product offerings changes and some inventory flies off the shelves while other inventory is not selling.
![]()
Question 2.
‘Business leader of business model innovation need to embrace uncertainty, come to the work with a sense of curiosity and patience, and take the time to unpack the learning from what they are seeing around them.’ Brief the important principles of designing successful business model. (Dec 2019, 5 marks)
Question 3.
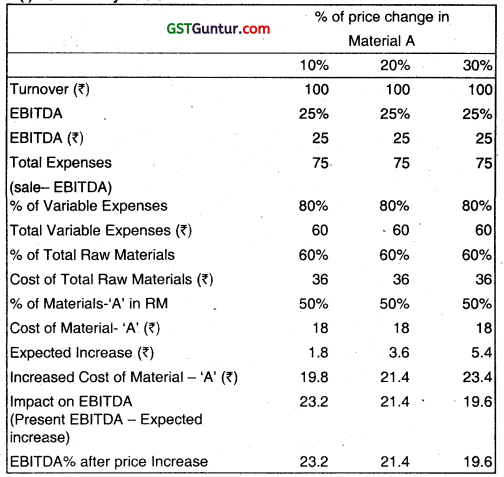
ABC Limited is engaged in the business of Manufacturing alloy components. The CFO of the Company estimates that the Turnover of Company for the forthcoming Financial Year will be ₹ 100 crore and thereafter year on year the Company can achieve 10% growth. He has also estimated that Earnings Before Interest, Tax, Depreciation and Amortisations (EBITDA) for the forthcoming Financial Year will be 25% on Turnover. He also informs the Management that the Company can maintain the 25% EBITDA, provided there is not much change in the expenditure, as the 80% of expenditure of the Company is variable in nature.
However, the purchase head of the Company comes out with the information that price for one of important Raw Material – ‘A’, which forms 50% of the total raw materials is likely to rise upto 30% during the next Financial Year. (Raw Material cost is estimated to be 60% of the Total Variable Cost). An alternate Raw Material – ‘P’ is available, however it is costlier and it will bring down present EBITDA margin to 20%. It is expected that price of Material – ’P’ will be stable in the next Financial Year. Assume there is no change in fixed or other variable expenses except change in Material ‘A’s price, as a part of the management you are required to : (June 2019)
![]()
(i) Find out the impact on profitability by preparing a Sensitivity Analysis table, if the price of the Raw Material —‘A’ is increases by 10%, 20% and 30% for the next Financial Year. (5 marks)
(ii) Find out % of Variable and Raw Material cost on Sales if Material — ‘P’ is used and also find out at what levels of increase in Material — ‘A’s price, the Company can opt for use of Raw Material — ‘P’. (5 marks)
Answer:
(i) Sentivity Table
(ii) Usage of Material ‘P’
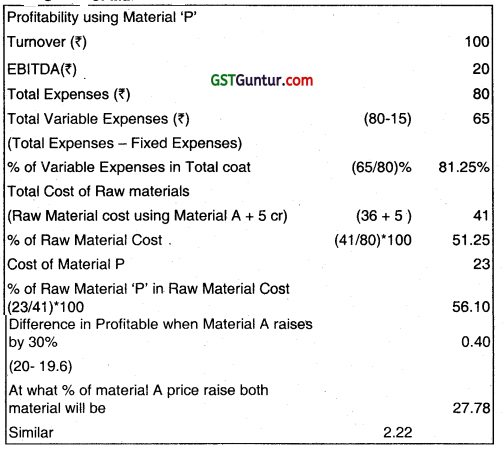
Upto 27.78% of Material A’s price raise it can be used, beyond that Material P can be opted.
![]()
Question 4.
Sibaca Textiles Limited is carrying on dyeing and printing of fabrics. The business of the Company is of a seasonal nature. Peak seasons for the business are January to March and July to September. During peak season period monthly sale will be ₹ 2,000 Lakh per month.
During each of the off season month the monthly Sales will only be 50% of the Peak season sale. Out of Total Sales, 10% is cash sale and Credit Sale is 90% and normal credit period allowed is 60 days (received at the end of second month ex. January Sale is received during March). Presently, out of credit sales customers’ at least 30% delay the payment and makes payment only at the end of third month.
Fixed Expenses are ₹ 400 Lakh per month and Variable expenses are 60% of the monthly sales of that month and payment for the same have to be made at the end of second month. In the month of September the Company requires ₹ 2,000 lakh for new machinery. Bankers of the Company are ready to fund upto ₹ 1,700 Lakh.
Opening Cash and Bank Account available is ₹ 500 Lakh. Cash Management policy of the company is to maintain atleast ₹ 500 Lakh as minimum Balance.
The Management is requesting you to prepare:
(i) Cash projections for 6 months commencing from July to December with your suggestion that how much the Company need to borrow for new machinery.
(ii) Prepare sensitivity analysis of projections, if credit sales customers who are delaying payment (payment received at the end of third month) increases from 30% to 40%. Will it have any impact on new machinery to be bought in September and amount to be borrowed for the same? (Dec 2019, 10 marks)
![]()
Question 5.
Write note on Decomposition of revenue.
Answer:
Decomposition of Revenue
The modeller’s ultimate objective is to develop a forecast for the total revenue of a business. This can be decomposed into a number of elements. The individual elements that comprise the total revenue for a business will depend on the industry in which it operates. In several industries total revenue can be computed from an estimate of the number of customers who demand a product or service; the quantity of that product or service that they demand; and the price charged per unit of that product or services.
The exact definitions of customers, products and services, and prices may differ, but the general approach will usually prove valid. Decomposing a forecast into the individual elements allows the modeller to observe to what extent a change in total revenue is a result of changes in quantities (sometimes referred to as volume changes) and changes in price.
Historically, in the case of the mobile communication industry, a major proportion of the total revenue was generated by voice traffic. The voice revenue could be decomposed into a number of readily identifiable elements:
(a) The number of customers using the network.
(b) The average number of minutes of voice calls made by each customer.
(c) The average price charged for each minute of use.
The total voice revenue for a mobile business could be calculated using the following equation:
Average number of customers × Average number of voice minutes × Average price per minute
![]()
Question 6.
What do you mean by sensitivity analysis. Discuss the various methods and uses of sensitivity analysis.
Answer:
Sensitivity Analysis
The technique used to determine how independent variable values will impact a particular dependent variable under a given set of assumptions is defined as sensitive analysis. It’s usage will depend on one or more input variables within the specific boundaries, such as the effect that changes in interest rates will have on a bond’s price.
It is also known as the what – if analysis. Sensitivity analysis can be used for any activity or system. All from planning a family vacation with the variables in mind to the decisions at corporate levels can be done through sensitivity analysis.
It helps in analyzing how sensitive the output is, by the changes in one input while keeping the other inputs constant.
Sensitivity analysis works on the simple principle: Change the model and observe the behaviour.
The parameters that one needs to note while doing the above are:
1. Experimental Design : It includes combination of parameters that are to be varied. This includes a check on which and how many parameters need to vary at a given point in time, assigning values (maximum and minimum levels) before the experiment, study the correlations: positive or negative and accordingly assign values for the combination.
![]()
2. What to Vary: The different parameters that can be chosen to vary in the model could be:
(a) the number of activities
(b) the objective in relation to the risk assumed and the profits expected
(c) technical parameters
(d) number of constraints and its limits
3. What to Observe:
(a) the value of the objective as per the strategy
(b) value of the decision variables
(c) value of the objective function between two strategies adopted Measurement of sensitivity analysis
Below are mentioned the steps used to conduct sensitivity analysis:
- Firstly the base case output is defined; say the NPV at a particular base case input value (V1) for which the sensitivity is to be measured. All the other inputs of the model are kept constant.
- Then the value of the output at a new value of the input (V2) while keeping other inputs constant is calculated.
- Find the percentage change in the output and the percentage change in the input.
- The sensitivity is calculated by dividing the percentage change in output by the percentage change in input.
This process of testing sensitivity for another input (say cash flows growth rate) while keeping the rest of inputs constant is repeated till the sensitivity figure for each of the inputs is obtained. The conclusion would be that the higher the sensitivity figure, the more sensitive the output is to any change in that input and vice versa.
Methods of Sensitivity Analysis
There are different methods to carry out the sensitivity analysis:
- Modelling and simulation techniques
- Scenario management tools through Microsoft excel There are mainly two approaches to analyzing sensitivity:
(a) Local Sensitivity Analysis
(b) Global Sensitivity Analysis
![]()
(a) Local Sensitivity Analysis: Local sensitivity analysis is derivative based (numerical or analytical). The term local indicates that the derivatives are taken at a single point. This method is apt for simple cost functions, but not feasible for complex models, like models with discontinuities do not always have derivatives.
Mathematically, the sensitivity of the cost function with respect to certain parameters is equal to the partial derivative of the cost function with respect to those parameters.
Local sensitivity analysis is a one-at-a-time (OAT) technique that analyzes the impact of one parameter on the cost function at a time, keeping the other parameters fixed.
(b) Global Sensitivity Analysis: Global sensitivity analysis is the second approach to sensitivity analysis, often implemented using Monte Carlo techniques. This approach uses a global set of samples to explore the design space.
The various techniques widely applied include:
Differential sensitivity analysis: It is also referred to the direct method. It involves solving simple partial derivatives to temporal sensitivity analysis. Although this method is computationally efficient, solving equations is intensive task to handle.
One at a time sensitivity measures: It is the most fundamental method with partial differentiation, in which varying parameters values are taken one at a time. It is also called as local analysis as it is an indicator only for the addressed point estimates and not the entire distribution.
Factorial Analysis: It involves the selection of given number of samples for a specific parameter and then running the model for the combinations. The outcome is then used to carry out parameter sensitivity.
Through the sensitivity index one can calculate the output % difference
when one input parameter varies from minimum to maximum value.
- Correlation analysis helps in defining the relation between independent and dependent variables.
- Regression analysis is a comprehensive method used to get responses for complex models.
- Subjective sensitivity analysis: In this method the individual parameters are analyzed. This is a subjective method, simple, qualitative and an easy method to rule out input parameters.
![]()
Using Sensitivity Analysis for decision making
One of the key applications of Sensitivity analysis is in the utilization of models by managers and decision makers. All the content needed for the decision model can be fully utilized only through the repeated application of sensitivity analysis. It helps decision analysts to understand the uncertainties, pros and cons with the limitations and scope of a decision model.
Most if not all decisions are made under uncertainty. It is the optimal solution in decision making for various parameters that are approximations. One approach to come to conclusion is by replacing all the uncertain parameters with expected values and then carry out sensitivity analysis. It would be a breather for a decision maker if he / she has some indication as to how sensitive will the choices be with changes in one or more inputs.
Uses of Sensitivity Analysis
- The key application of sensitivity analysis is to indicate the sensitivity of simulation to uncertainties in the input values of the model.
- They help in decision making.
- Sensitivity analysis is a method for predicting the outcome of a decision if a situation turns out to be different compared to the key predictions.
- It helps in assessing the riskiness of a strategy.
- Helps in identifying how dependent the output is on a particular input value. Analyses if the dependency in turn helps in assessing the risk associated.
- Helps in taking informed and appropriate decisions
- Aids searching for errors in the model.
![]()
Question 7.
Write note on forecasting revenue.
Answer:
Forecasting Revenue
Forecasting revenue is one the biggest challenges for the business modeller. The first problem is producing a meaningful and useful definition of the market place. In the telecommunications, information technology and media sectors, for instance, there is such a high degree of convergence that it is becoming increasingly difficult to distinguish between the separate markets.
Modellers may also have incomplete or inaccurate data as a basis for their forecasts. Even when an industry-wide revenue forecast has been produced, estimating a business’s market share of that revenue can be even more difficult. Market share has many determinants and some important factors, like, brand strength, are difficult to gauge and incorporate in the model.
Approaches to Revenue Forecasting
The different approaches to forecasting can be classified in several ways. A useful classification is as follows:
(i) Extrapolation techniques: Extrapolation techniques, like, time series analysis, implicitly assume that the past will be a reasonable predictor of the future. This assumption may be valid for mature and stable businesses, like the water and gas utilities. However, many industry sectors are experiencing rising levels of structural change. The use extrapolative techniques for these sectors may provide poor results.
(ii) Causative techniques: Causative techniques, such as, multiple regression, attempt to comprehend the basic relationships, that determine the dynamics of a market. This understanding, combined with a set of assumptions about the future, provides the basis for the forecast. Because the underlying relationships are often estimated from historical data, these techniques are useful when only small, incremental changes in assumptions are expected in the future.
(iii) Judgmental techniques: Modellers may often be asked to produce a forecast for a new product or market where there are no available historic data. In these cases, forecasting can become judgmental and highly subjective. Although the forecasts can be refined through studying the results of market research and by examining the experiences of similar or related products in other markets and countries, the task of forecasting becomes more like an art than a science.
![]()
Question 8.
Discuss the working capital management through Business Modelling.
Answer:
Working Capital Management through Business Modelling
Working capital is one of the toucjhest concepts for the entrepreneurs to comprehend, especially, for the owners of small business. In fact, the term means a lot of different things to a lot of different people. By definition, working capital is the amount by which current assets exceed current liabilities.
There are various approaches to estimate the working capital requirements. However, one of the useful tools for ascertaining working capital needs is the operating cycle. The operating cycle analyzes the accounts receivable, inventory and accounts payable cycles in terms of days.
In other words, accounts receivable are analyzed by the average number of days it takes to collect an account. Inventory is analyzed by the average number of days it takes to turn over the sale of a product. Accounts payable are analyzed by the average number of days it takes to pay a supplier invoice.
Most businesses need short-term working capital at some point in their operations. For instance, retailers must find working capital to fund seasonal inventory build-up between September and November for Christmas sales. But even a business that is not seasonal occasionally experiences peak months when orders are unusually high. This creates a need for working capital to fund the resulting inventory and accounts receivable build-up. The other methods for estimating working capital requirements are as follows:
![]()
(i) Percentage of Sales Method: This method of estimating working capital requirements is based on the assumption that the level of working capital for any firm is directly related to its sales value. If past experience indicates a stable relationship between the amount of sales and working capital, then this basis may be used to determine the requirements of working capital for future period.
Thus, if sales for the year 2007 amounted to ₹ 30,00,000 and working capital required was ₹ 6,00,000; the requirement of working capital for the year 2008 on an estimated sales of ₹ 40,00,000 shall be ₹ 8,00,000; i.e. 20% of ₹ 40,00,000.
The individual items of current assets and current liabilities can also be estimated on the basis of the past experience as a percentage of sales. This method is simple to understand and easy to operate but it cannot be applied in all cases because the direct relationship between sales and working capital may not be established.
(ii) Regression Analysis Method (Average Relationship between Sales and Working Capital): This method of forecasting working capital requirements is based upon the statistical technique of estimating or predicting the unknown value of a dependent variable from the known value of an independent variable. It is the measure of the average relationship between two or more variables, i.e.; sales and working capital, in terms of the original units of the data.
![]()
The relationships between sales and working capital are represented by the equation:
y = a + bx
Where, y = Working capital (dependent variable)
a = Intercept of the least square
b = Slope of the regression line
x = Sales (independent variable)
For determining the values ‘a’ and ‘b’ two normal equations are used which can be solved simultaneously:
Σ y = na + bΣ X
Σ xy = aΣ x + bΣ X2
(iii) Cash Forecasting Method: This method of estimating working capital requirements involves forecasting of cash receipts and disbursements during a future period of time. Cash forecast will include all possible sources from which cash will be received and the channels in which payments are to be made so that a consolidated cash position is determined.
This method is similar to the preparation of a cash budget. The excess of receipts over payments represents surplus of cash and the excess of payments over receipts causes deficit of cash or the amount of working capital required.
![]()
(iv) Projected Balance Sheet Method: Under this method, projected balance sheet for future date is prepared by forecasting of assets and liabilities by following any of the methods stated above. The excess of estimated total current assets over estimated current liabilities, as shown in the projected balance sheet, is computed to indicate the estimated amount of working capital required.